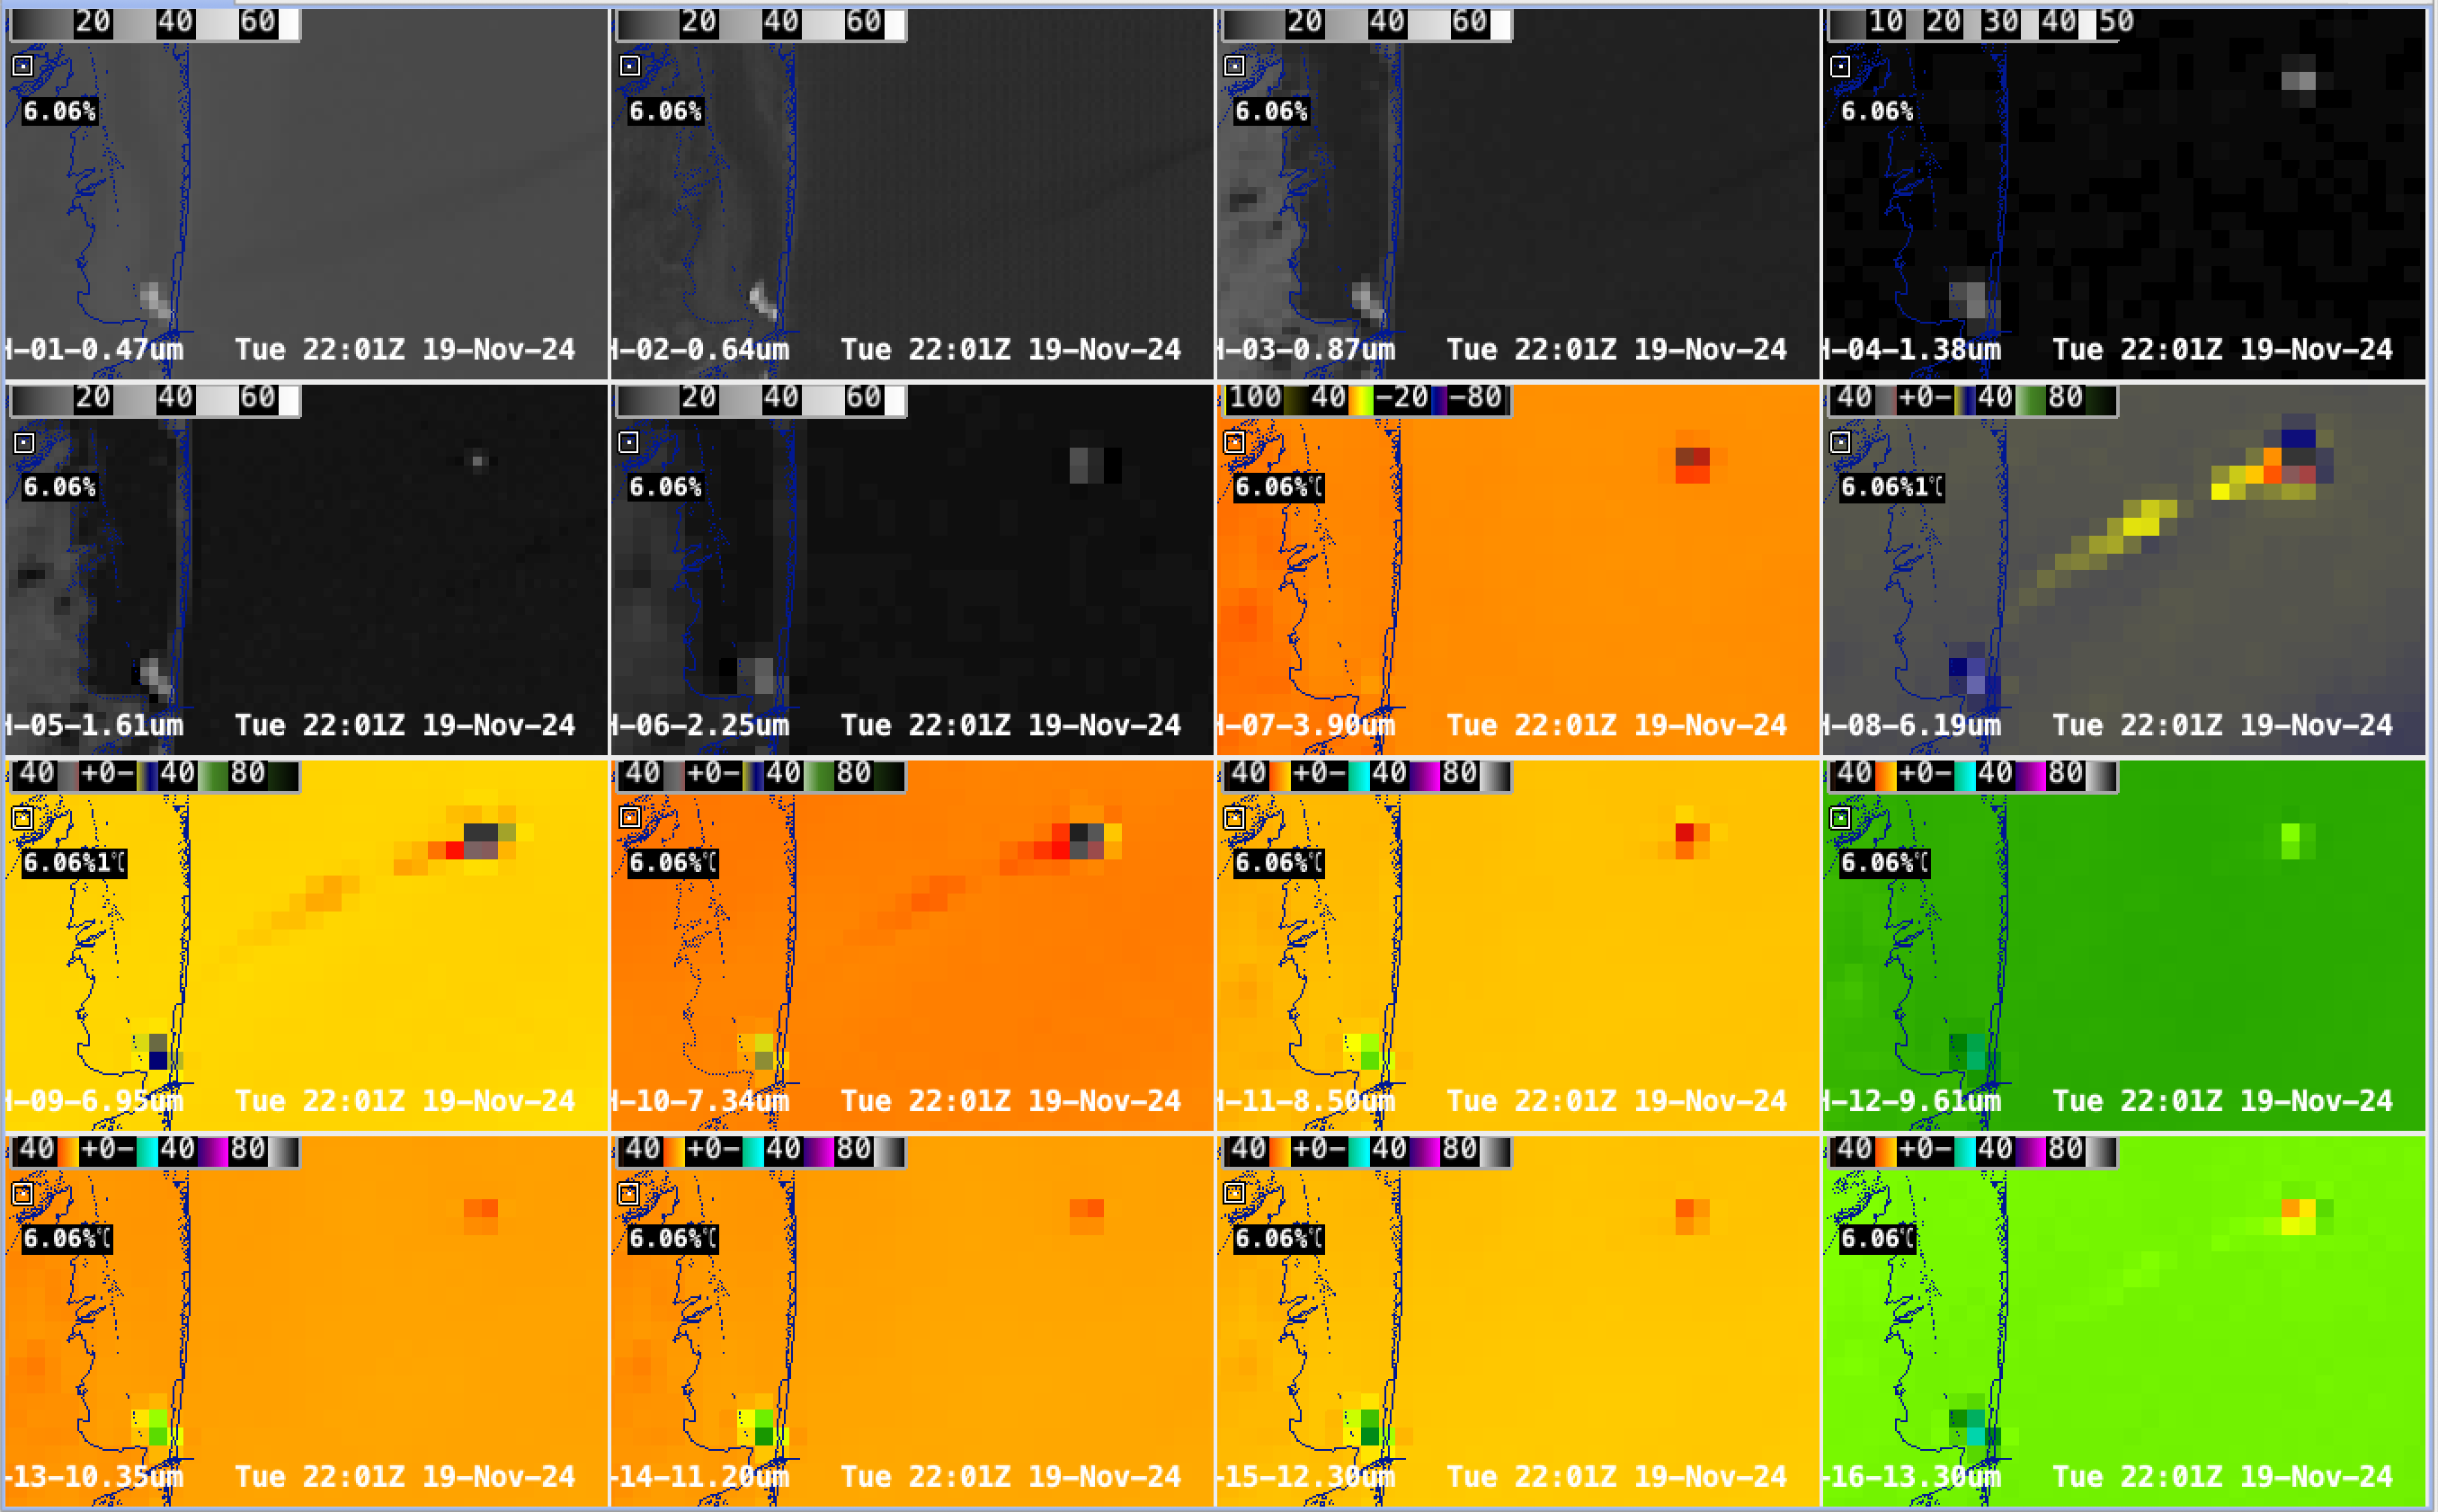
This website works best with a newer web browser such as Chrome, Firefox, Safari or Microsoft Edge. Internet Explorer is not supported by this website.

LightningCast probabilities over Australia

LightningCast is a product within the ProbSevere portfolio that uses 4 ABI (or AHI) channels to estimate the likelihood of a GLM observation within the next 60 minutes. For the past couple years, this product has been used experimentally over Guam (using Himawari-9 data), even though the product was trained using... Read More

Himawari-9 Day Cloud Phase Distinction RGB (left) and LightningCast Probabilities (right), 0000-0400 UTC on 29 March 2024 (Click to enlarge)

LightningCast is a product within the ProbSevere portfolio that uses 4 ABI (or AHI) channels to estimate the likelihood of a GLM observation within the next 60 minutes. For the past couple years, this product has been used experimentally over Guam (using Himawari-9 data), even though the product was trained using GOES-16 data. ABI and AHI channels are similar enough that a useful signal can occur. The animation shows the Himawari-9 Day Cloud Phase RGB (using Band 3, 5 and 13; those 3 bands plus Band 15 are used by the LightningCast algorithm to create probabilities) over northwestern Australia, showing both Darwin and the Tiwi Islands. The contours of the right show the likelihood of a lightning observation within the next 60 minutes. Note how some of the cirrus clouds (yellow in the RGB) have high probabilities whereas others — correctly — have low (usually in regions where the thick cirrus is dissipating). Careful inspection of the animations show that probabilities increase before deep convection is present. That is perhaps more easily seen in the toggle below of imagery at 0250 and 0350 UTC; at 0250 UTC probabilities are elevated in/around Darwin Australia (circled in cyan) with only a few glaciated clouds over land (i.e., clouds that are yellow in the RGB). At 0350 UTC, in contrast, well-developed convection is apparent (with continuing high probabilities) in the same region; lightning is probably occurring.

Himawari-9 Day Cloud Phase Distinction RGB (left) and LightningCast Probabilities (right), 0250 and 0350 UTC on 29 March 2024 (Click to enlarge)

These LightningCast probability fields were computed using CSPP-Geo software; that software is nearing a beta release.

View only this post Read Less

Tools for Forecasting Clouds (on April 8th)

Depending on the needed lead time, there are many ways to estimate the cloud cover on a given day/time. This includes climatology, long-range (global) models, shorter-range (regional) models and then satellite and other measurements. April 8th is a day of increased interest for cloud forecasts. The WFO at Fort Worth (TX) will be providing cloud forecasts,... Read More

Depending on the needed lead time, there are many ways to estimate the cloud cover on a given day/time. This includes climatology, long-range (global) models, shorter-range (regional) models and then satellite and other measurements. April 8th is a day of increased interest for cloud forecasts. The WFO at Fort Worth (TX) will be providing cloud forecasts, starting on March 29th.

GOES-16 ABI band 3 loop from August of 2017 with meso and CONUS sectors. (Credit: J. Feltz, UW/CIMSS).

Climatology

When one is weeks, months or years out, then climatology is the only option for a idea how cloudy a region might be.

The above figure (from this UW/CIMSS Satellite Blog post) is apparently “… all over the internet, showing the cloud climatology (or the study of climate) over the past 28 years compiled from GOES”. Or a loop of each April 8th geostationary image since 1979. Of course these aren’t forecast, just what has happened in the past. There are several other similar climatologies, based on MODIS or re-analyzed data.

Long-range (global) models

Once the event is within a week or so, long-range global NWP offer some guidance regarding locations of low pressure areas and some fronts, links of NOAA forecasts out to 5 and 8 days. A page (by Tomer Burg) with ensembles of NWP cloud forecasts. Cloud forecasts, by Fort Worth (TX) NWS will be starting on March 29th.

Shorter-range (regional) models

Once the target date is within a few days, higher resolution regional models will offer guidance. Most numerical prediction models do not include the effect of the reduced solar radiation associated with a total solar eclipse, but we know that the reduced surface heating can decrease clouds such as fair-weather cumulus. NOAA’s HRRR model (“total cloud cover”) is one that apparently will take this eclipse into account.

Each NWS WFO also offers a short-term cloud cover forecast (mouse over “sky cover” and then the times to the right). Or these experimental pages.

Satellites

The day of the event, one can look at many observations, those from satellite include NOAA’s GOES ABI, from many sources (NOAA, geosphere, (M1), slider, RealEarth and SSEC). Many links can be found to GOES animations. Which spectral bands or combinations to use depend on the time of day, etc.

Summary

Of course if one doesn’t see the Sun from the Earth during the eclipse due to heavy cloud cover, one can always see the moon’s shadow on the Earth from GOES and other satellites. including the eclipse from 2017.

The SUVI on the GOES also allows for routine images of the Sun.

Be safe.

H/T

Thanks to the UW-Madison, SSEC; SSEC Data Services and UW/AOS. Thanks also for the Eclipse Predictions by Fred Espenak, NASA’s GSFC. And thanks to those who have blogged regarding this 2024 event. Several of the images in this blog were made using McIDAS-X. Some models forecast out to 16 days, but the question is to what skill level for clouds. T. Schmit works for NOAA/NESDIS/STAR and is stationed in Madison, WI.

View only this post Read Less

Blowing snow and blowing dust in Grand Forks ND

GOES-16 (GOES-East) Day Snow-Fog RGB and Dust RGB images (above) dispayed signatures of convective snow showers (shades of white in Day Snow-Fog RGB imagery) and blowing dust (brighter shades of pink in Dust RGB imagery) that created an unusual combination of blowing snow (BLSN) and blowing dust (BLDU) at Grand Forks, North Dakota... Read More

GOES-16 Day Snow-Fog RGB and Dust RGB images, from 1801 UTC on 26 March to 0001 UTC on 27 March [click to play animated  GIF | MP4]

GOES-16 (GOES-East) Day Snow-Fog RGB and Dust RGB images (above) dispayed signatures of convective snow showers (shades of white in Day Snow-Fog RGB imagery) and blowing dust (brighter shades of pink in Dust RGB imagery) that created an unusual combination of blowing snow (BLSN) and blowing dust (BLDU) at Grand Forks, North Dakota (KGFK) on 26 March 2024.

GOES-16 Dust RGB images without plots of METAR reports are shown below. In this case, the Gamma values for each RGB component were adjusted in Composite Options, to further enhance the brighter pink appearance of the blowing dust.

GOES-16 Day Dust RGB images (without plots of METAR reports), from 1801 UTC on 26 March to 0001 UTC on 27 March [click to play animated  GIF | MP4]

Strong northerly winds that day were being channeled (and further accelerated) down the Red River Valley (below).

GOES-16 Dust RGB image at 2101 UTC, along with an image of topography [click to enlarge]

The GOES-16 Day Snow-Fog RGB image at 1801 UTC (below) showed that while much of southern and western North Dakota had appreciable snow cover (darker shades of red), snow cover was sparse across the northeastern part of the state (Grand Forks only had a Trace of snow on the ground that morning).

GOES-16 Day Snow-Fog RGB image at 1801 UTC [click to enlarge]

Locations to the north and northwest of Grand Forks lacking snow cover served as a source region for the blowing dust — a toggle between NOAA-20 and Suomi-NPP VIIRS True Color RGB  images from the VIIRS Today site (below) showed the development of elongated dust plumes in that area.

VIIRS True Color RGB images from NOAA-20 and Suomi-NPP, centered over Devils Lake in northeastern North Dakota on 26 March [click to enlarge]

______________

On the following day, GOES-16 True Color RGB images from the CSPP GeoSphere site (below) displayed numerous long, narrow streaks of fresh snow cover — oriented from north to south — that were produced by the convective snow showers on 26 March. Given that the new snowfall amounts within those narrow streaks were generally light (Grand Forks only reported about 1 inch of new snow), they melted rather quickly.

GOES-16 True Color RGB images, from 1301-1801 UTC on 27 March [click to play MP4 animation]

View only this post Read Less

NUCAPS Profiles over Guam

The addition of a 2nd satellite (MetopC) producing NUCAPS profiles means that places such as Guam have twice as much Satellite information over the otherwise data-sparse western Pacific Ocean. The three-panel above shows the 1200 UTC sounding at Guam (on the left) with a nearly coincident 1208 UTC NUCAPS profile... Read More

Guam 1200 UTC Sounding (left), NOAA-20 NUCAPS Sounding, 1208 UTC (middle) and MetopC NUCAPS Sounding, 1516 UTC (right) on 26 March 2024 (Click to enlarge)

The addition of a 2nd satellite (MetopC) producing NUCAPS profiles means that places such as Guam have twice as much Satellite information over the otherwise data-sparse western Pacific Ocean. The three-panel above shows the 1200 UTC sounding at Guam (on the left) with a nearly coincident 1208 UTC NUCAPS profile from NOAA-20 data in the middle, and a 1516 UTC MetopC NUCAPS profile on the right. It’s a lot easier to use these satellite soundings to infer how things are changing because of the increased number of soundings available. The toggle below compares the two NUCAPS profiles.

NOAA-20 NUCAPS (1208 UTC) and MetopC NUCAPS (1516 UTC) on 26 March 2024 (Click to enlarge)

The Sounding Availability Plot from AWIPS, below, shows the distribution of points from the NOAA-20 and MetopC overpasses centered on the island of Guam. The points chosen above were the closest ones to the island of Guam.

NUCAPS Sounding Availability at 1114 (NOAA-20) and 1414 UTC (MetopC) on 26 March 2024 (Click to enlarge)

Gridded NUCAPS fields are also created in AWIPS from these vertical profiles. Those fields allow a user to easily pick out gradients and thresholds.

View only this post Read Less