Severe thunderstorms across parts of Texas, Louisiana Mississippi and Alabama — with heavy rainfall and tornadoes in southern Louisiana

30-second (ending at 1200 UTC) and 1-minute GOES-16 “Clean” Infrared Window (10.3 µm) images from 1020-1725 UTC on 10 April, with time-matched (within +/- 3 minutes) SPC Storm Reports plotted in cyan [click to play animated GIF | MP4]

1-minute GOES-16 “Red” Visible (0.64 µm) images from 1201-1725 UTC on 10 April, with time-matched (within +/- 3 minutes) SPC Storm Reports plotted in red [click to play animated GIF | MP4]

1-minute GOES-16 (10.3 µm) Infrared images from 1200-1900 UTC on 10 April, with plots of 15-minute METAR surface reports (cyan) and 1-hour precipitation accumulation (green) [click to play animated GIF | MP4]
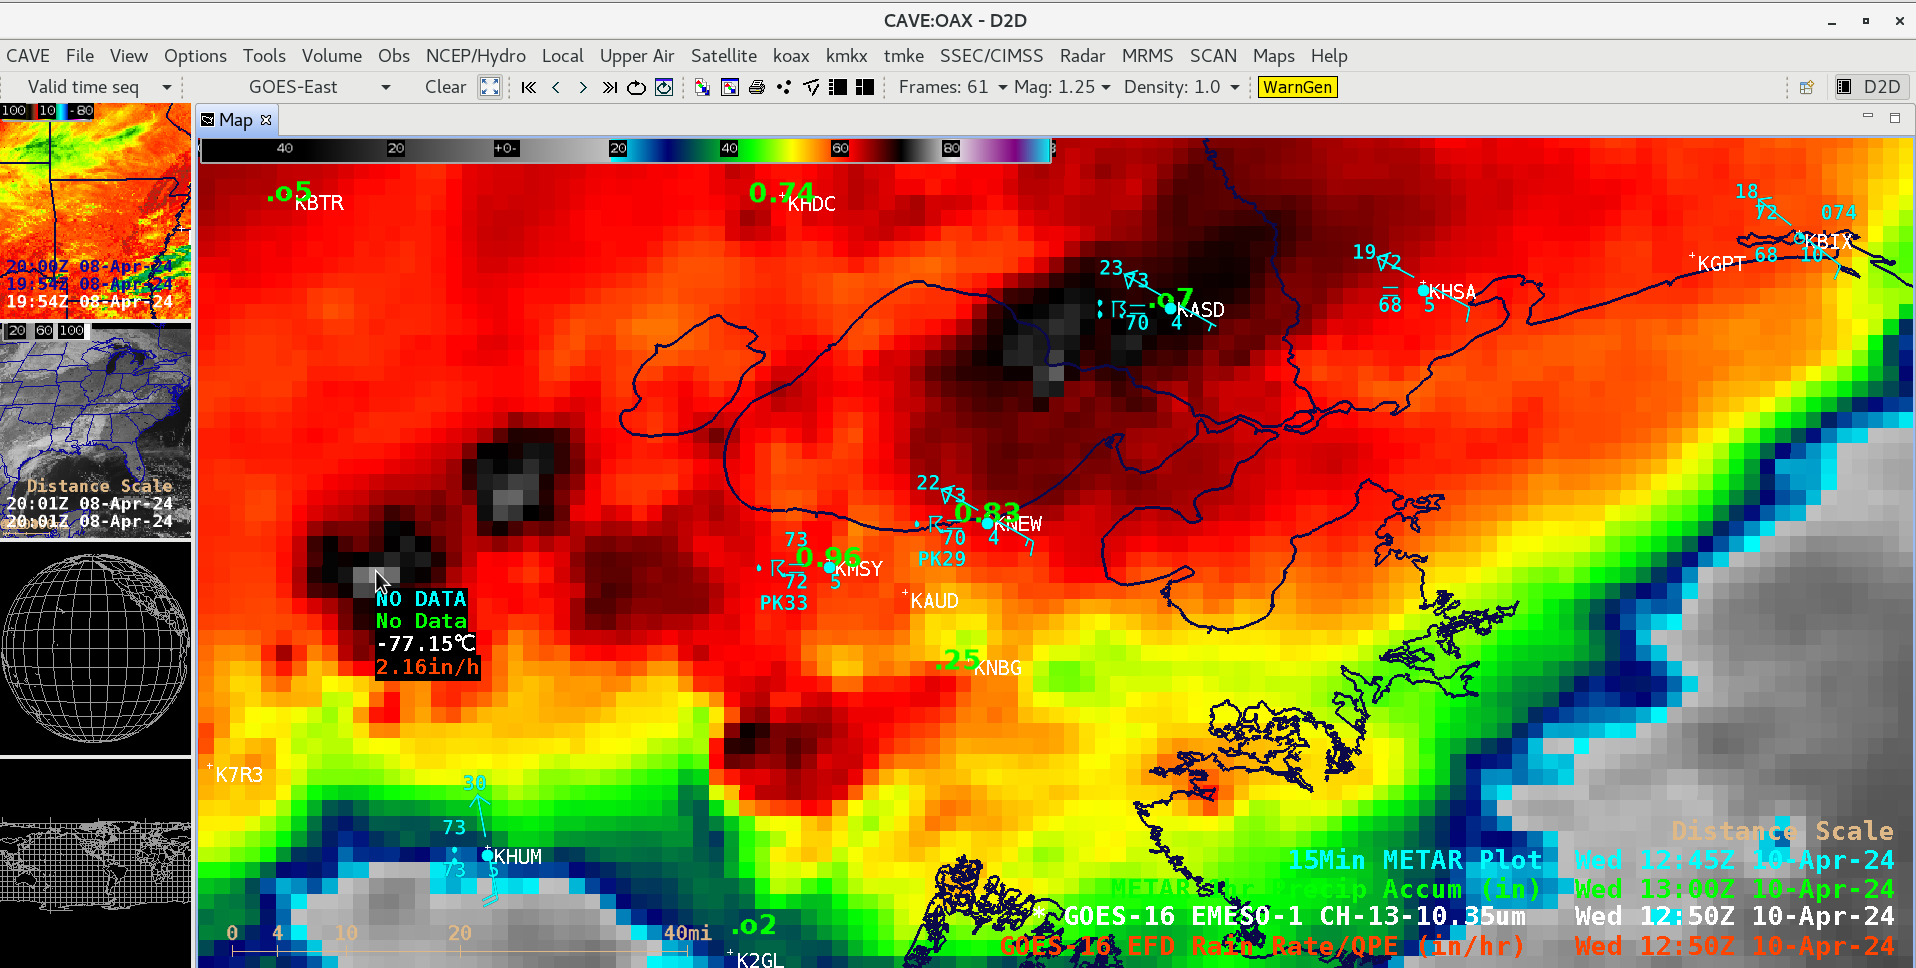
Cursor sample of the 1250 UTC GOES-16 cloud-top 10.3 µm infrared brightness temperature (white) along with the corresponding GOES-16 Rain Rate derived product (red) [click to enlarge]
30-second GOES-16 Infrared (10.3 µm) images from 1100-1200 UTC on 10 April, with plots of 15-minute METAR surface reports (cyan) and hourly fixed buoy reports (yellow) [click to play animated GIF | MP4]
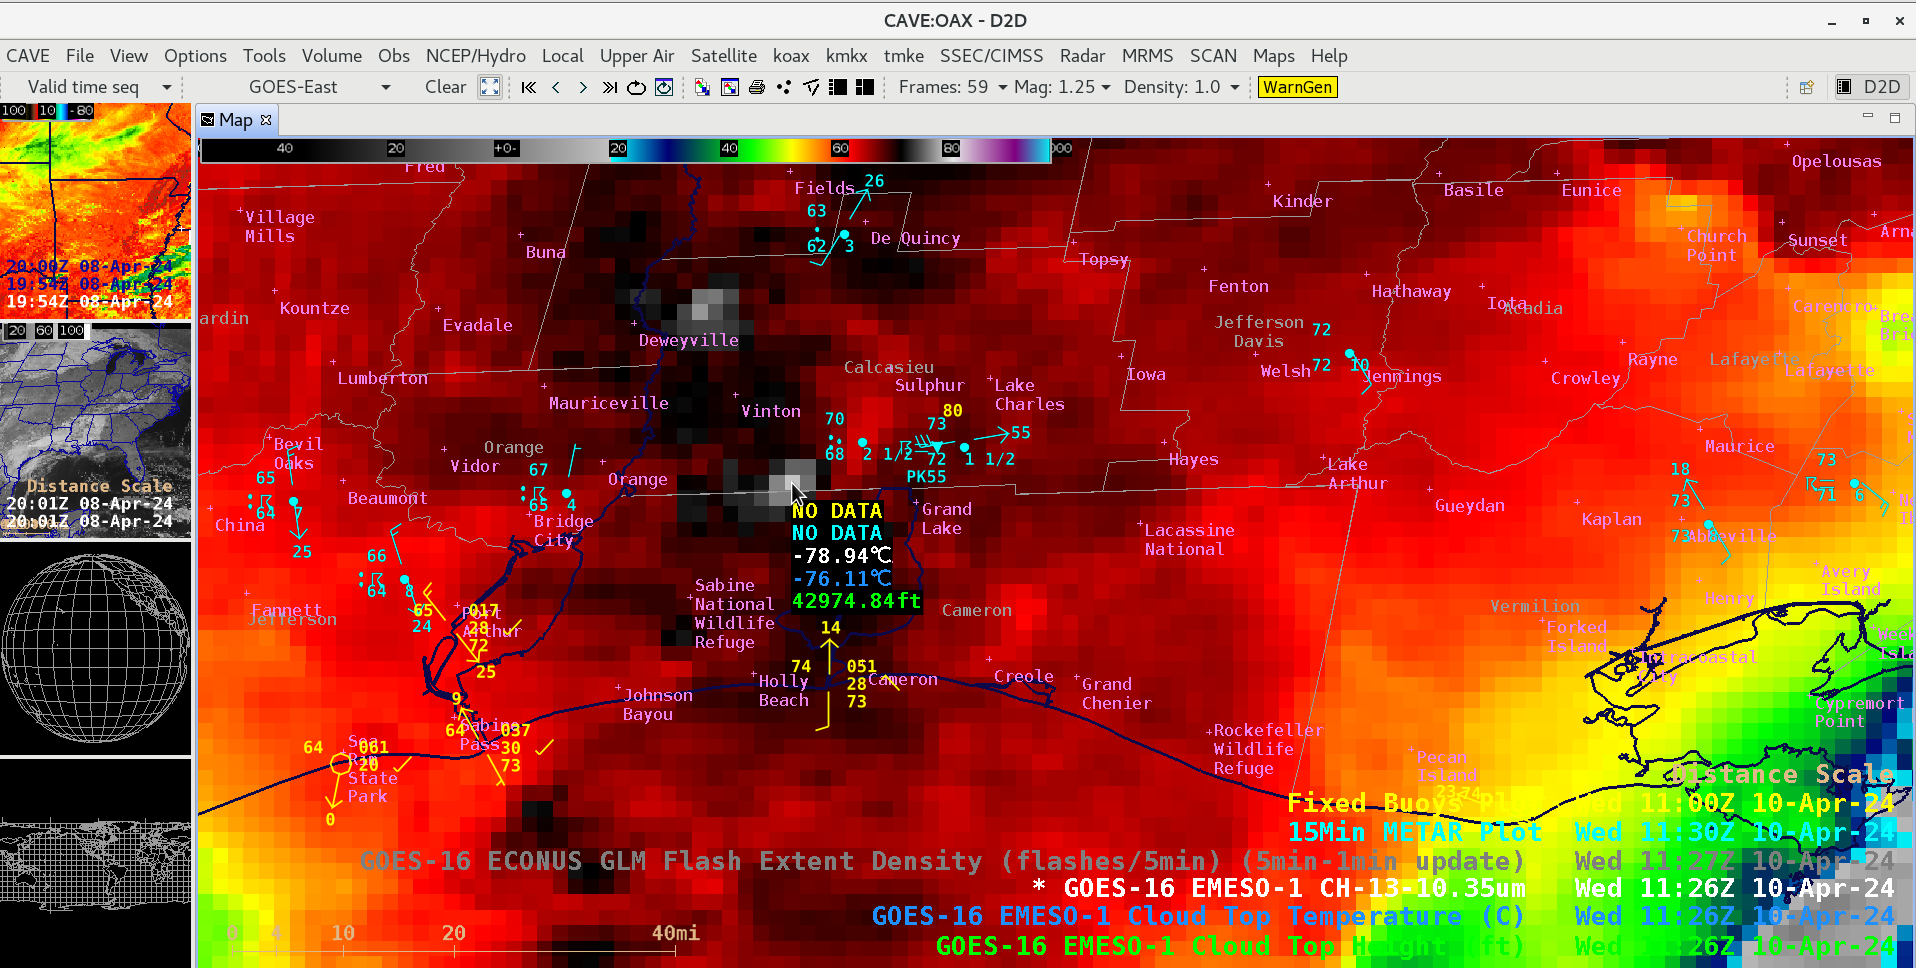
Cursor sample of 1126 UTC GOES-16 cloud-top 10.3 µm infrared brightness temperature (white) along with the corresponding GOES-16 Cloud Top Temperature (blue) and Cloud Top Height (green) derived products [click to enlarge]
30-second GOES-16 Infrared (10.3 µm) images with an overlay of GLM Flash Extent Density from 1100-1200 UTC on 10 April, including plots of 15-minute METAR surface reports (cyan) and hourly fixed buoy reports (yellow) [click to play animated GIF | MP4]