This website works best with a newer web browser such as Chrome, Firefox, Safari or Microsoft
Edge. Internet Explorer is not supported by this website.
5-minute CONUS Sector GOES-16 (GOES-East) Nighttime Microphysics RGB + daytime True Color RGB images from the CSPP GeoSphere site (above) displayed the nocturnal thermal signatures (darker shades of violet) of a few wildfires in the vicinity or the New Jersey-New York border — particularly that associated with the larger and persistent Jennings Creek... Read More
GOES-16 Nighttime Microphysics + daytime True Color RGB images, from 2131 UTC on 8th November to 2106 UTC on 9th November [click to play MP4 animation]
5-minute CONUS Sector GOES-16 (GOES-East)Nighttime Microphysics RGB + daytime True Color RGB images from the CSPP GeoSphere site (above) displayed the nocturnal thermal signatures (darker shades of violet) of a few wildfires in the vicinity or the New Jersey-New York border — particularly that associated with the larger and persistent Jennings Creek Wildfire along the border — along with the distinct Jennings Creek Wildfire smoke plume that moved southeast across the New York City area and adjacent offshore waters during the day on 9th November 2024. The fire caused some local road closures, and there was 1 firefighter fatality.
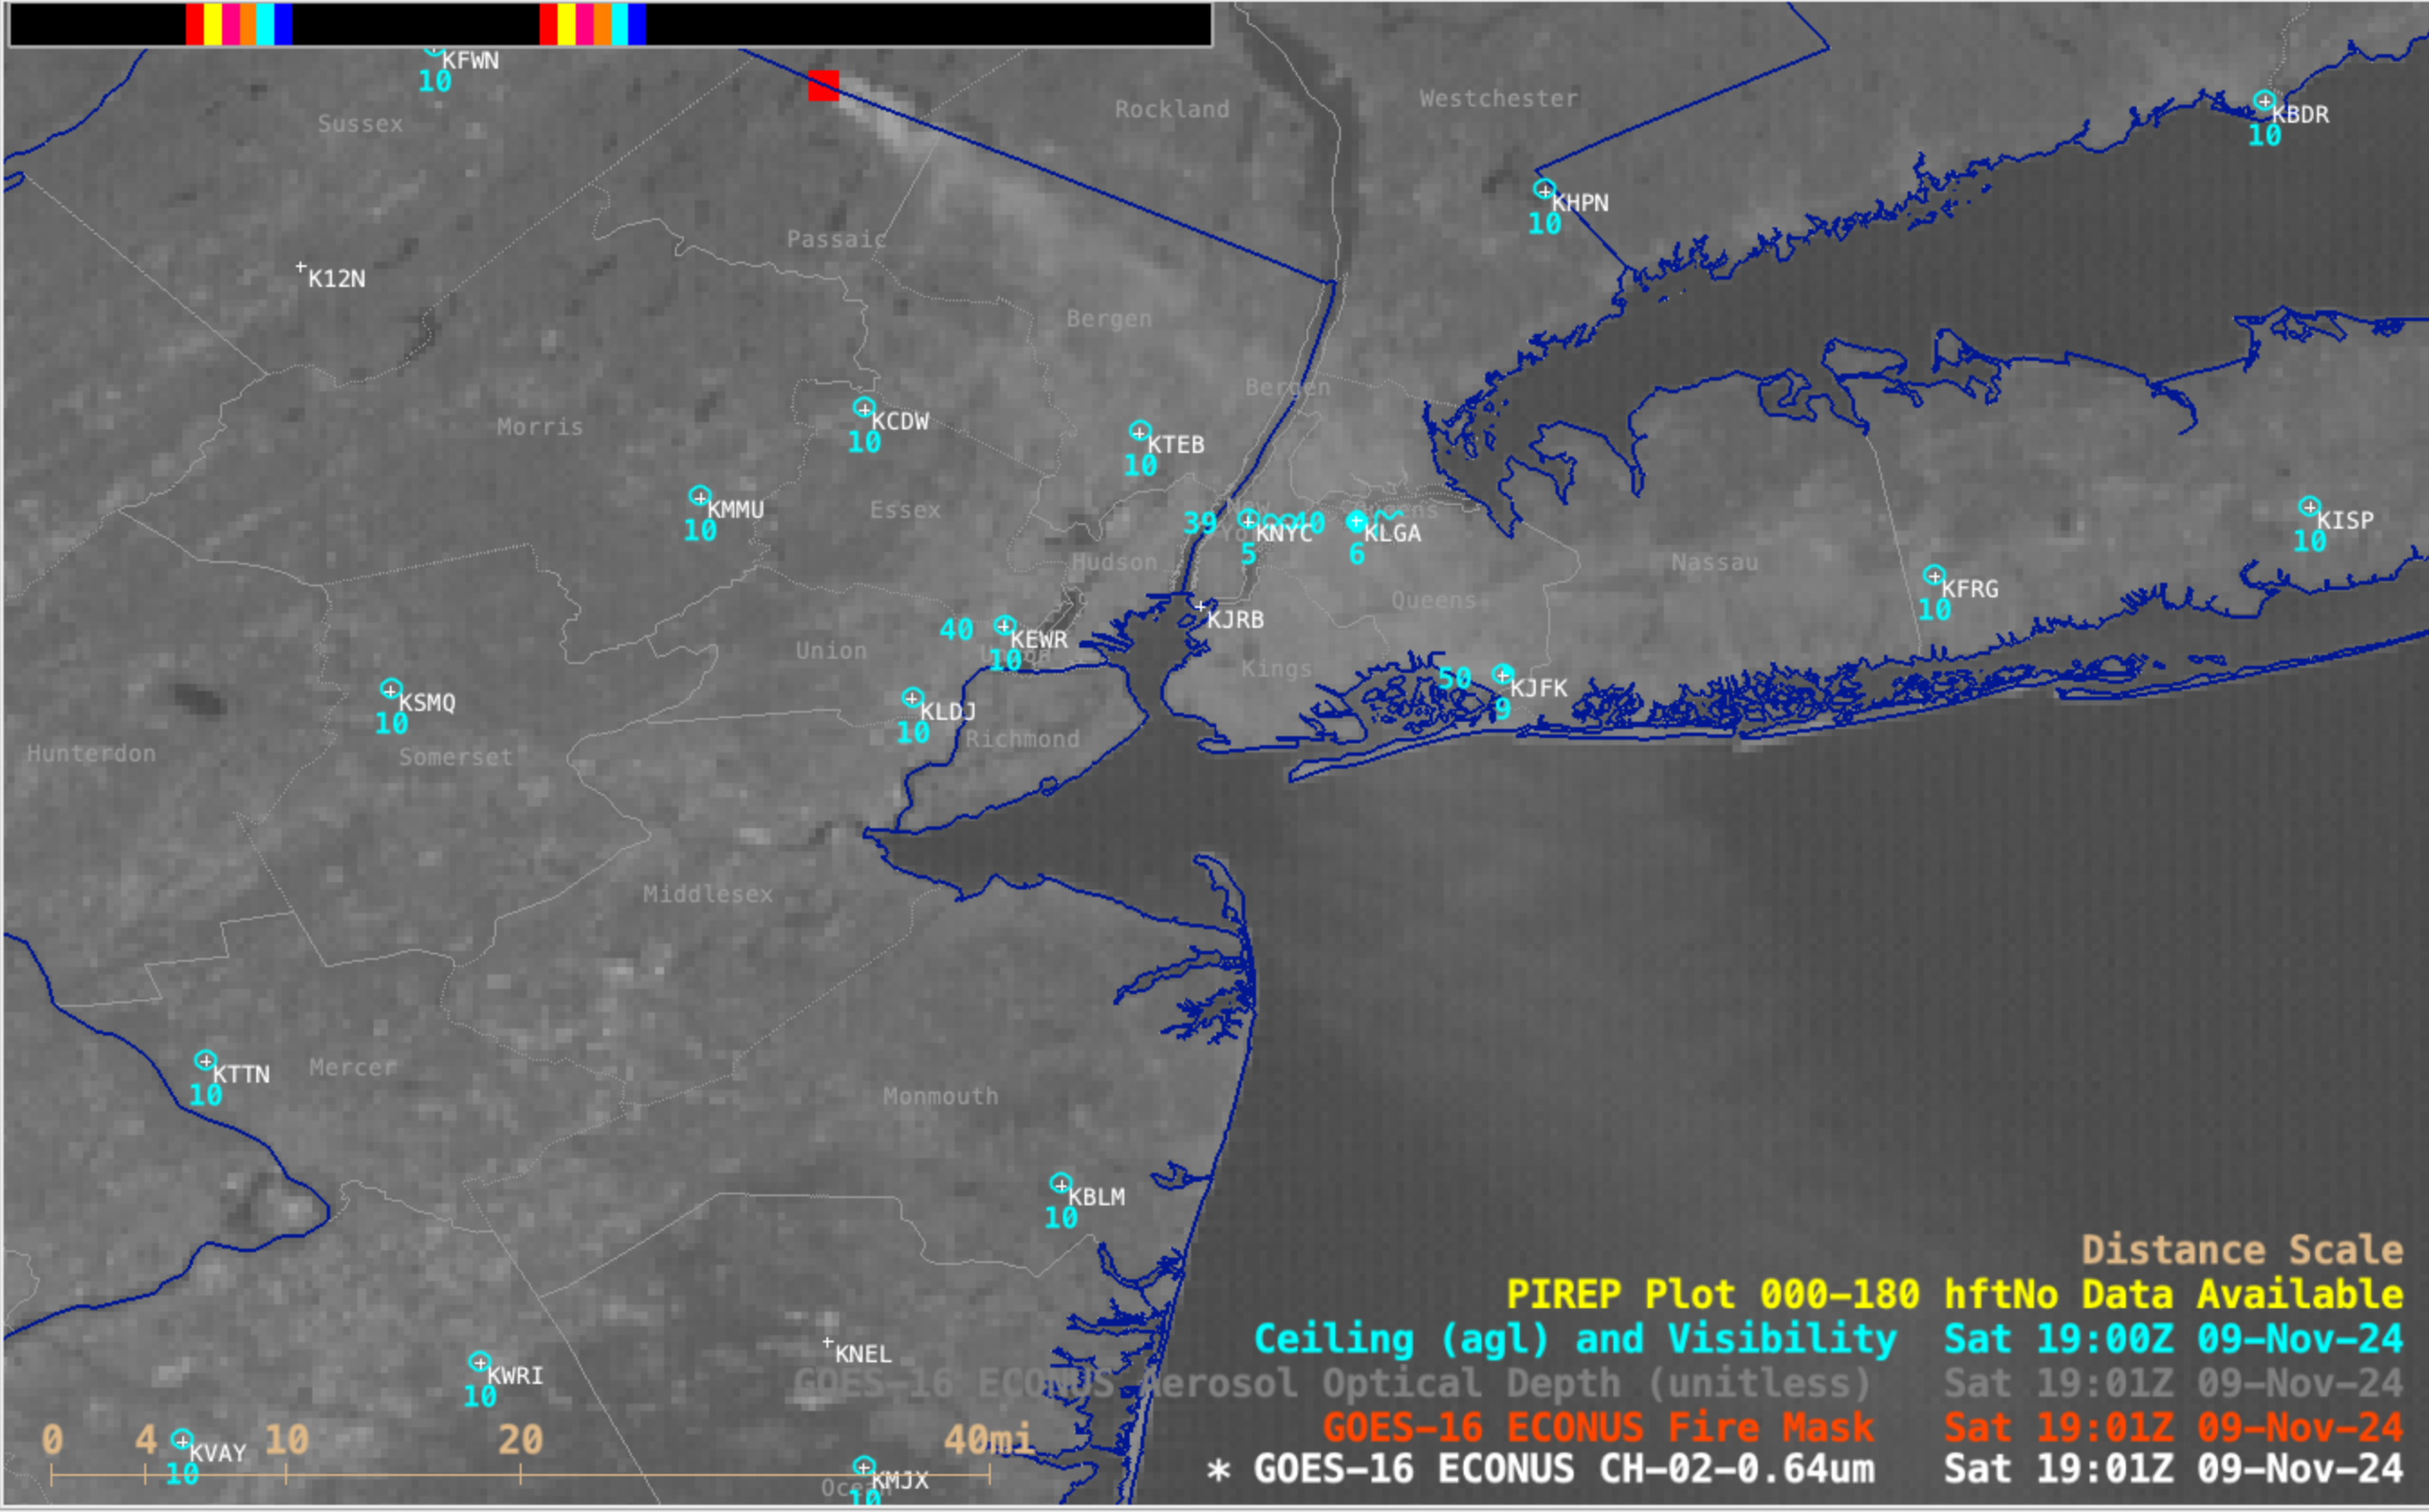
GOES-16 Visible images with an overlay of the Fire Mask derived product (a component of the FDCA) (below) also displayed the Jennings Creek Wildfire thermal signature and smoke plume — plots of Ceiling and Visibility showed that this smoke occasionally reduced the surface visibility to 4-6 miles at a few of the New York City area airports (visibility in miles is the number plotted to the bottom left of each 4-letter station identifier).
GOES-16 Red Visible (0.64 µm) images, with an overlay of the GOES-16 Fire Mask derived product and hourly plots of Ceiling and Visibility (cyan) [click to play MP4 animation]
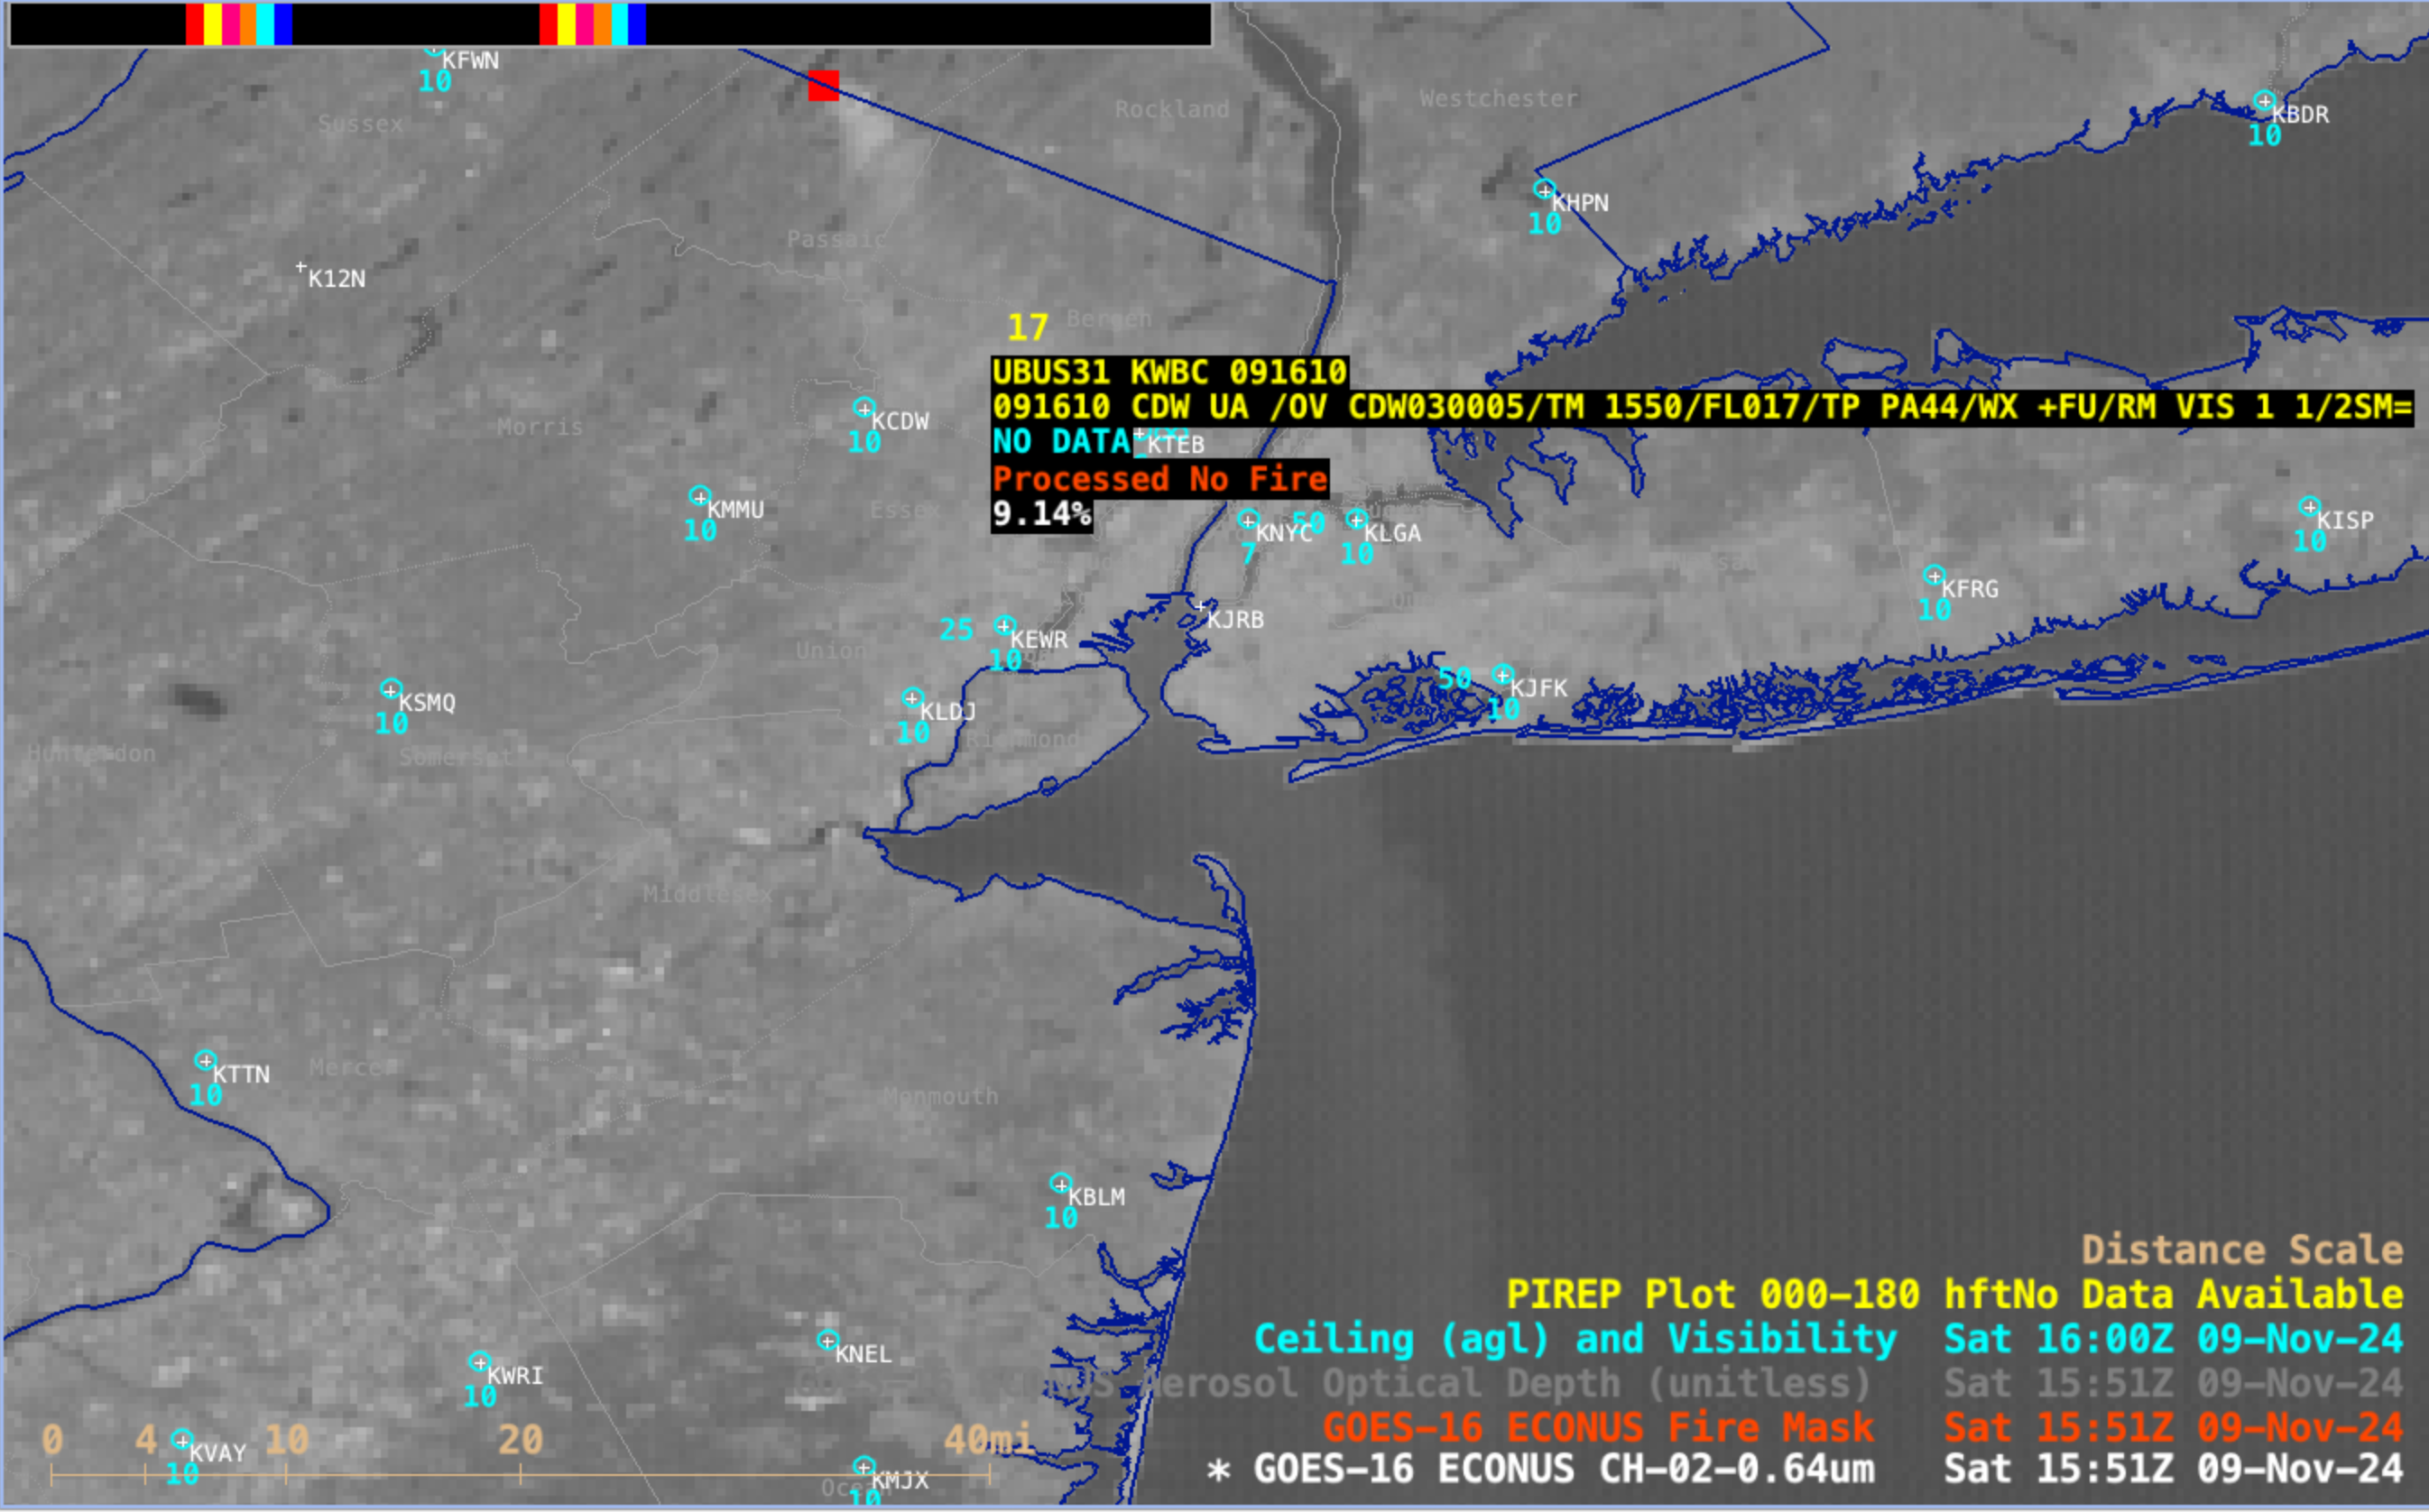
A Pilot Report over far northeast New Jersey at 1550 UTC (below) indicated the presence of heavy smoke (+FU) at an altitude of 1700 ft — which was restricting the flight-level visibility to 1-1/2 statute miles.
GOES-16 Red Visible (0.64 µm) image with an overlay of the GOES-16 Fire Mask derived product at 1551 UTC — and cursor sampling of a Pilot Report at 1550 UTC [click to enlarge]
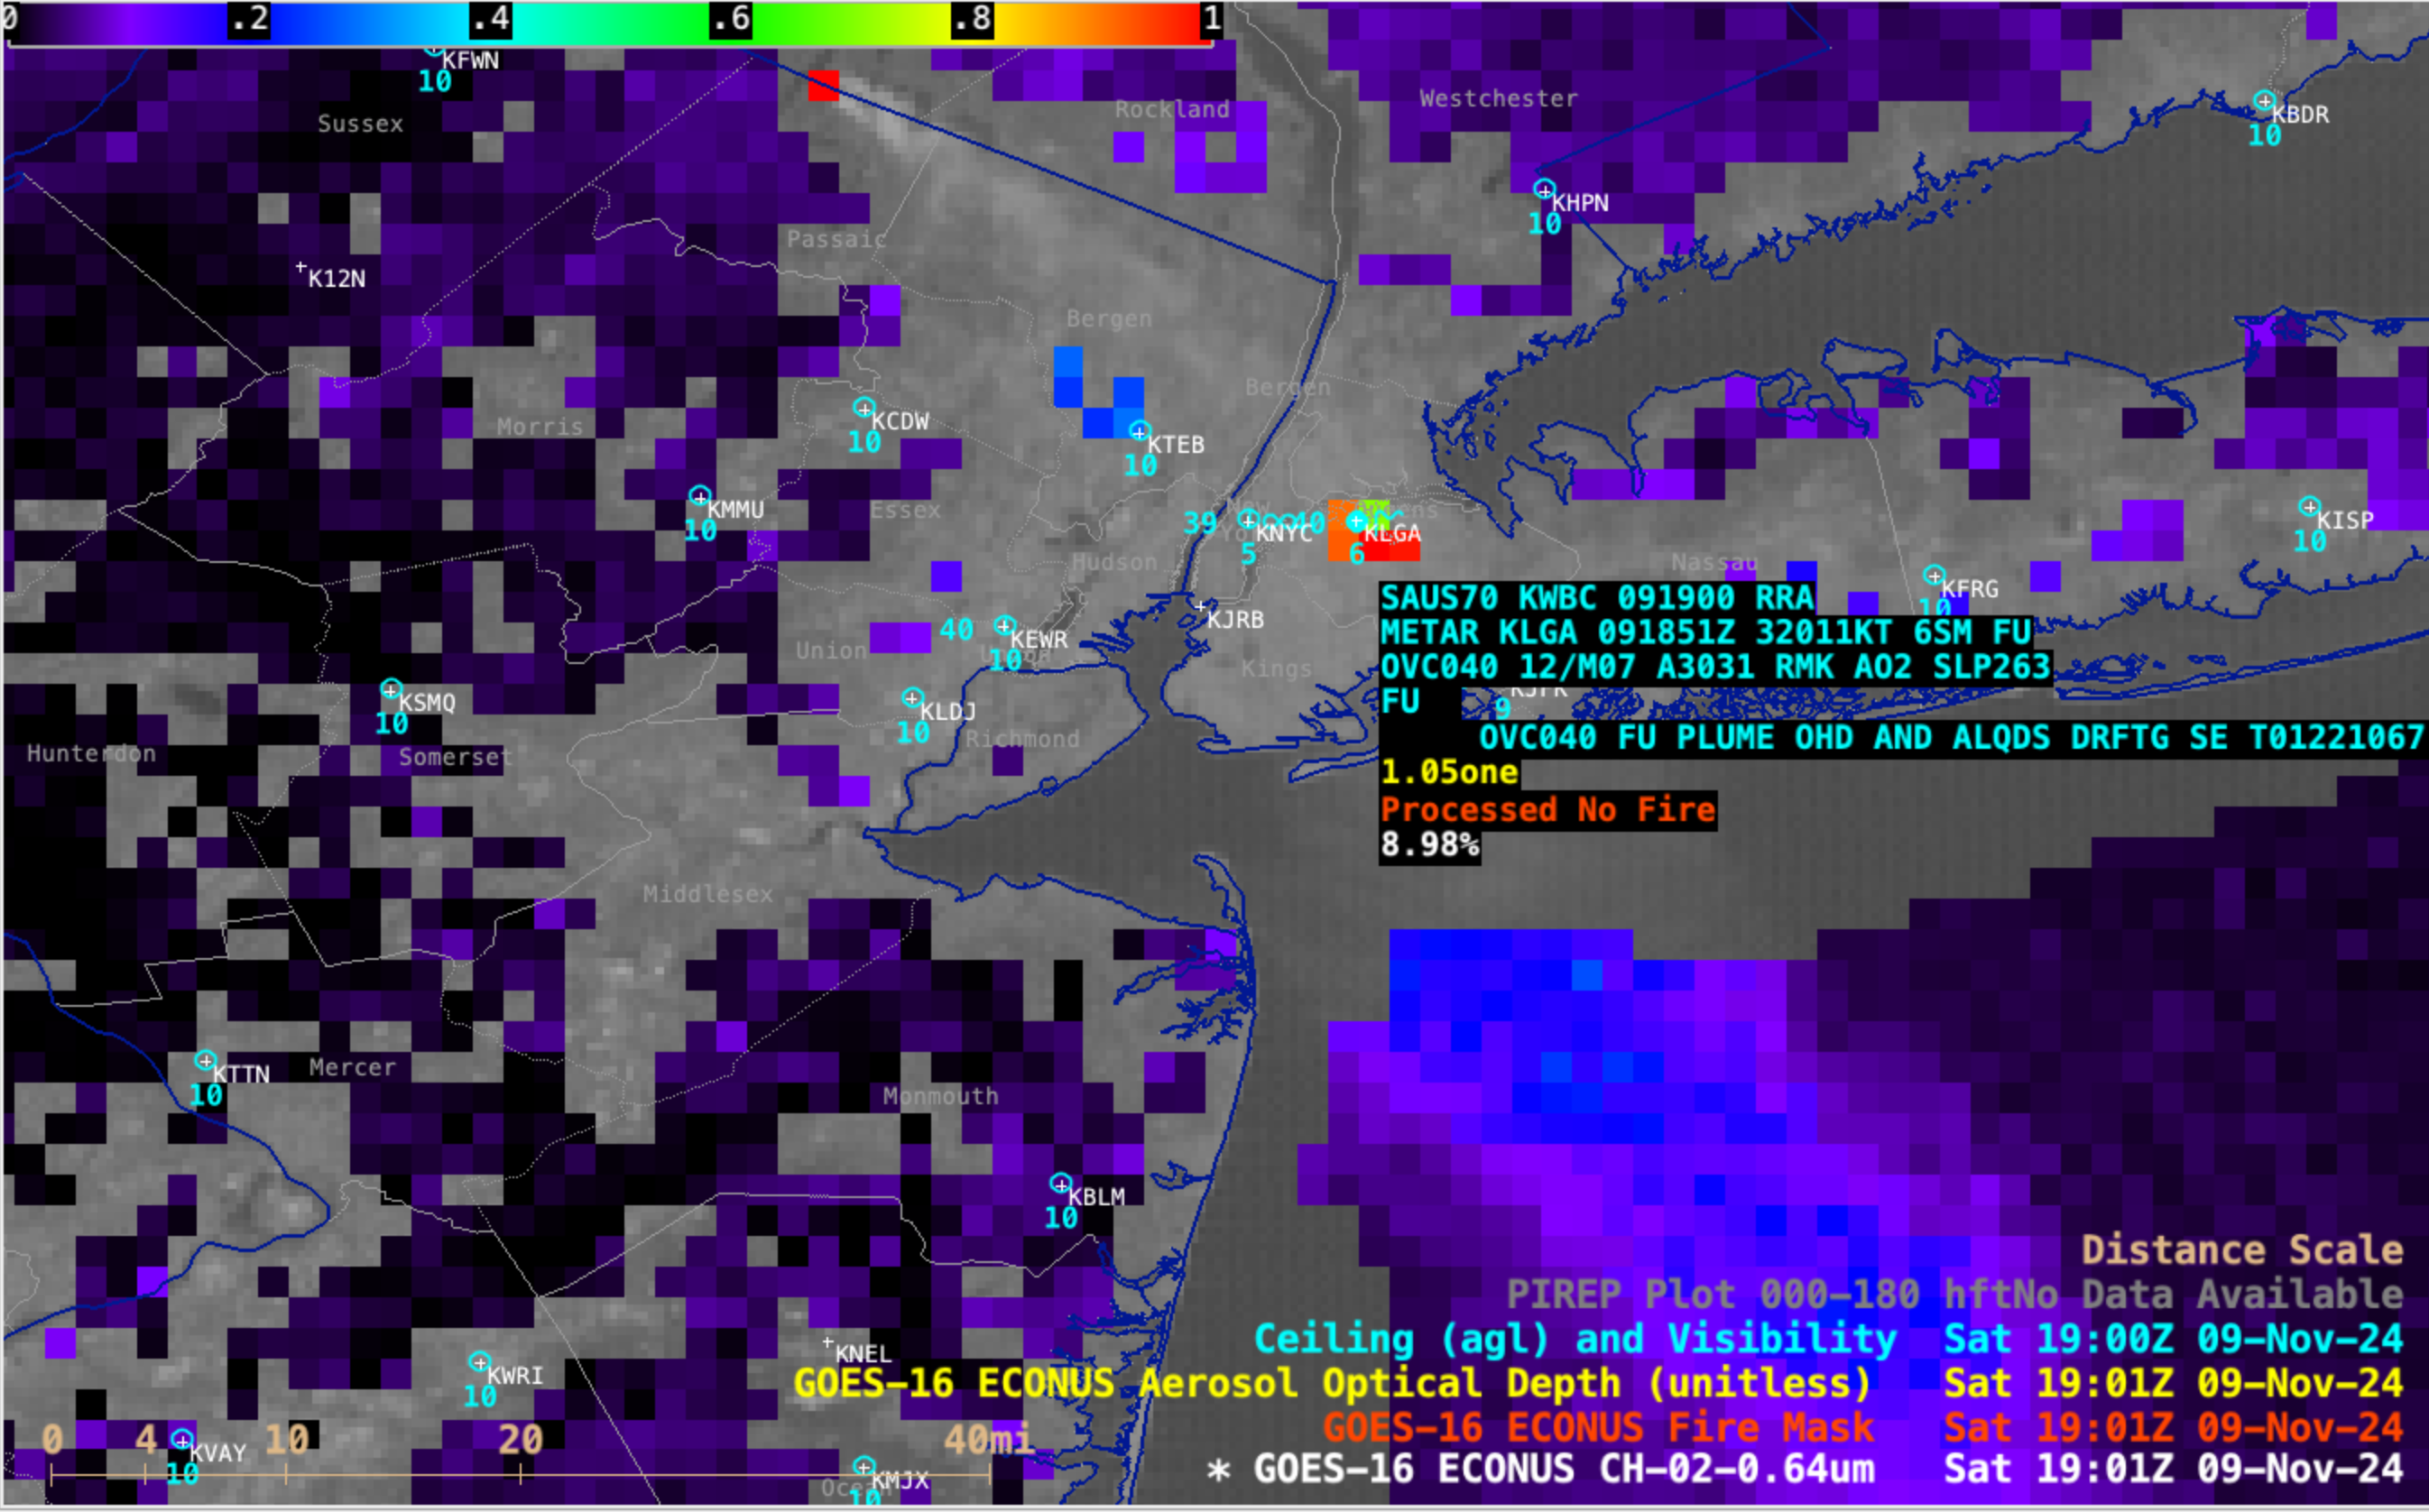
GOES-16 Aerosol Optical Depth values over the NYC area were occasionally at or slightly above 1.0, as depicted by darker red pixels (below).
GOES-16 Red Visible (0.64 µm) image with an overlay of the GOES-16 Fire Mask and Aerosol Optical Depth (AOD) derived products at 1901 UTC — and cursor sampling of the LaGuardia Airport METAR (cyan) and nearby AOD value (yellow) [click to enlarge]
NEW INCIDENT – WILDFIRE ALERT: Jennings Creek Wildfire – West Milford, Passaic County@NJDEPForestFire is on scene of a wildfire burning in the area of Greenwood Lake Turnpike and East Shore Rd in West Milford, Passaic County. The fire is also burning in Orange County, New York. pic.twitter.com/fBo98MFVPh
— New Jersey Forest Fire Service (@njdepforestfire) November 9, 2024
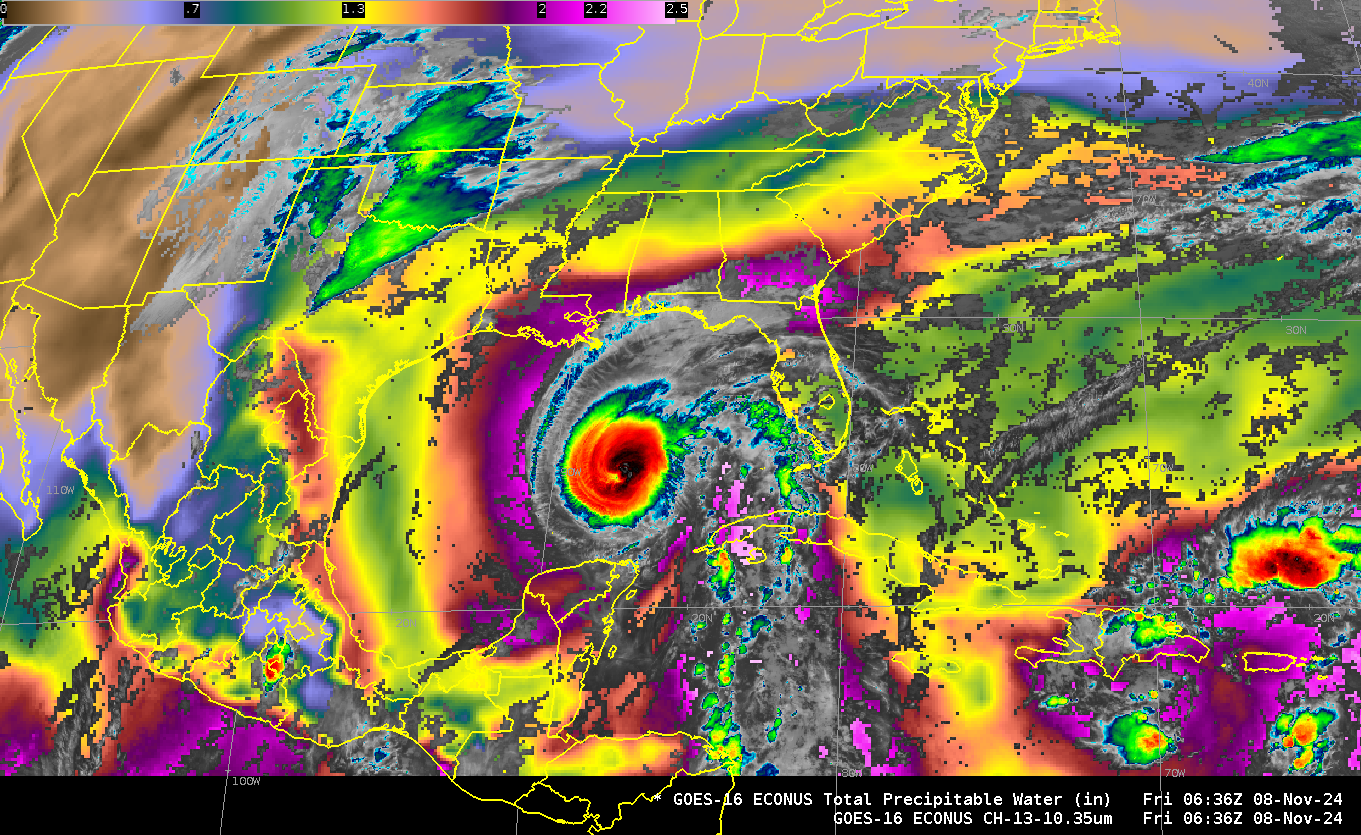
Hurricane Rafael is in the Gulf of Mexico, drifting to the west. The MIMIC Total Precipitable Water (TPW) animation, above, shows a notable thinning in the band of moisture connecting Rafael to deep tropical moisture located over the southern Caribbean Ocean. Dry air from the Yucatan is also wrapping into... Read More
MIMIC Total Precipitable Water, 1700 UTC 7 November – 1600 UTC 8 November 2024 (click to enlarge)
Hurricane Rafael is in the Gulf of Mexico, drifting to the west. The MIMIC Total Precipitable Water (TPW) animation, above, shows a notable thinning in the band of moisture connecting Rafael to deep tropical moisture located over the southern Caribbean Ocean. Dry air from the Yucatan is also wrapping into the circulation, and dry air is east of Rafael (over Florida), north of Rafael (along the southern Gulf Coast) and west of Rafael.
The animation below shows clear-sky Level 2 Total Precipitable Water (TPW) fields from GOES-16, with Band 13 imagery in regions where clouds are present. There is warming of the cold cloud tops during the 14 hours of the animation; one might also infer a decrease in TPW in the feed of moisture linking Rafael in the Gulf to the moisture in the southern/western Caribbean Sea — that is, an agreement with the MIMIC TPW fields above.
GOES-16 Total Precipitable Water and Band 13 Infrared Imagery (10.3 µm), 0236 – 1706 UTC on 8 November 2024 (click to enlarge)
GOES-16 Water Vapor infrared imagery (Band 9, “Mid-level” water vapor, 6.95 µm), below, also shows dry mid-level air surrounding Rafael. The eye of the Hurricane is apparent early in the animation below, but then fills.
GOES-16 Band 9 Infrared Imagery (“Mid-level” Water Vapor, 6.95 µm), 0236 – 1706 UTC on 8 November 2024 (click to enlarge)
Visible Imagery, below, plotted with GLM observations of Flash Extent Density (scaled from 0-16) show a compact storm with lightning occasionally occurring near the center. A distinct eye is not present. The storm will pass very near mid-Gulf Buoy 42001 during the day today.
GOES-16 Visible Imagery (Band 2, 0.64 µm), 1501-1816 UTC on 8 November 2024 along with GLM Flash Extent Density and Buoy Reports (click to enlarge)
For more information on Rafael, refer to the National Hurricane Center website here.
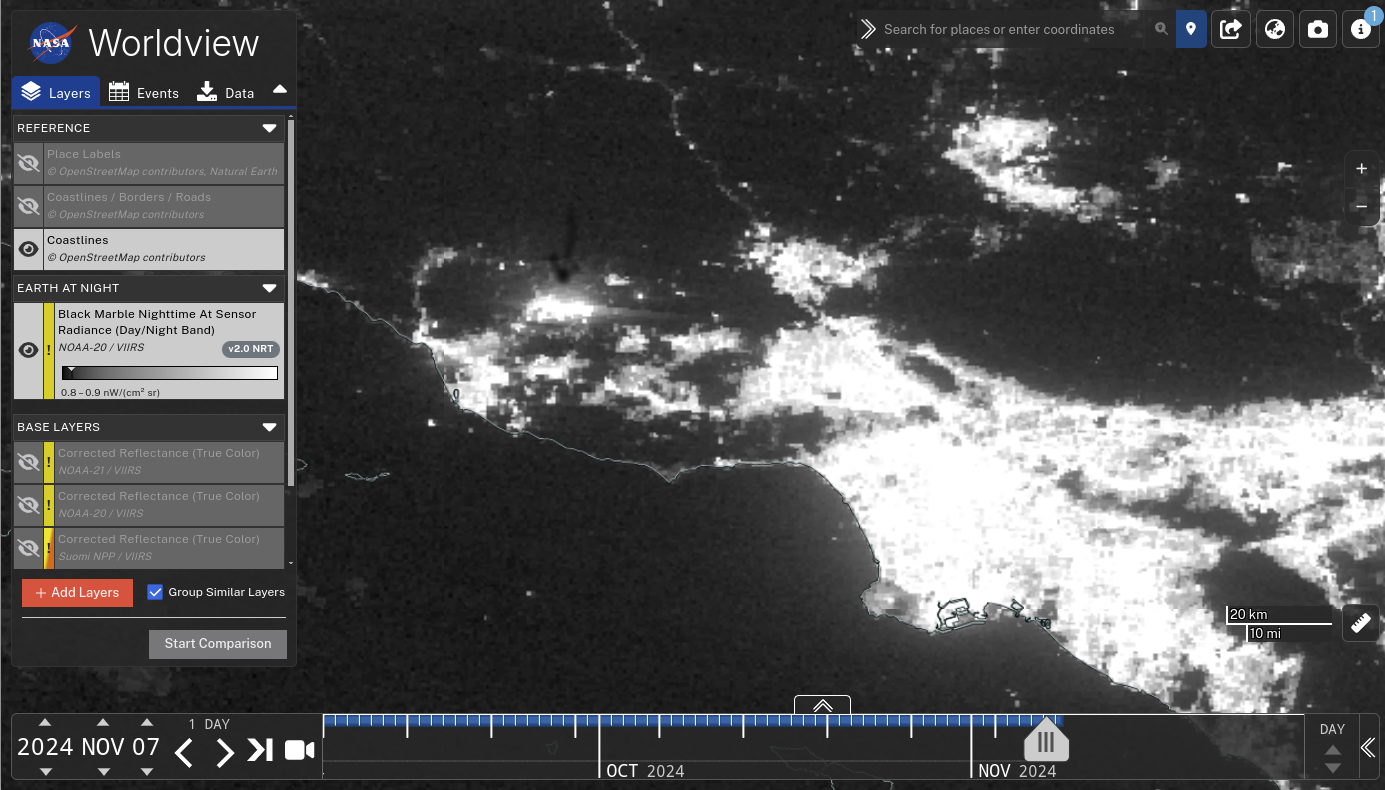
Day Night Band imagery from NOAA-20, below, captured from the NASA Worldview site, shows a great increase in emitted light associated with the Mountain Fireon 7 November over Ventura County, CA, to the north of Los Angeles. This occurred during a time with little lunar illumination — when moonlight is available, the smoke plume... Read More
NOAA-20 Day Night Band visible (0.7 µm) imagery over Southern California, 5, 6, 7 November 2024 (Click to enlarge)
Day Night Band imagery from NOAA-20, below, captured from the NASA Worldview site, shows a great increase in emitted light associated with the Mountain Fireon 7 November over Ventura County, CA, to the north of Los Angeles. This occurred during a time with little lunar illumination — when moonlight is available, the smoke plume of fires can be revealed.
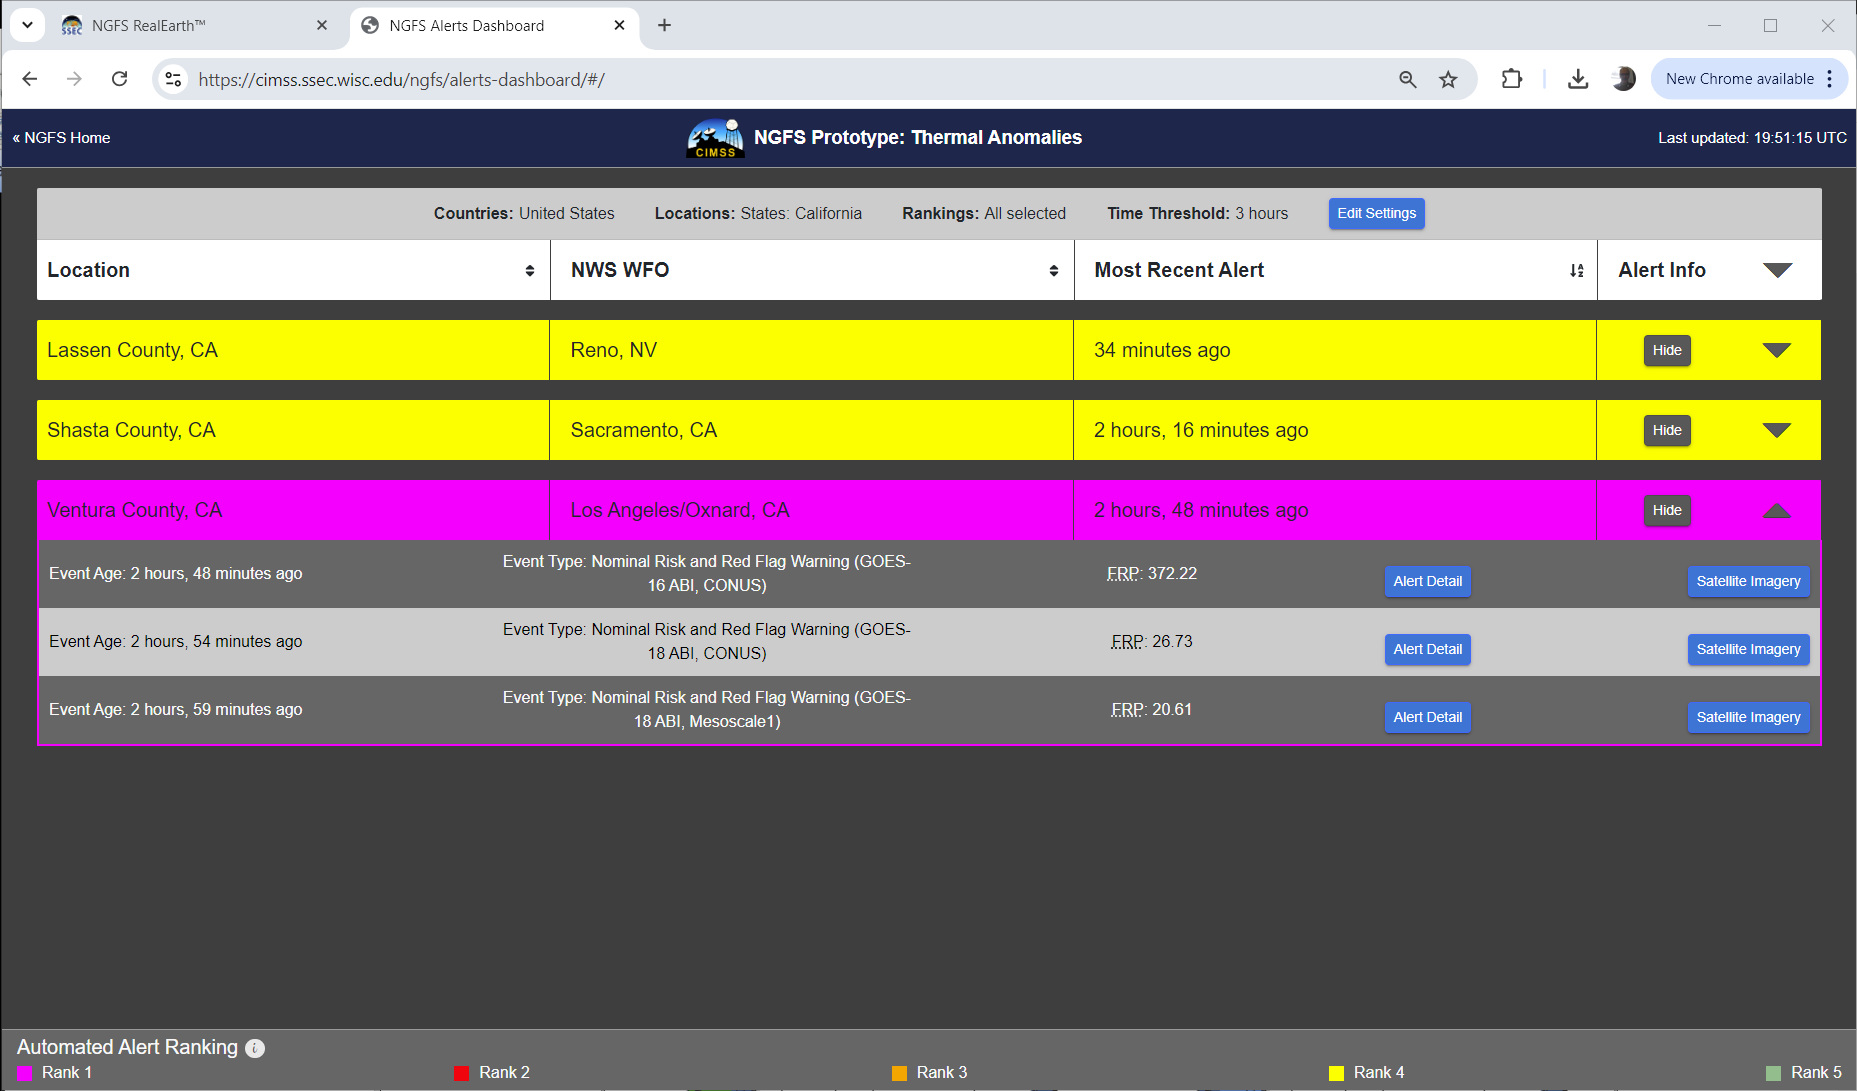
NGFS Thermal Anomaly Detection at the Alerts Dashboard using GOES-18 Mesoscale Sector 1 data, 1649-1704 UTC on 6 November 2024
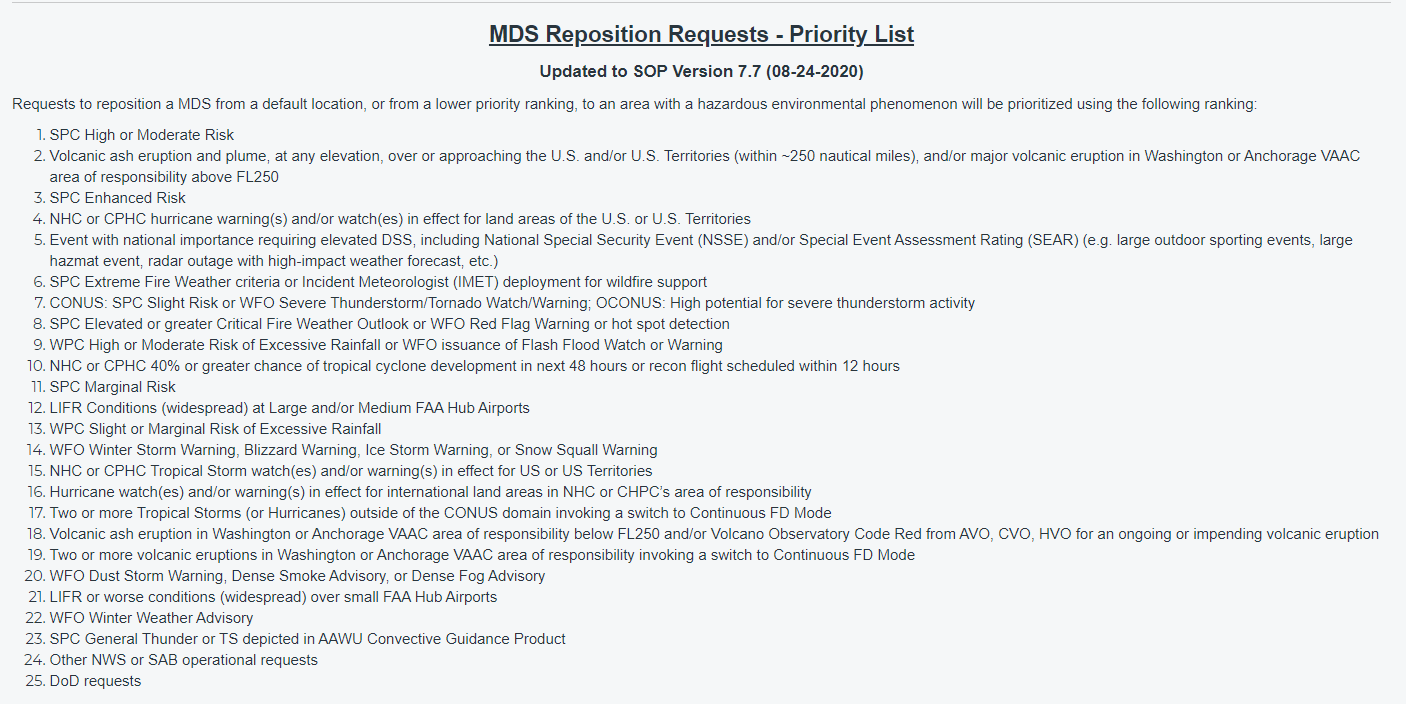
The Storm Prediction Center issued an Extreme Fire Weather Outlook (note that those conditions are #6 on the Priority List for Mesoscale Sectors!) for portions of southern California on 6 November 2024, and the forecast office in Los Angeles issued both High Wind Warnings — for strong Santa Ana winds — and a Red Flag Warning, as shown here, noting that this was a Particularly Dangerous Situation. The NGFS dashboard shown below includes the alert readout for this fire several hours after its initiation. The fire was detected by three different scannings: the GOES-16 CONUS scan, the GOES-18 PACUS scan, and the GOES-18 Mesoscale Sector 1 scan. Which scan strategy saw it first? It should be no surprise that the 1-minute cadence of the Mesoscale Sector first saw the fire. The first 15 minutes of the detections are shown above.
NGFS Alerts Dashboard for the Mountain Fire in Ventura County, Calfornia, 6 November 2024 (Click to enlarge)
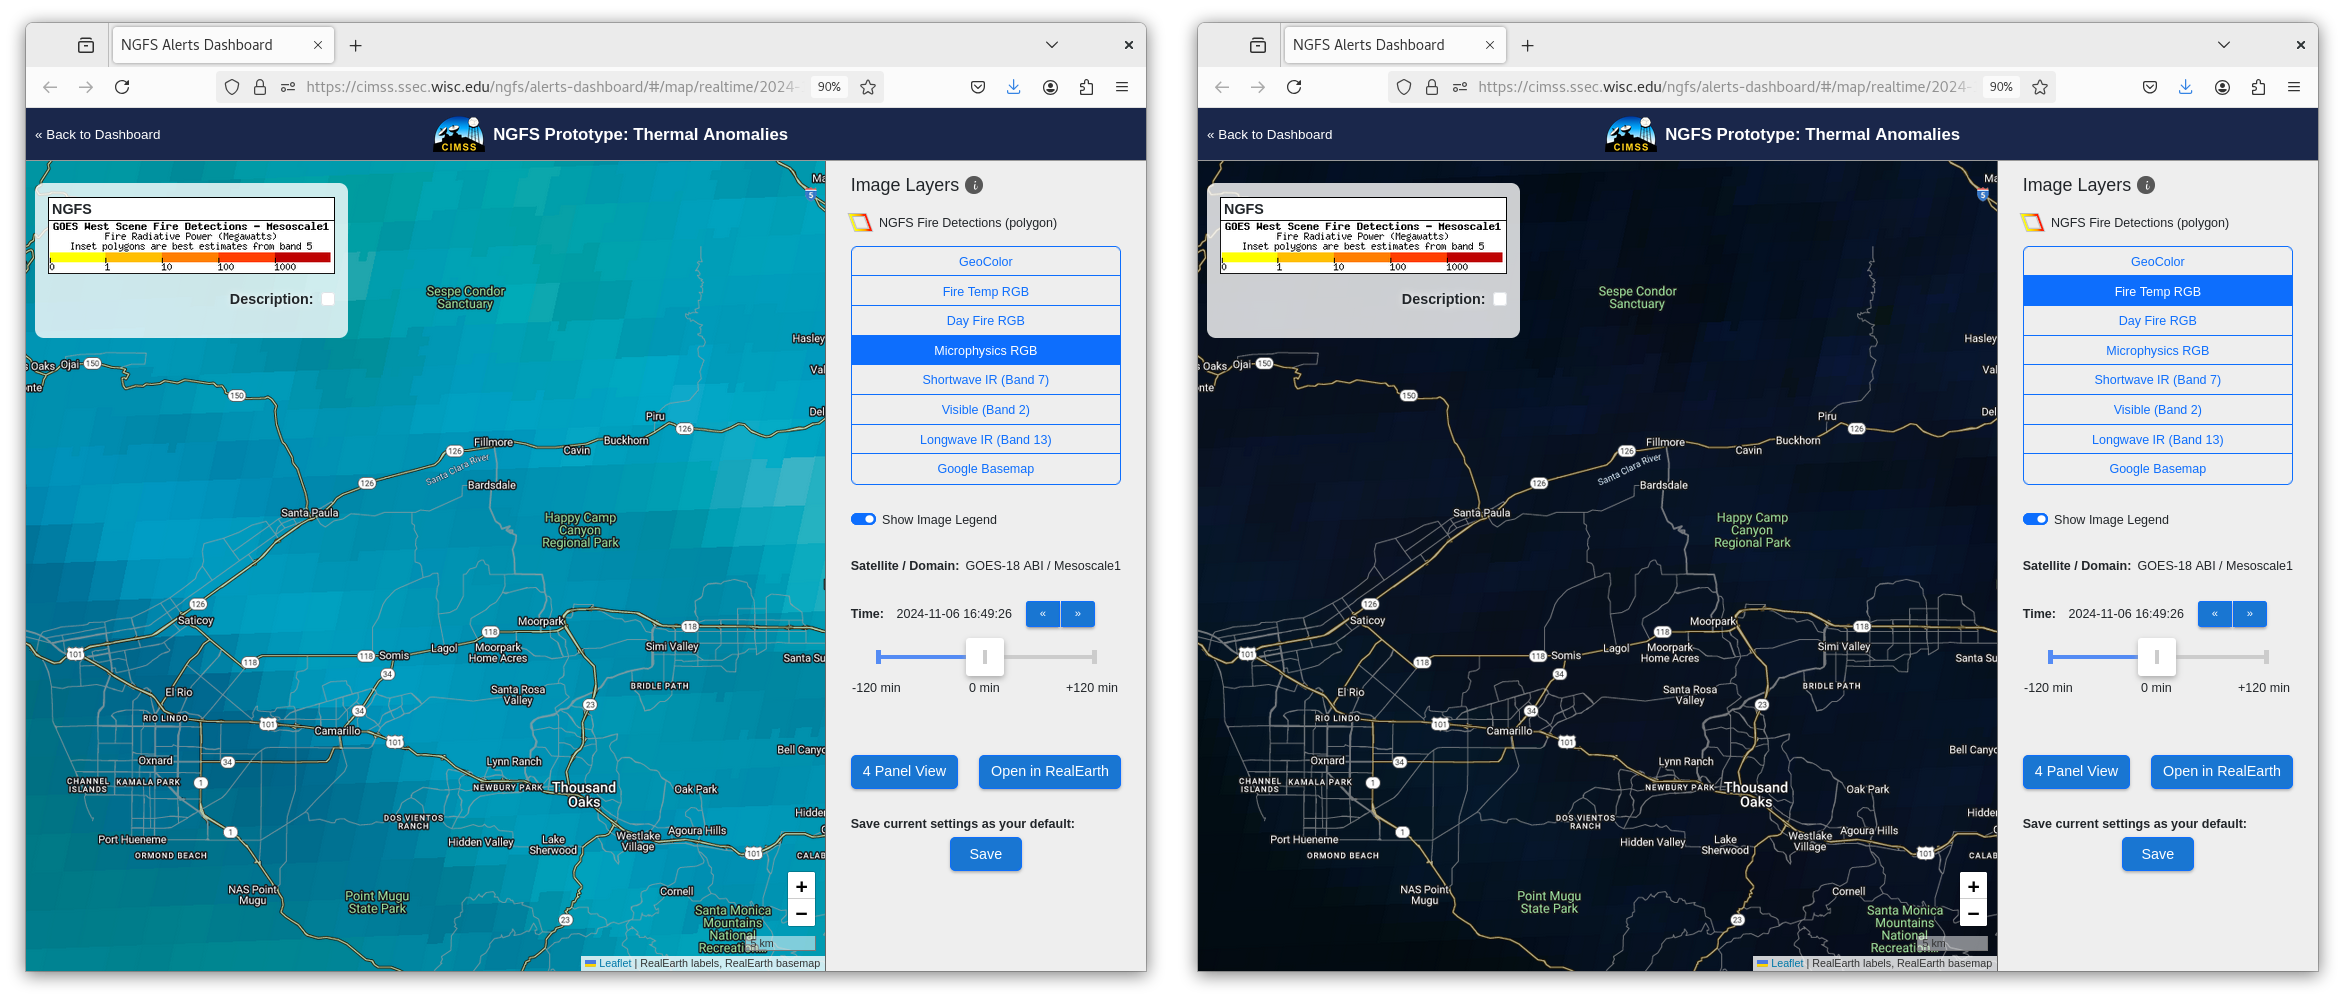
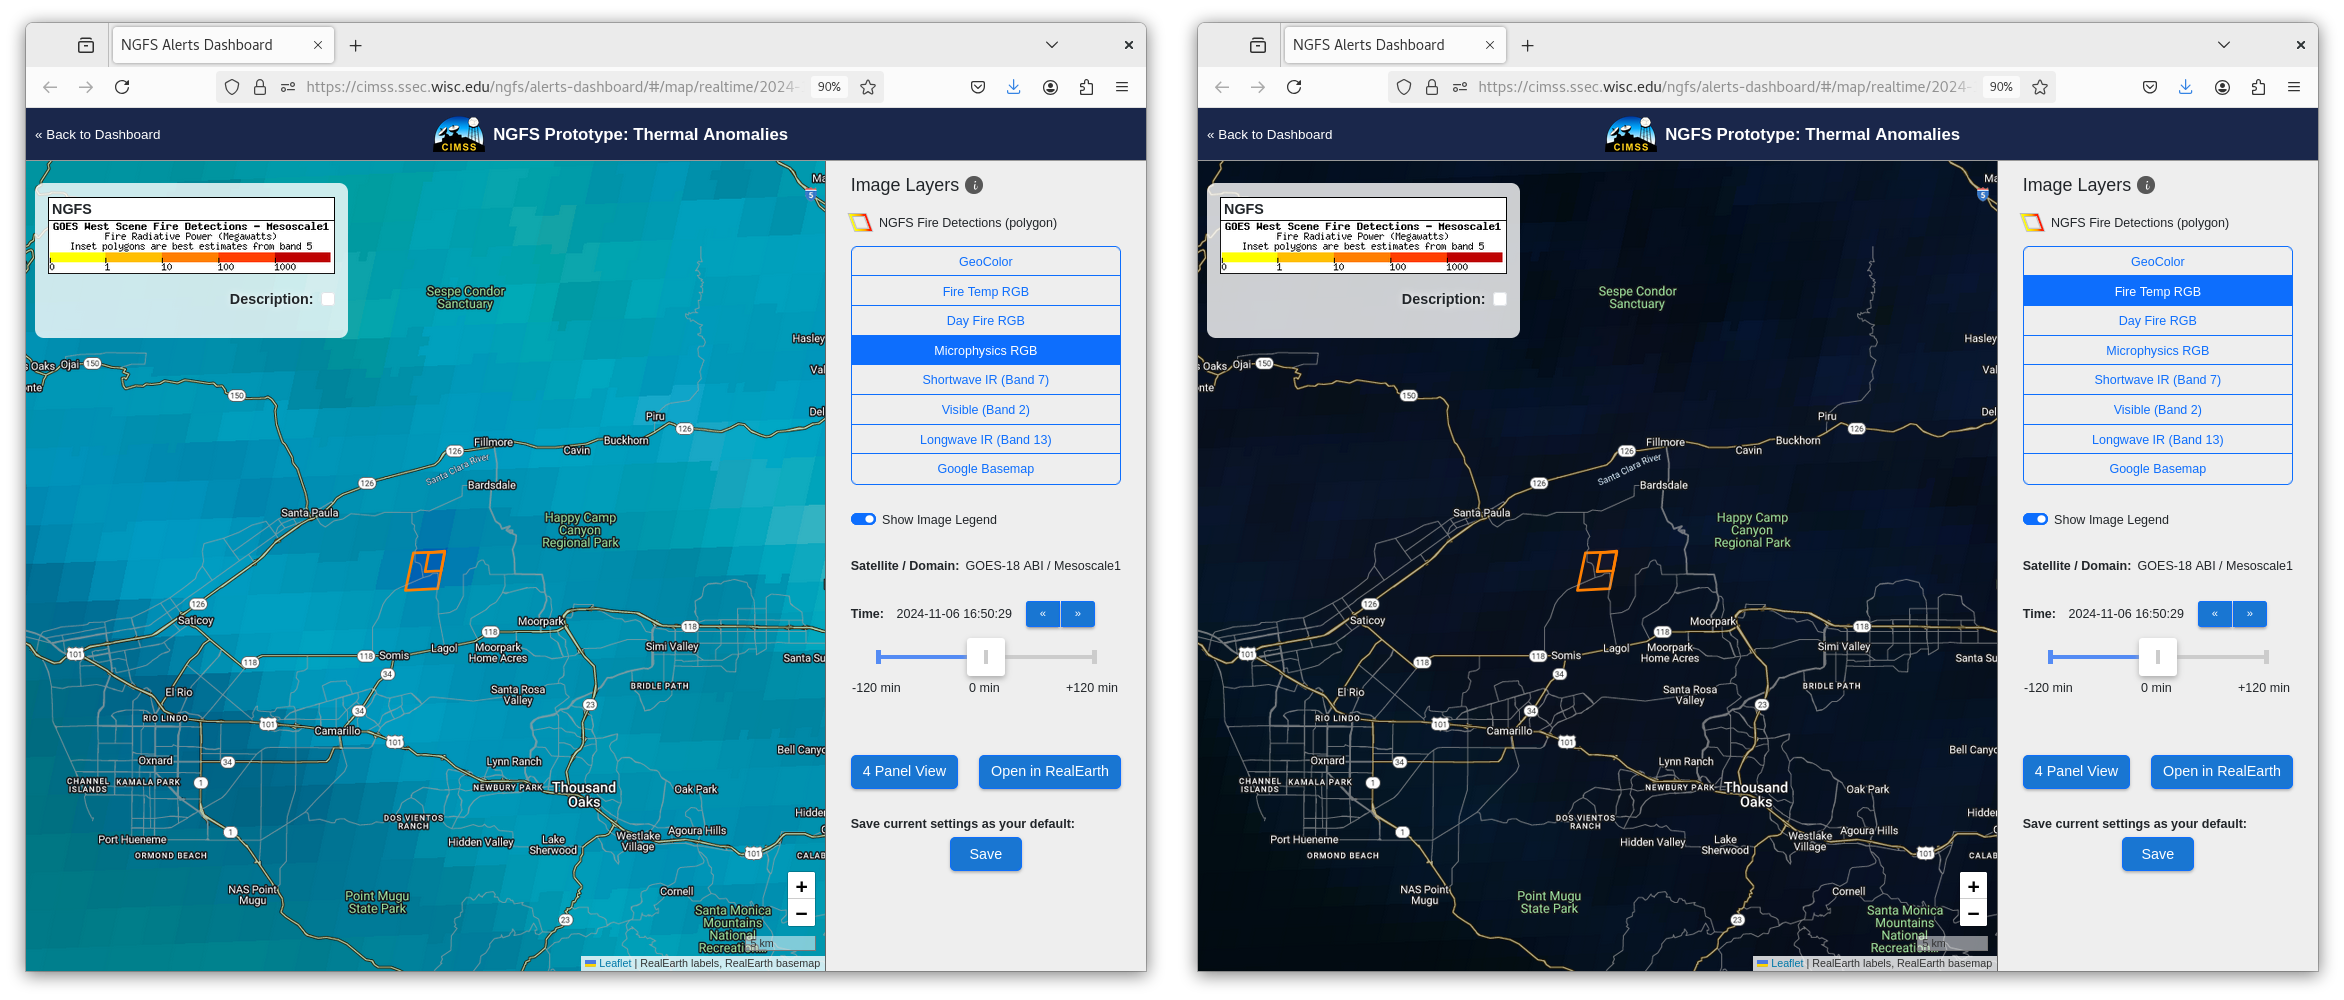
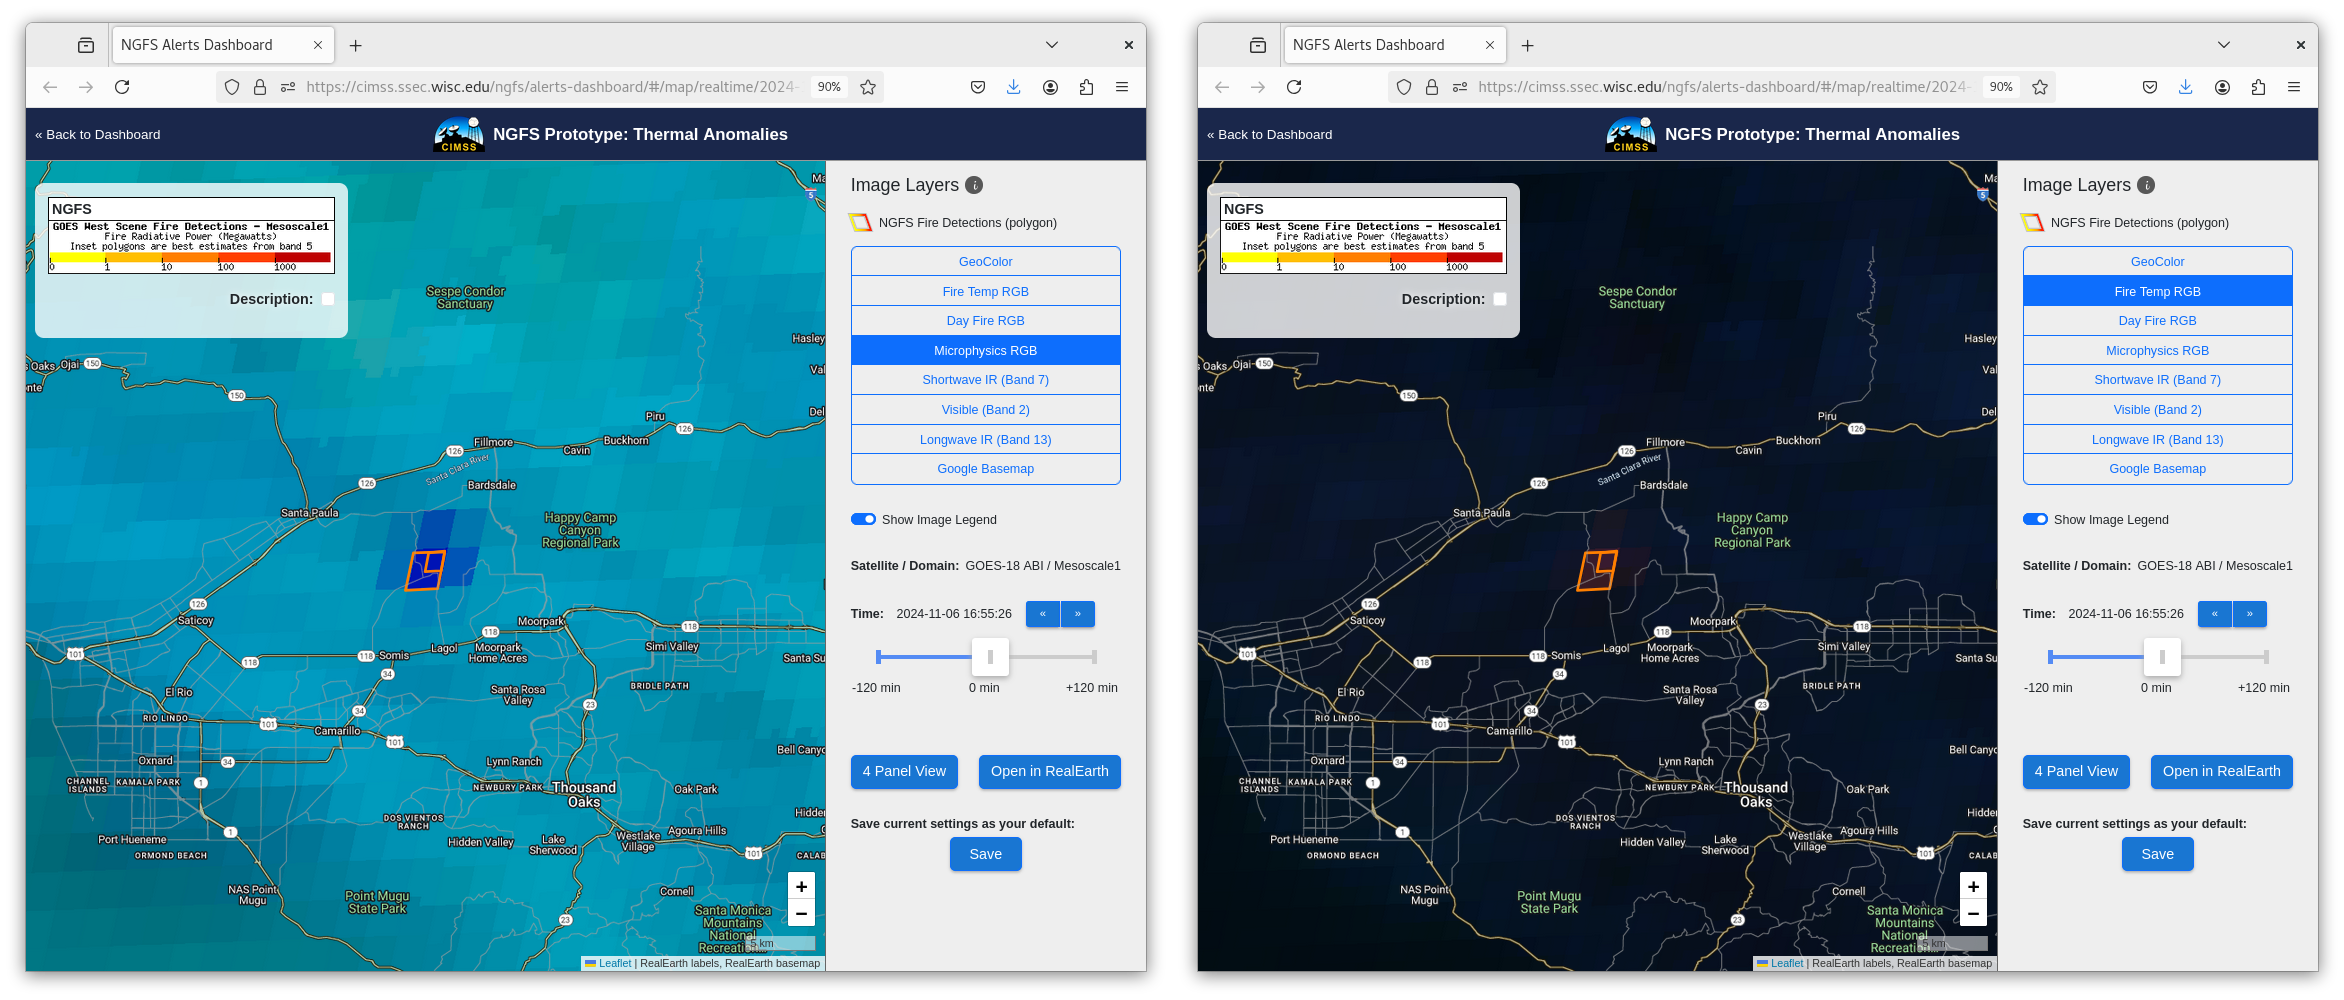
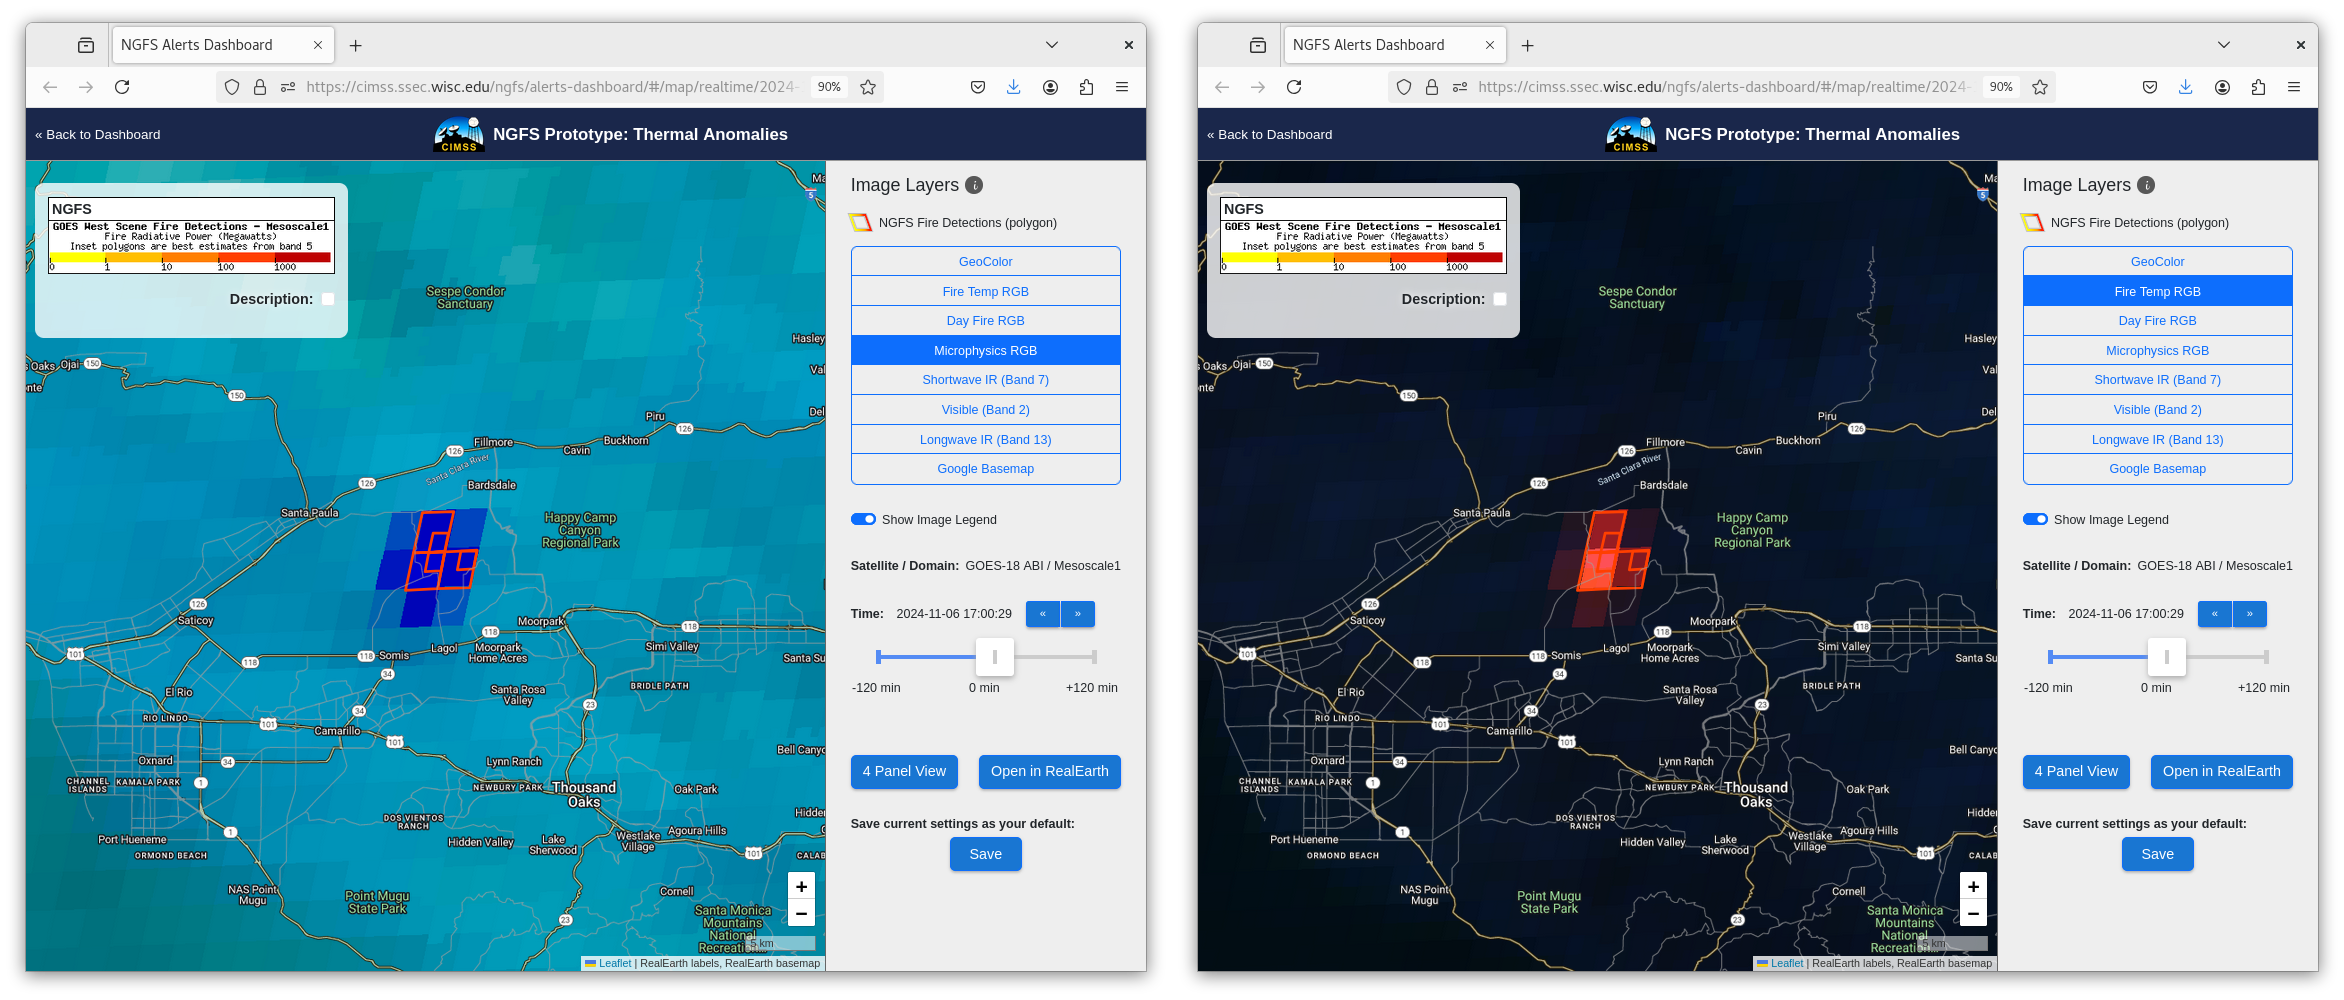
NGFS imagery below tracks the early development of the detections, at 1649, 1650, 1651, 1655 and 1700 UTC. NGFS Microphysics RGB is on the left, Fire Temperature RGB is on the right. The signal is initially apparent only in the NGFS Microphysics. It takes several minutes for a credible signal to appear in the Fire Temperature RGB — at 1655 UTC. These 5 images also show how mesoscale scanning (every minute) captures the rapid changes that occur.
NGFS Microphysics RGB (left) and Fire Temperature RGB (right), 1649 UTC on 6 November 2024 (Click to enlarge)NGFS Microphysics RGB (left) and Fire Temperature RGB (right), 1650 UTC on 6 November 2024; the detected fire pixels are highlighted (Click to enlarge)NGFS Microphysics RGB (left) and Fire Temperature RGB (right), 1651 UTC on 6 November 2024; the detected fire pixels are highlighted (Click to enlarge)NGFS Microphysics RGB (left) and Fire Temperature RGB (right), 1655 UTC on 6 November 2024; the detected fire pixels are highlighted (Click to enlarge)NGFS Microphysics RGB (left) and Fire Temperature RGB (right), 1700 UTC on 6 November 2024; the detected fire pixels are highlighted (Click to enlarge)
Three different GOES-R sectors were scanning this region; the GOES-18 Mesosector initially detected the fire at 1650 UTC. The toggle below shows the 5-minute scans from the GOES-16 CONUS sector (left) and the GOES-18 PACUS Sector at 1649, 1651 and 1656 UTC. The different colors in the NGFS Microphysics RGB imagery between the two satellites occur because of the different distances from the GOES-16 and GOES-18 sub-satellite points. A Fire pixel is detected by GOES-18 at 1651 UTC, one minute later than the mesosector detection above. A definitive pixel is not detected by GOES-16 until 1656 UTC. Make sure you are using the correct satellite and the correct scanning strategy (Call a meso!) if you are in a situation where every minute matters.
NGFS Microphysics RGB imagery at 1646, 1651 and 1656 UTC on 6 November 2024 from GOES-16 (left) and GOES-18 (right) (Click to enlarge)
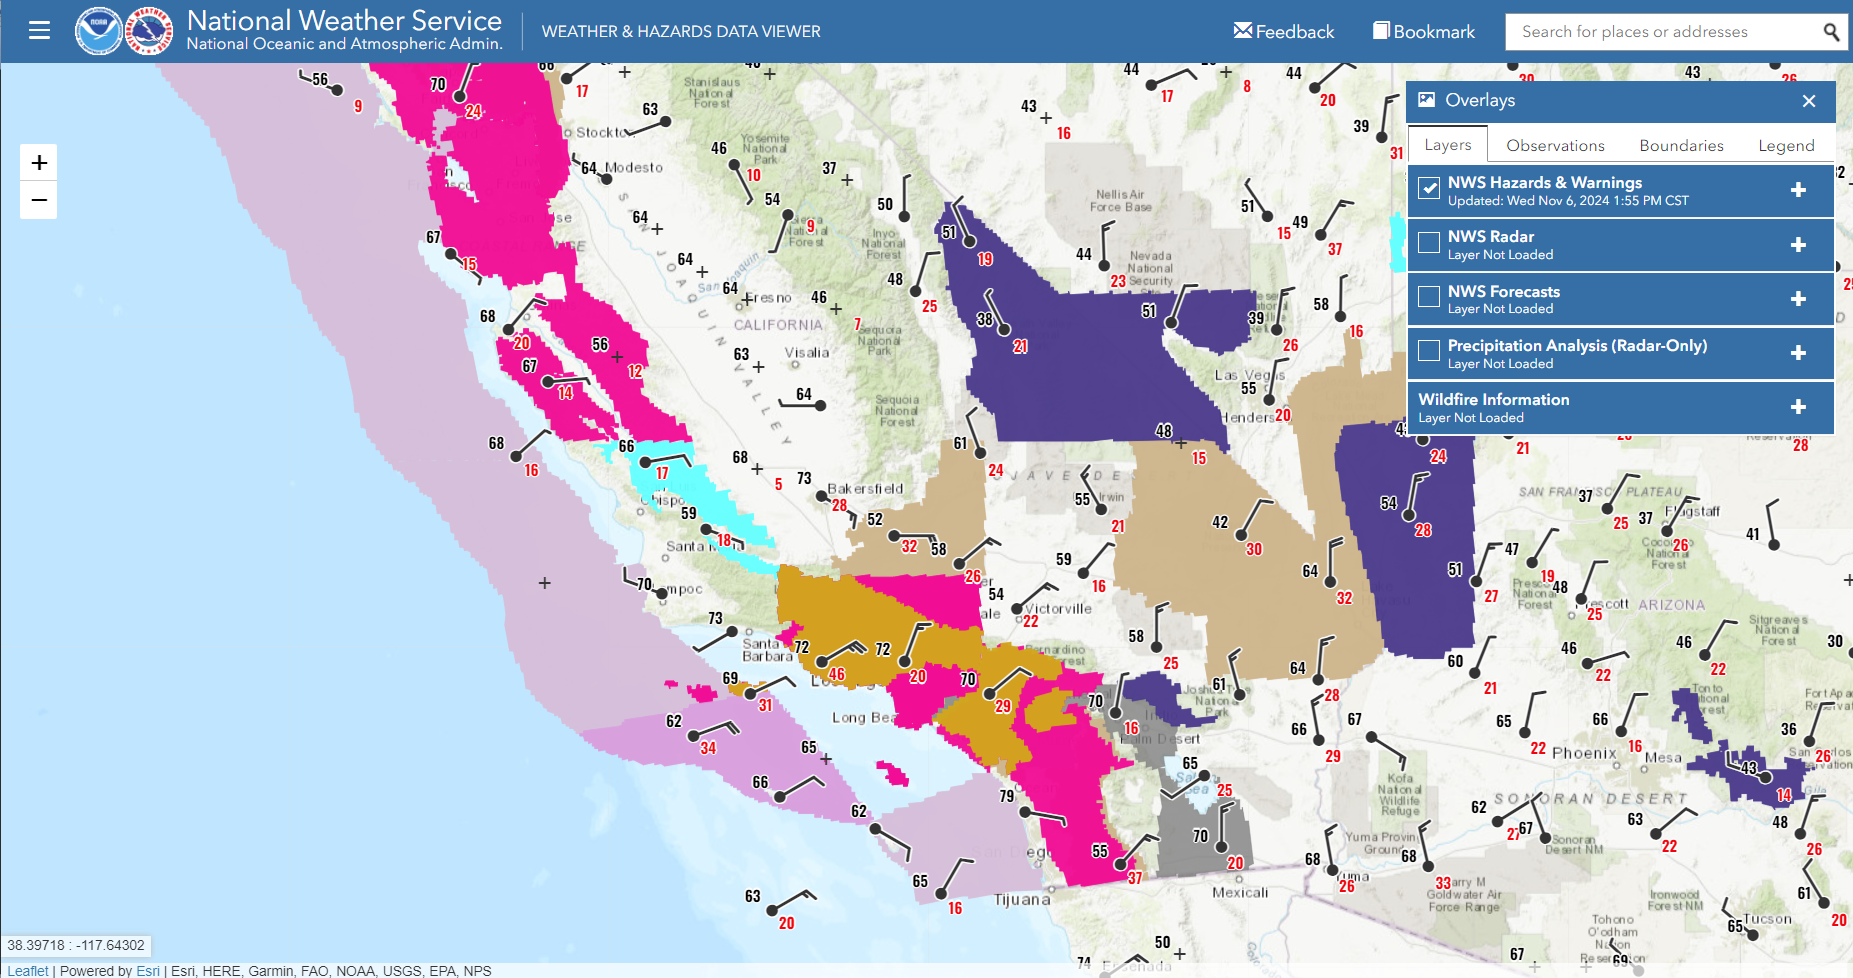
Santa Ana winds (surface analysis shown below) means that this fire grew quickly.
Surface plot with winds, gusts, and temperatures. Note the gusts in the 20-45 knot range near Los Angeles. NWS Hazards/Warnings are also indicated. Time of image: 1900 UTC on 6 November 2024 (Click to enlarge).
The toggle below compares the NGFS microphysics RGB and the Fire Temperature RGB at 1850 UTC, about 2 hours after the fire’s start. Significant growth in the fire area is apparent, and it has become very intense.
NGFS Microphysics RGB and Fire Temperature RGB with the Mountain Fire, 1850 UTC on 6 November 2024 (click to enlarge)
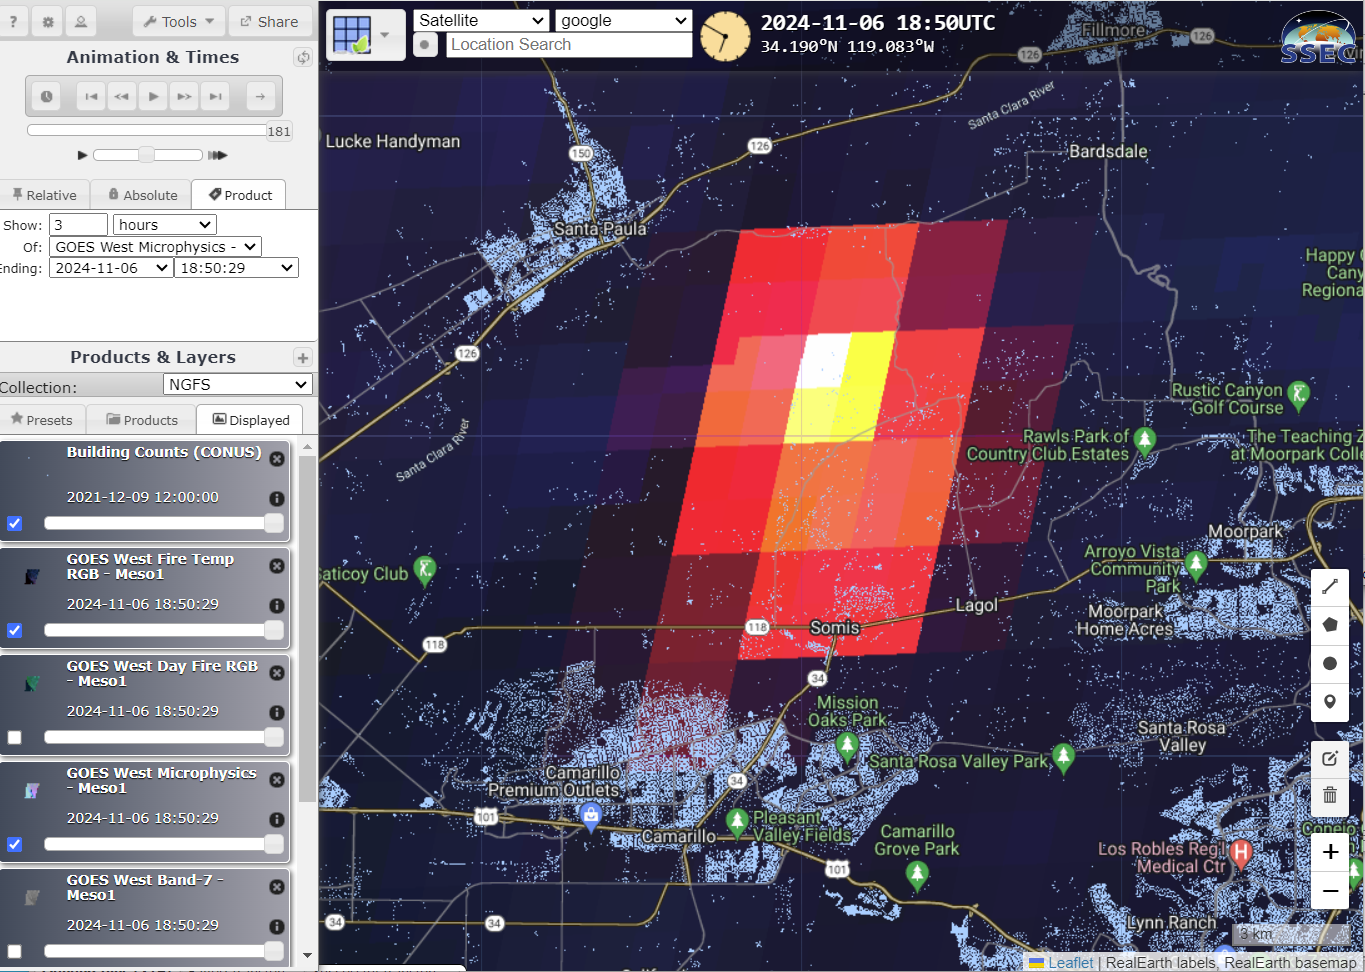
The RealEarth NGFS instance for the Mountain Fire allows a user to add other fields to the display in addition to satellite imagery and fire detections. GOES-18 Fire Temperature RGB with Building Counts is shown below. This active fire is just upwind of a significant amount of development!
RealEarth NGFS instance showing Fire Temperature RGB and Building Counts, 1850 UTC on 6 November 2024 (Click to enlarge)
The animation below from the CSPP Geosphere site shows the effect of the strong winds: the plume from this fire rapidly moves offshore. There is also a dust plume in the southern part of the the animation, also suggestive of strong winds. Indeed, the winds are strong enough to ground fixed-wing aircraft that might otherwise be used to fight this fire!
True Color Imagery over southern California, 1511-1916 UTC on 6 November 2024
The animation for the same time of shortwave infrared data, below, shows the rapid development and expansion of the hotspot.
GOES-16 Shortwave IR (Band 7, 3.9 µm) imagery, 1511-1916 UTC on 6 November 2024.
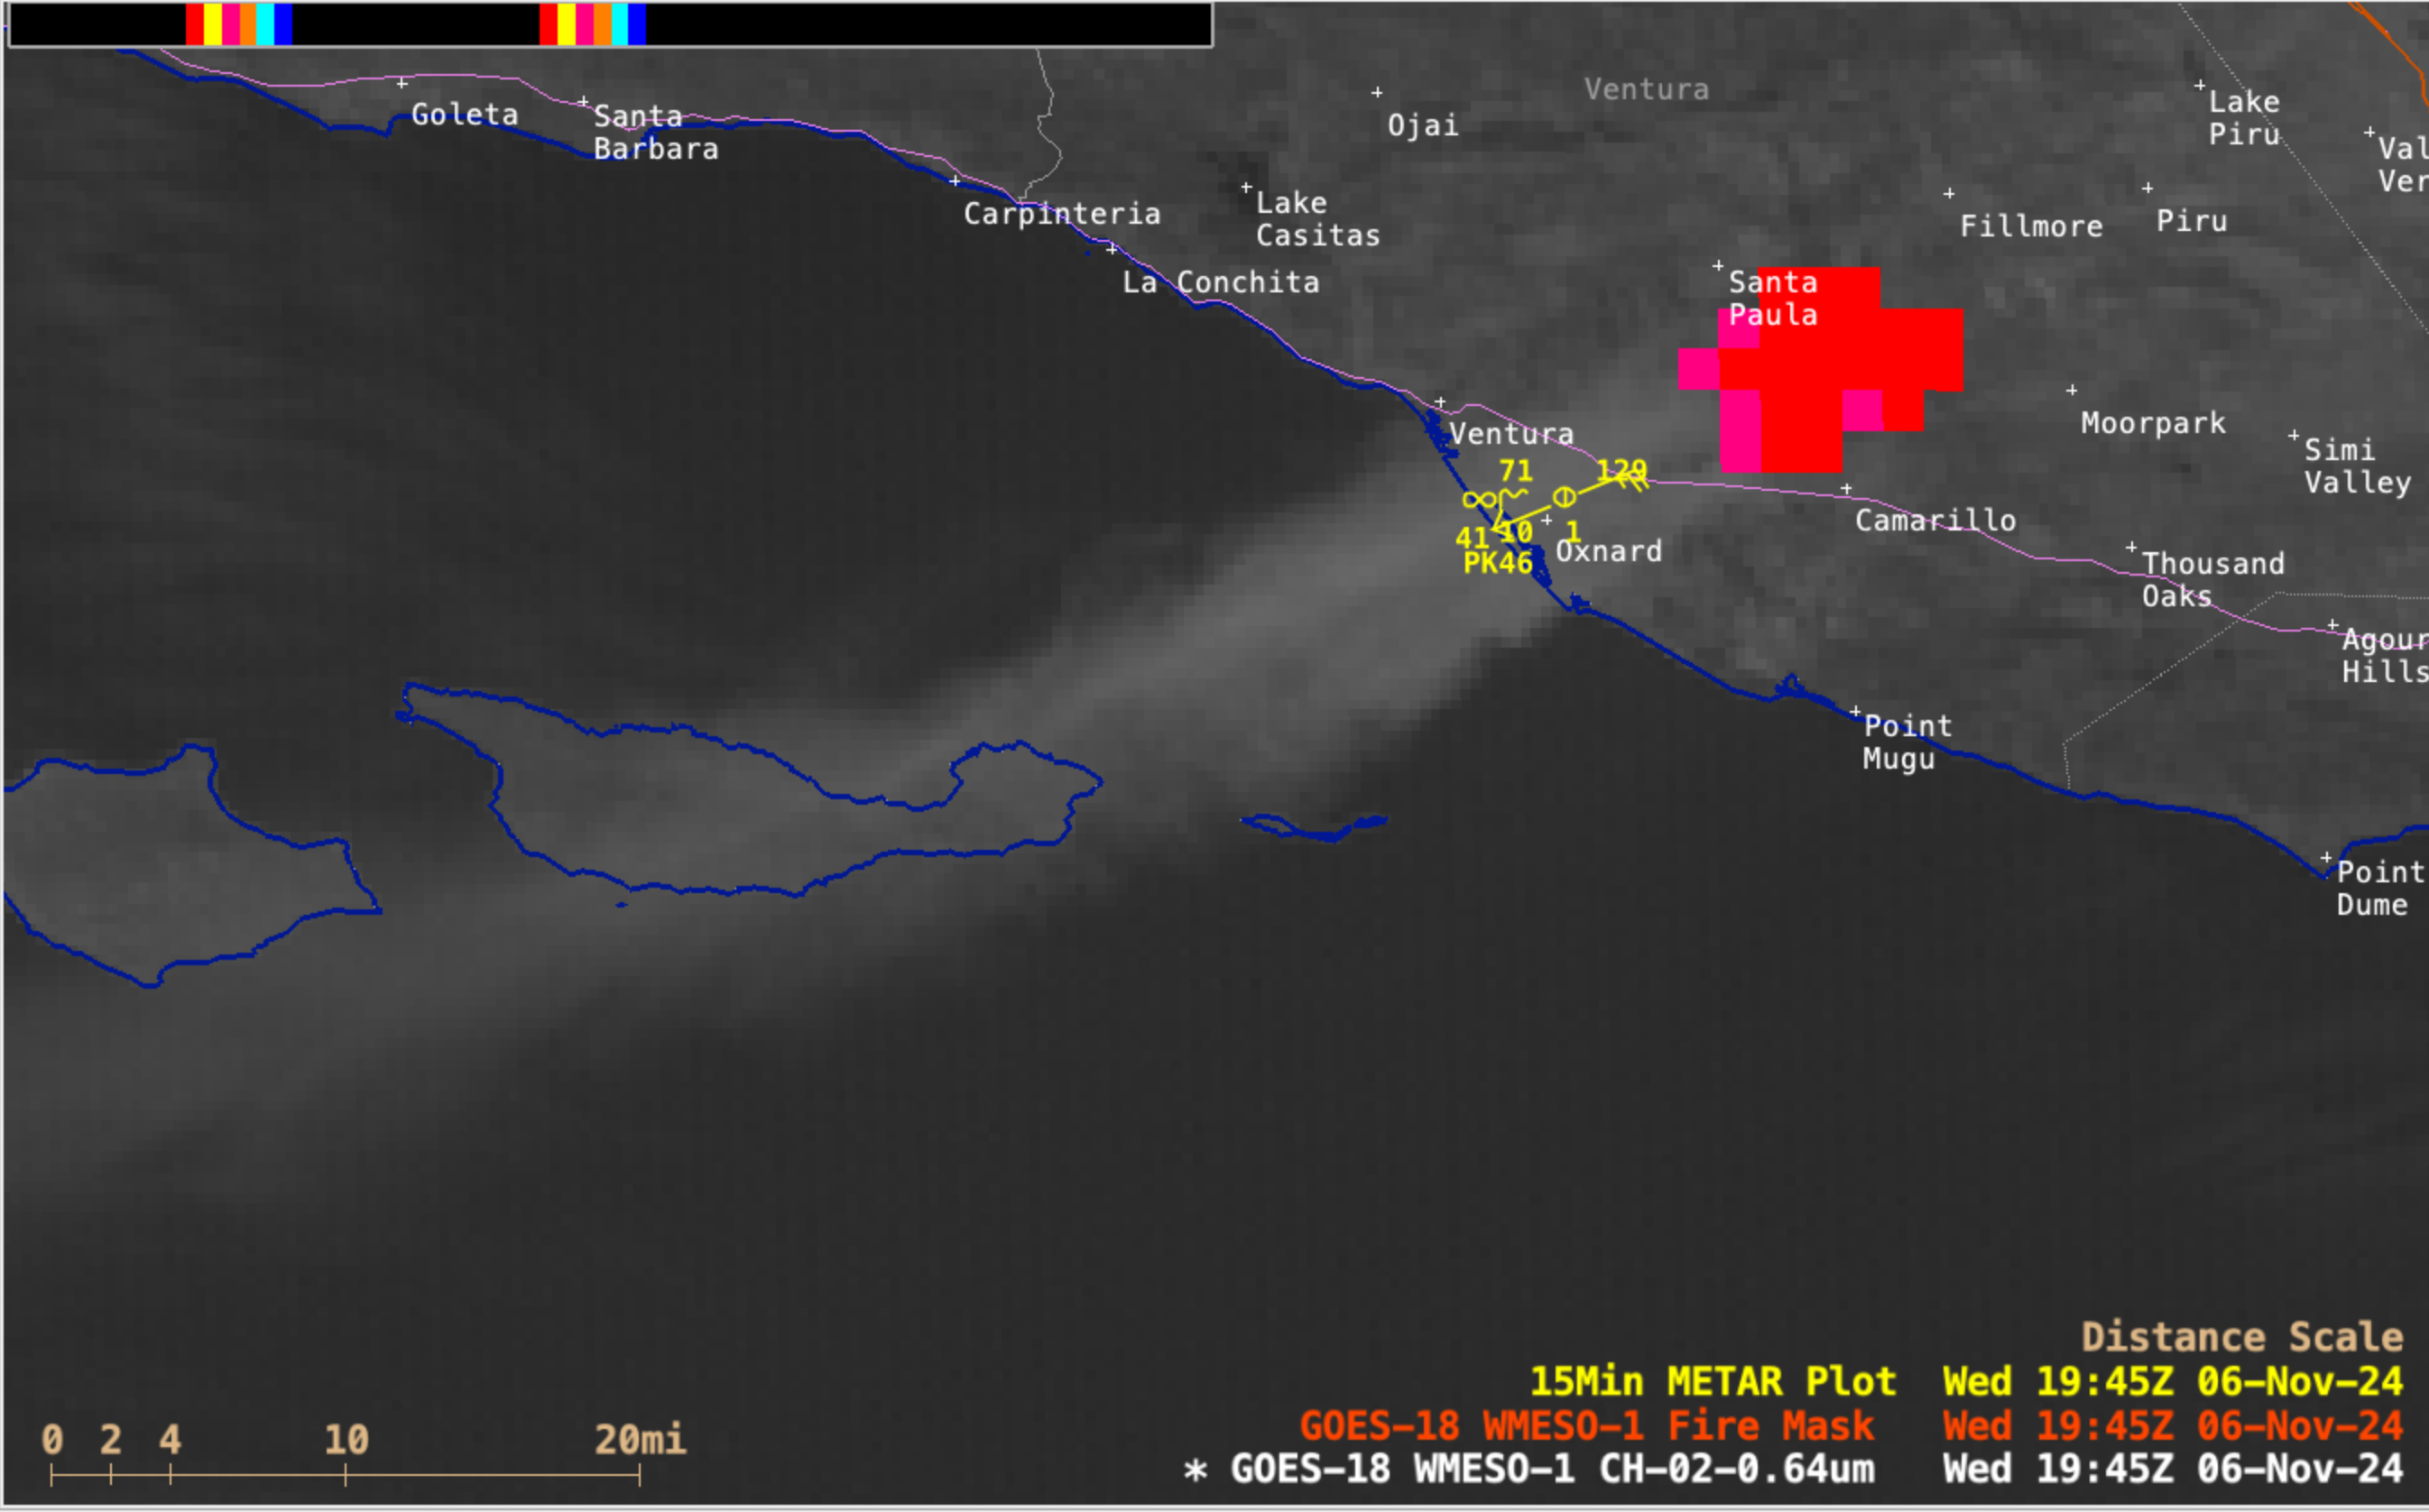
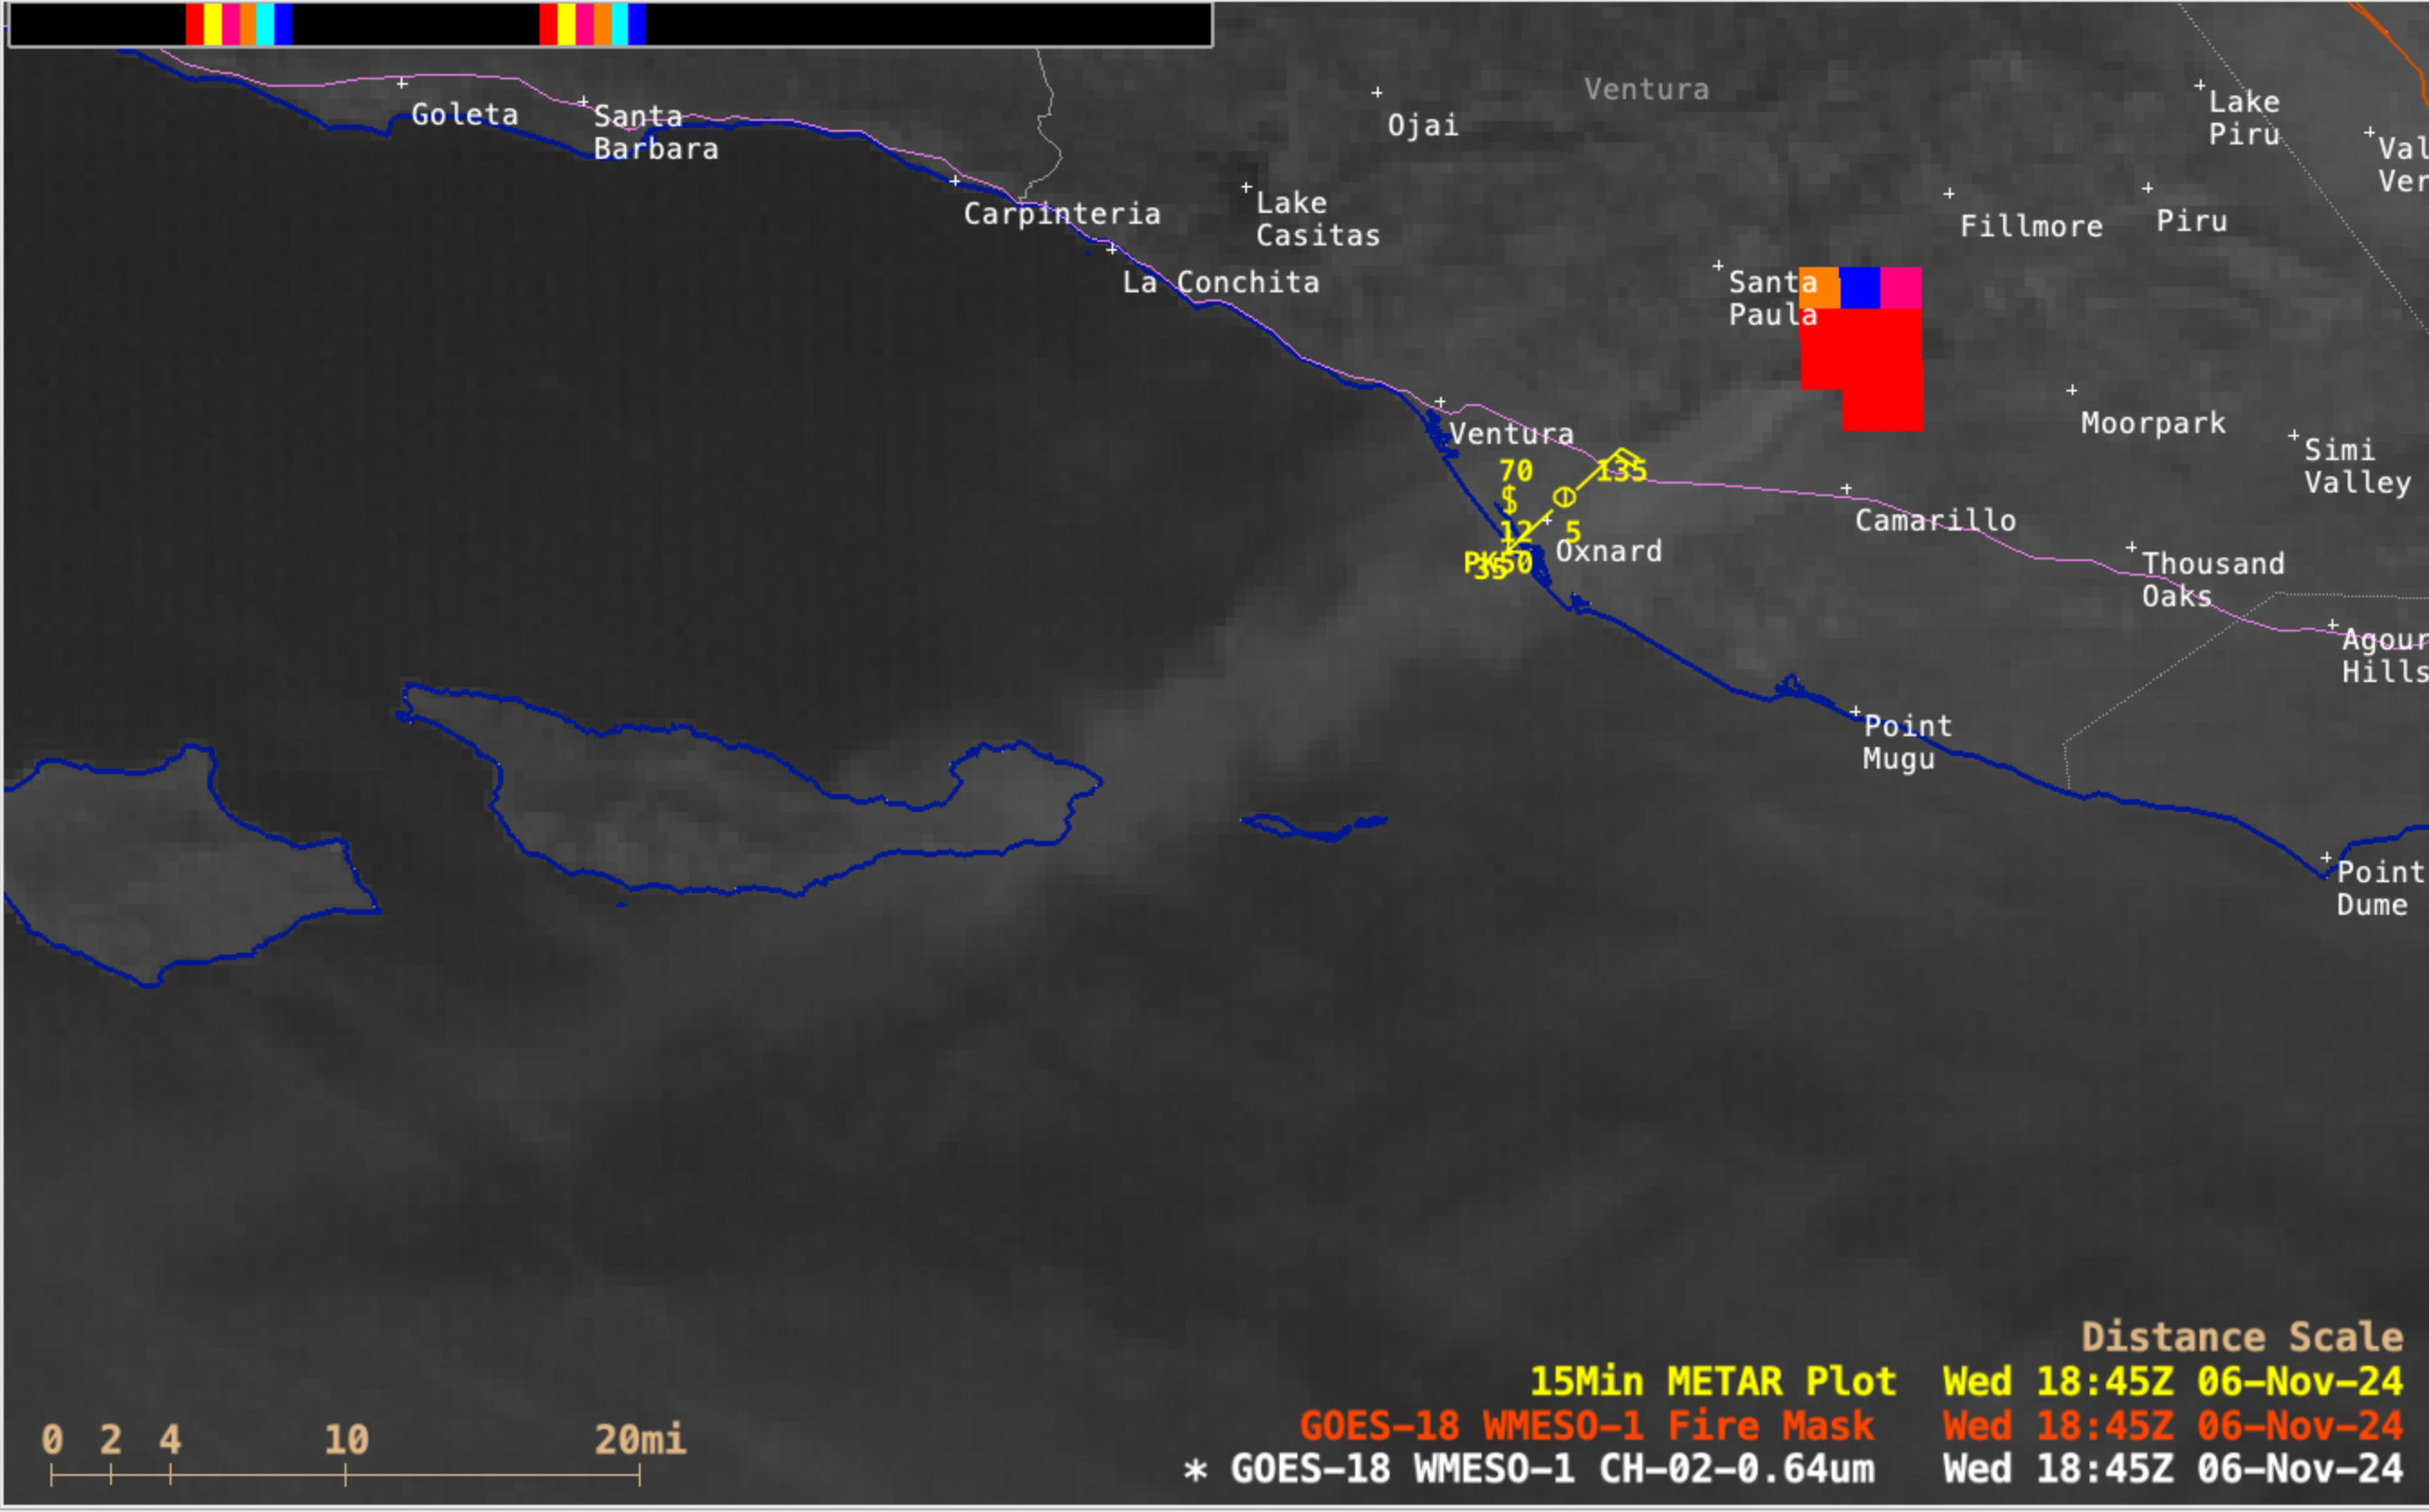
1-minute GOES-18 Red Visible (0.64 µm) images with an overlay of the Fire Mask derived product and plots of 15-minute METAR surface reports, from 1631-2200 UTC on 6 November; Highway 101 is plotted in magenta (courtesy Scott Bachmeier, CIMSS) [click to play MP4 animation]
1-minute GOES-18 Visible images with an overlay of the Fire Mask derived product (above) displayed the rapid increase in areal coverage and spread of the Mountain Fire’s thermal signature — the initial Fire Mask detection occurred at 1653 UTC. At 1945 UTC, the dense smoke plume reduced surface visibility to 1 mile at Oxnard; this smoke plume continued to drift across parts of the offshore Channel Islands National Park throughout the day. During that time period, peak wind gusts were 56 knots (64 mph) at Camarillo Airport, 55 knots (63 mph) at Point Mugu Naval Air Station and 50 knots (57 mph) at Oxnard (when blowing dust was being reported). The thermal signature indicated that the head of the wildfire quickly approached the Camarillo area and Highway 101.
30-second GOES-19 (*Preliminary/Non-operational*) Shortwave Infrared images (below) also showed the rapid southwestward run of the Mountain Fire toward Camarillo (KCMA) and Highway 101, driven by the strong northeast Santa Ana winds. (Thanks to Bill Line, NOAA/NESDIS for requesting the overlapping GOES-19 Mesoscale Sectors!)
30-second GOES-19 (Preliminary/Non-operational) Shortwave Infrared (3.9 µm) images, from 1701-2200 UTC on 6 November; Highway 101 is plotted in magenta (courtesy Scott Bachmeier, CIMSS) [click to play animated GIF | MP4]
CIMSS True-Color Imagery, below (courtesy Tim Schmit, NOAA/STAR) also from GOES-19 and at a 30-second cadence (and also Preliminary and Non-Operational), as above, shows the development of the smoke plume during the day on the 6th, and shows the dust plume to the south.
GOES-19 CIMSS True-Color Imagery, 1702 UTC 6 November — 0037 UTC 7 November 2024
Tim Schmit also supplied (Preliminary, Non-Operational) 30-second GOES-19 True Color Imagery shown below.
GOES-19 True-Color Imagery, 1702 UTC 6 November — 0037 UTC 7 November 2024
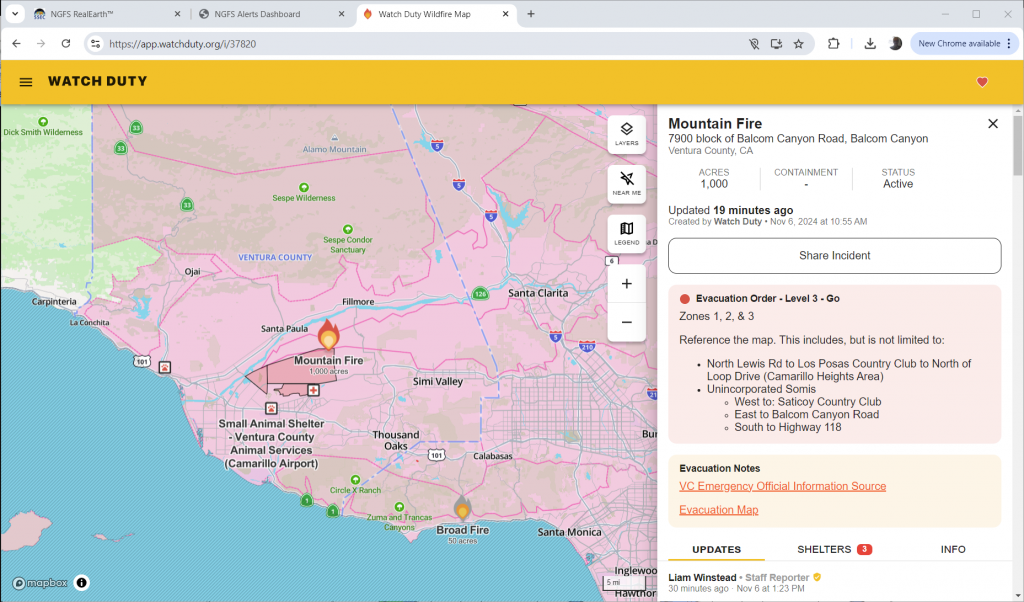
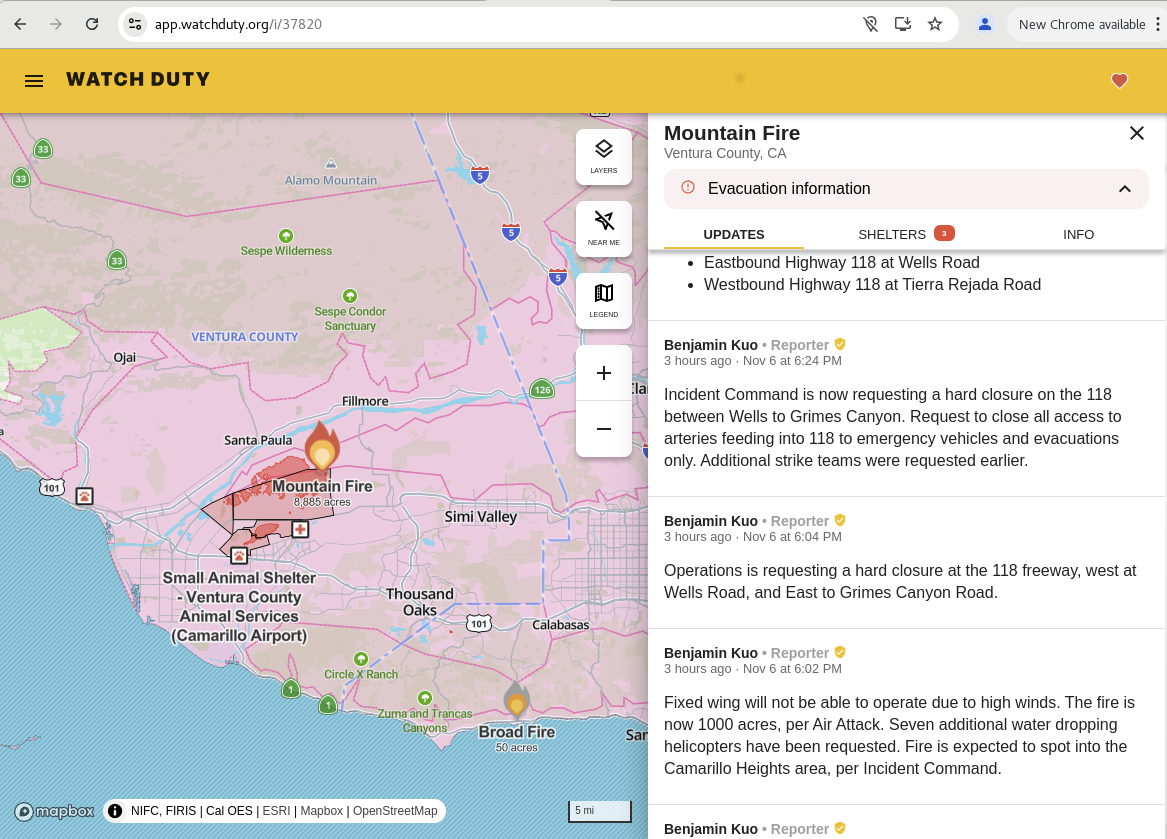
More information on this fire is available at the Watch Duty website, shown below. Active evacuations are occurring as of 2100 UTC on 6 November 2024. The first entry for this fire is at 1655 UTC — “Possible vegetation fire reported at Balcom Canyon, with smoke visible on Alert California cameras.”
Screen Capture of the Watch Duty website for the Mountain Fare (Click to enlarge)
Webcam imagery of this fire is available here. A Satellite Liaison Blog Post by Bill Line on this event is here.


