Arctic low north of Alaska, and its effect on ice in the Beaufort Sea
Suomi-NPP VIIRS Visible (0.64 µm) images, from 2333 UTC on 13 April to 2132 UTC on 14 April [click to play animated GIF | MP4]
NOAA-20 and NOAA-21 Infrared images with plots of blended Atmospheric Motion Vectors derived from both satellites, from 2229 UTC on 13 April to 1936 UTC on 14 April (credit: Rich Dworak, CIMSS) [click to play animated GIF | MP4]
Plot of surface report data from Utqiagvik (Barrow) [click to enlarge]
Suomi-NPP VIIRS Visible (0.64 µm) images, from 1459 UTC to 2132 UTC on 14 April [click to play animated GIF | MP4]
Suomi-NPP VIIRS Sea Ice Thickness and Sea Ice Temperature derived products at 0000 UTC on 15 April [click to enlarge]
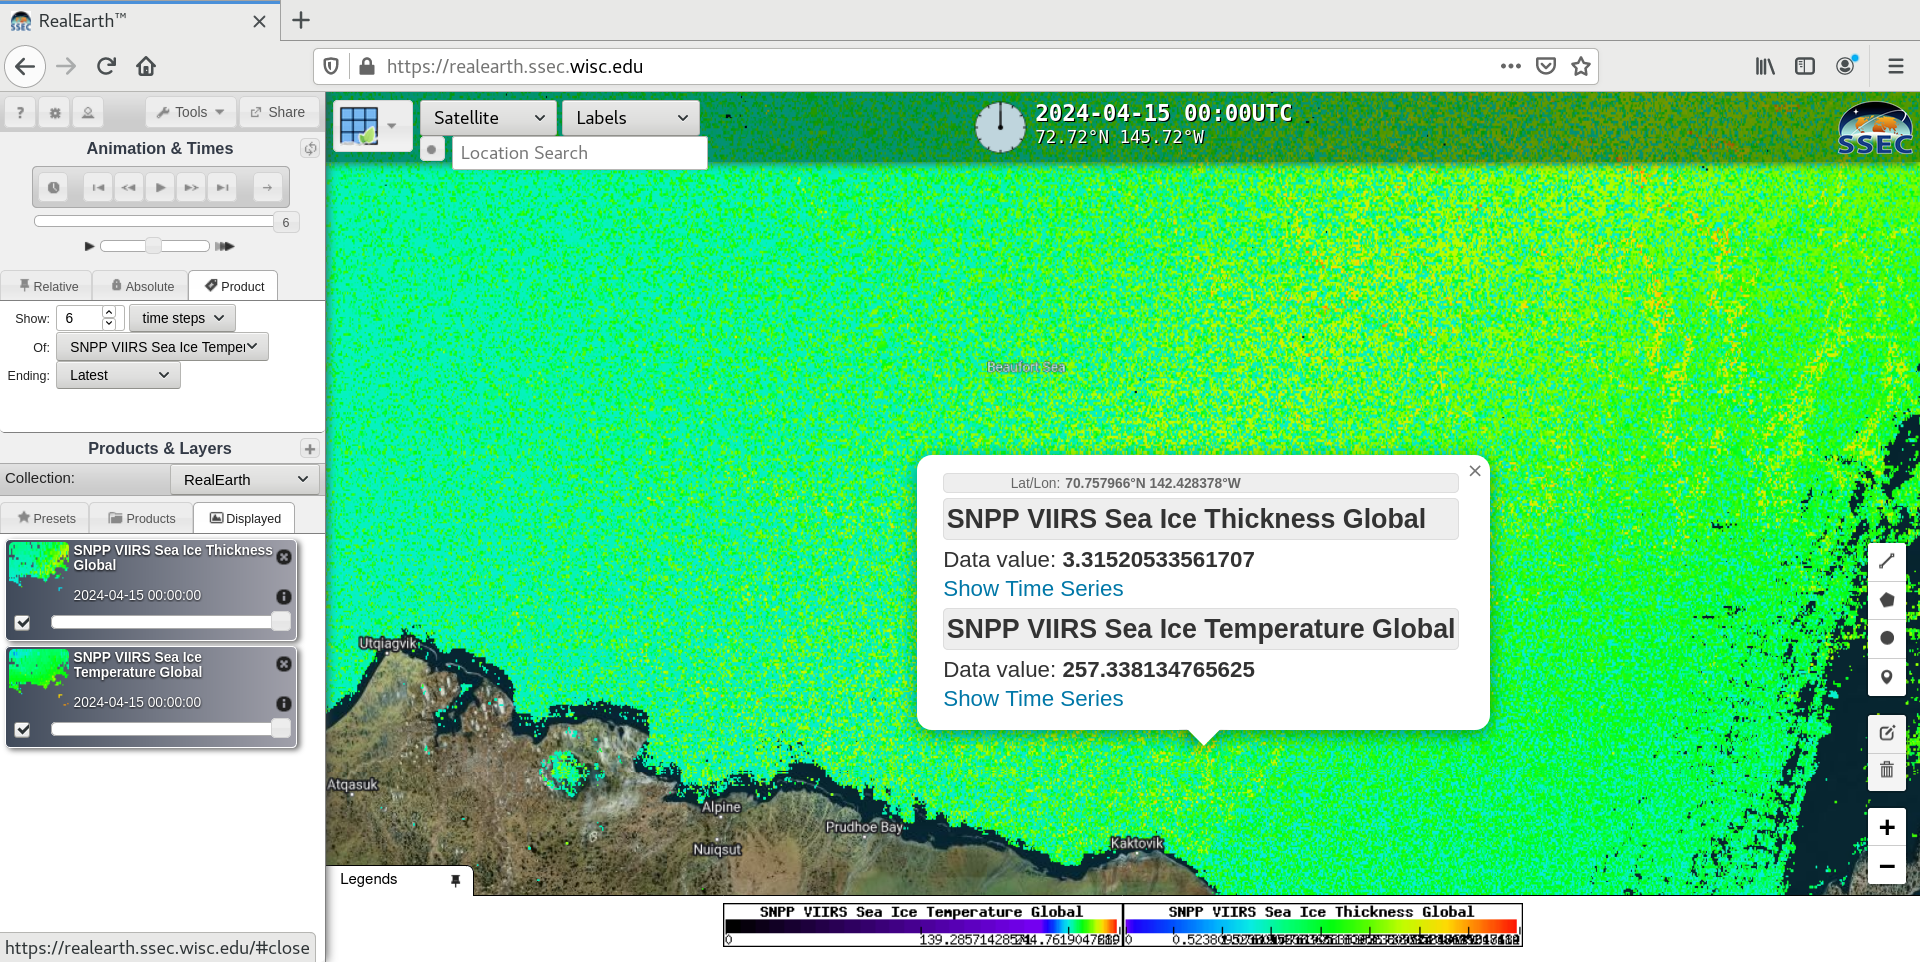
Probed values of Suomi-NPP VIIRS Sea Ice Thickness and Sea Ice Temperature derived products at 0000 UTC on 15 April [click to enlarge]
Daily composite images of the Sea Ice Temperature, Sea Ice Thickness and Sea Ice Age derived products from NOAA-20, NOAA-21 and Suomi-NPP on 14 April [click to play animated GIF | MP4]