
NOAA-18 AVHRR 10.8 µm IR image
October 2008 turned out to be the 4th coldest October on record at Fairbanks, Alaska. About 150 miles (240 km) to the north of Fairbanks, a minimum surface temperature of -40º F (-40º C) was reported at Chandalar Lake, Alaska on 25 October, followed by a low of -42º F (-41º C) on 26 October 2008:
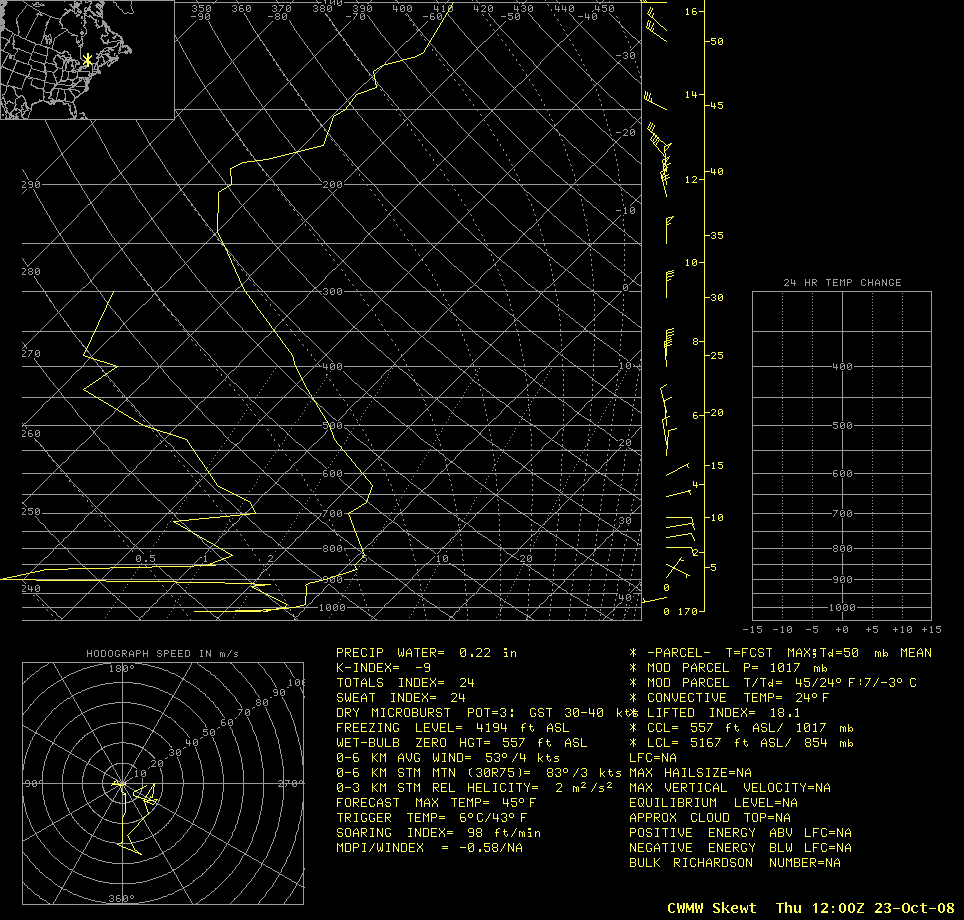
PUBLIC INFORMATION STATEMENT
NATIONAL WEATHER SERVICE FAIRBANKS AK
1124 AM AKDT SUN OCT 26 2008…VERY COLD TEMPERATURES OVERNIGHT IN THE NORTH EASTERN INTERIOR…
FOR THE SECOND NIGHT IN A ROW CHANDALAR LAKES OVERNIGHT TEMPERATURE WAS BELOW 40 DEGREES BELOW ZERO.
SATELLITE IMAGERY THIS MORNING INDICATED THAT SOME VALLEYS IN THE NORTH EASTERN BROOKS RANGE WERE APPROACHING 50 BELOW ZERO OVERNIGHT…BUT WITH NO OBSERVERS IN THE AREA WE HAVE NO OFFICIAL TEMPERATURE REPORTS FROM THERE.
THE PLACES THAT WERE 20 BELOW ZERO OR COLDER:
CHANDALAR LAKE…………………….-42
NORUTAK LAKE………………………..-30
BEAVER…………………………………..-29
COLDFOOT……………………………..-26
CHALKYITSIK……………………………-25
BETTLES AIRPORT……………………..-20
NOAA-18 AVHRR 10.8 µm IR imagery (above) showed numerous narrow fingers of very cold air draining into the valleys of the Brooks Range in northern and northeastern Alaska — many valleys exhibited IR brightness temperatures as cold as -40º C (darker blue color enhancement).
A magnified version of that same NOAA-18 AVHRR 10.8 µm IR image (below) revealed that some of the valleys located to the northeast of Chandalar Lake (station identifier PALR) were even colder, with IR brightness temperatures as low as -45º C or -49º F (violet color enhancement) — however, Eric Stevens (Science and Operations Officer at the Fairbanks AK NWS forecast office) informed us that the ASOS instruments at Arctic Village (station identifier PARC) were out of service at that time, so no surface temperature data was available to verify the cold values seen on satellite IR data. The coldest IR brightness temperature in the immediate PALR region was -44º C (-47º F) at 12:38 UTC — a surface air temperature of of -39º C (-38º F) was reported at PALR about 2 hours after the time of the NOAA-18 IR image.

NOAA-18 AVHRR 10.8 µm IR image
While the corresponding GOES-11 10.7 µm IR images (below) did show a similar area of cold IR brightness temperatures near -40º C (darker blue color enhancement) from Chandalar Lake (PALR) to Arctic Center (PARC), the fine detail of the cold air drainage into the valleys was lost (the effective resolution of the “4 km” GOES IR pixels increase in size to about about 20 km over northern Alaska, due to the large satellite viewing angle). The coldest IR brightness temperatures seen on GOES data in that region at 12:30 UTC was -39º C (-38º F), compared to -45º C (-49º F) indicated by the AVHRR data at 12:38 UTC.

GOES-11 10.7 µm IR images
According to the USA Today tabulation of daily national temperature extremes, this is the earliest -40º F temperature reported in the US during the 1995-2008 period (the earliest -40º date was 05 November in 1999, with the latest -40º date being 31 December in 2002). While this was also the earliest recorded -40º temperature for Chandalar Lake, it did not threaten the monthly October record low temperature for the state of Alaska (which was -48º F or -44º C at Clear Water, set in 1975).
View only this post Read Less


