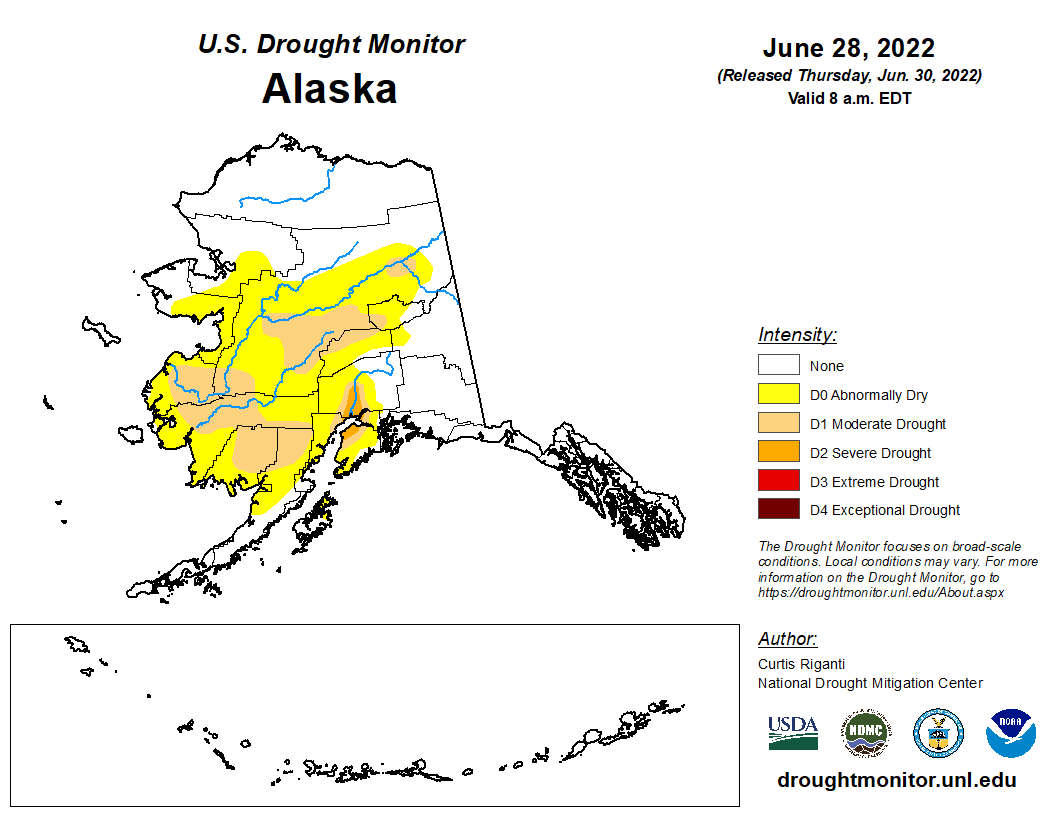
Wildfire smoke across Alaska
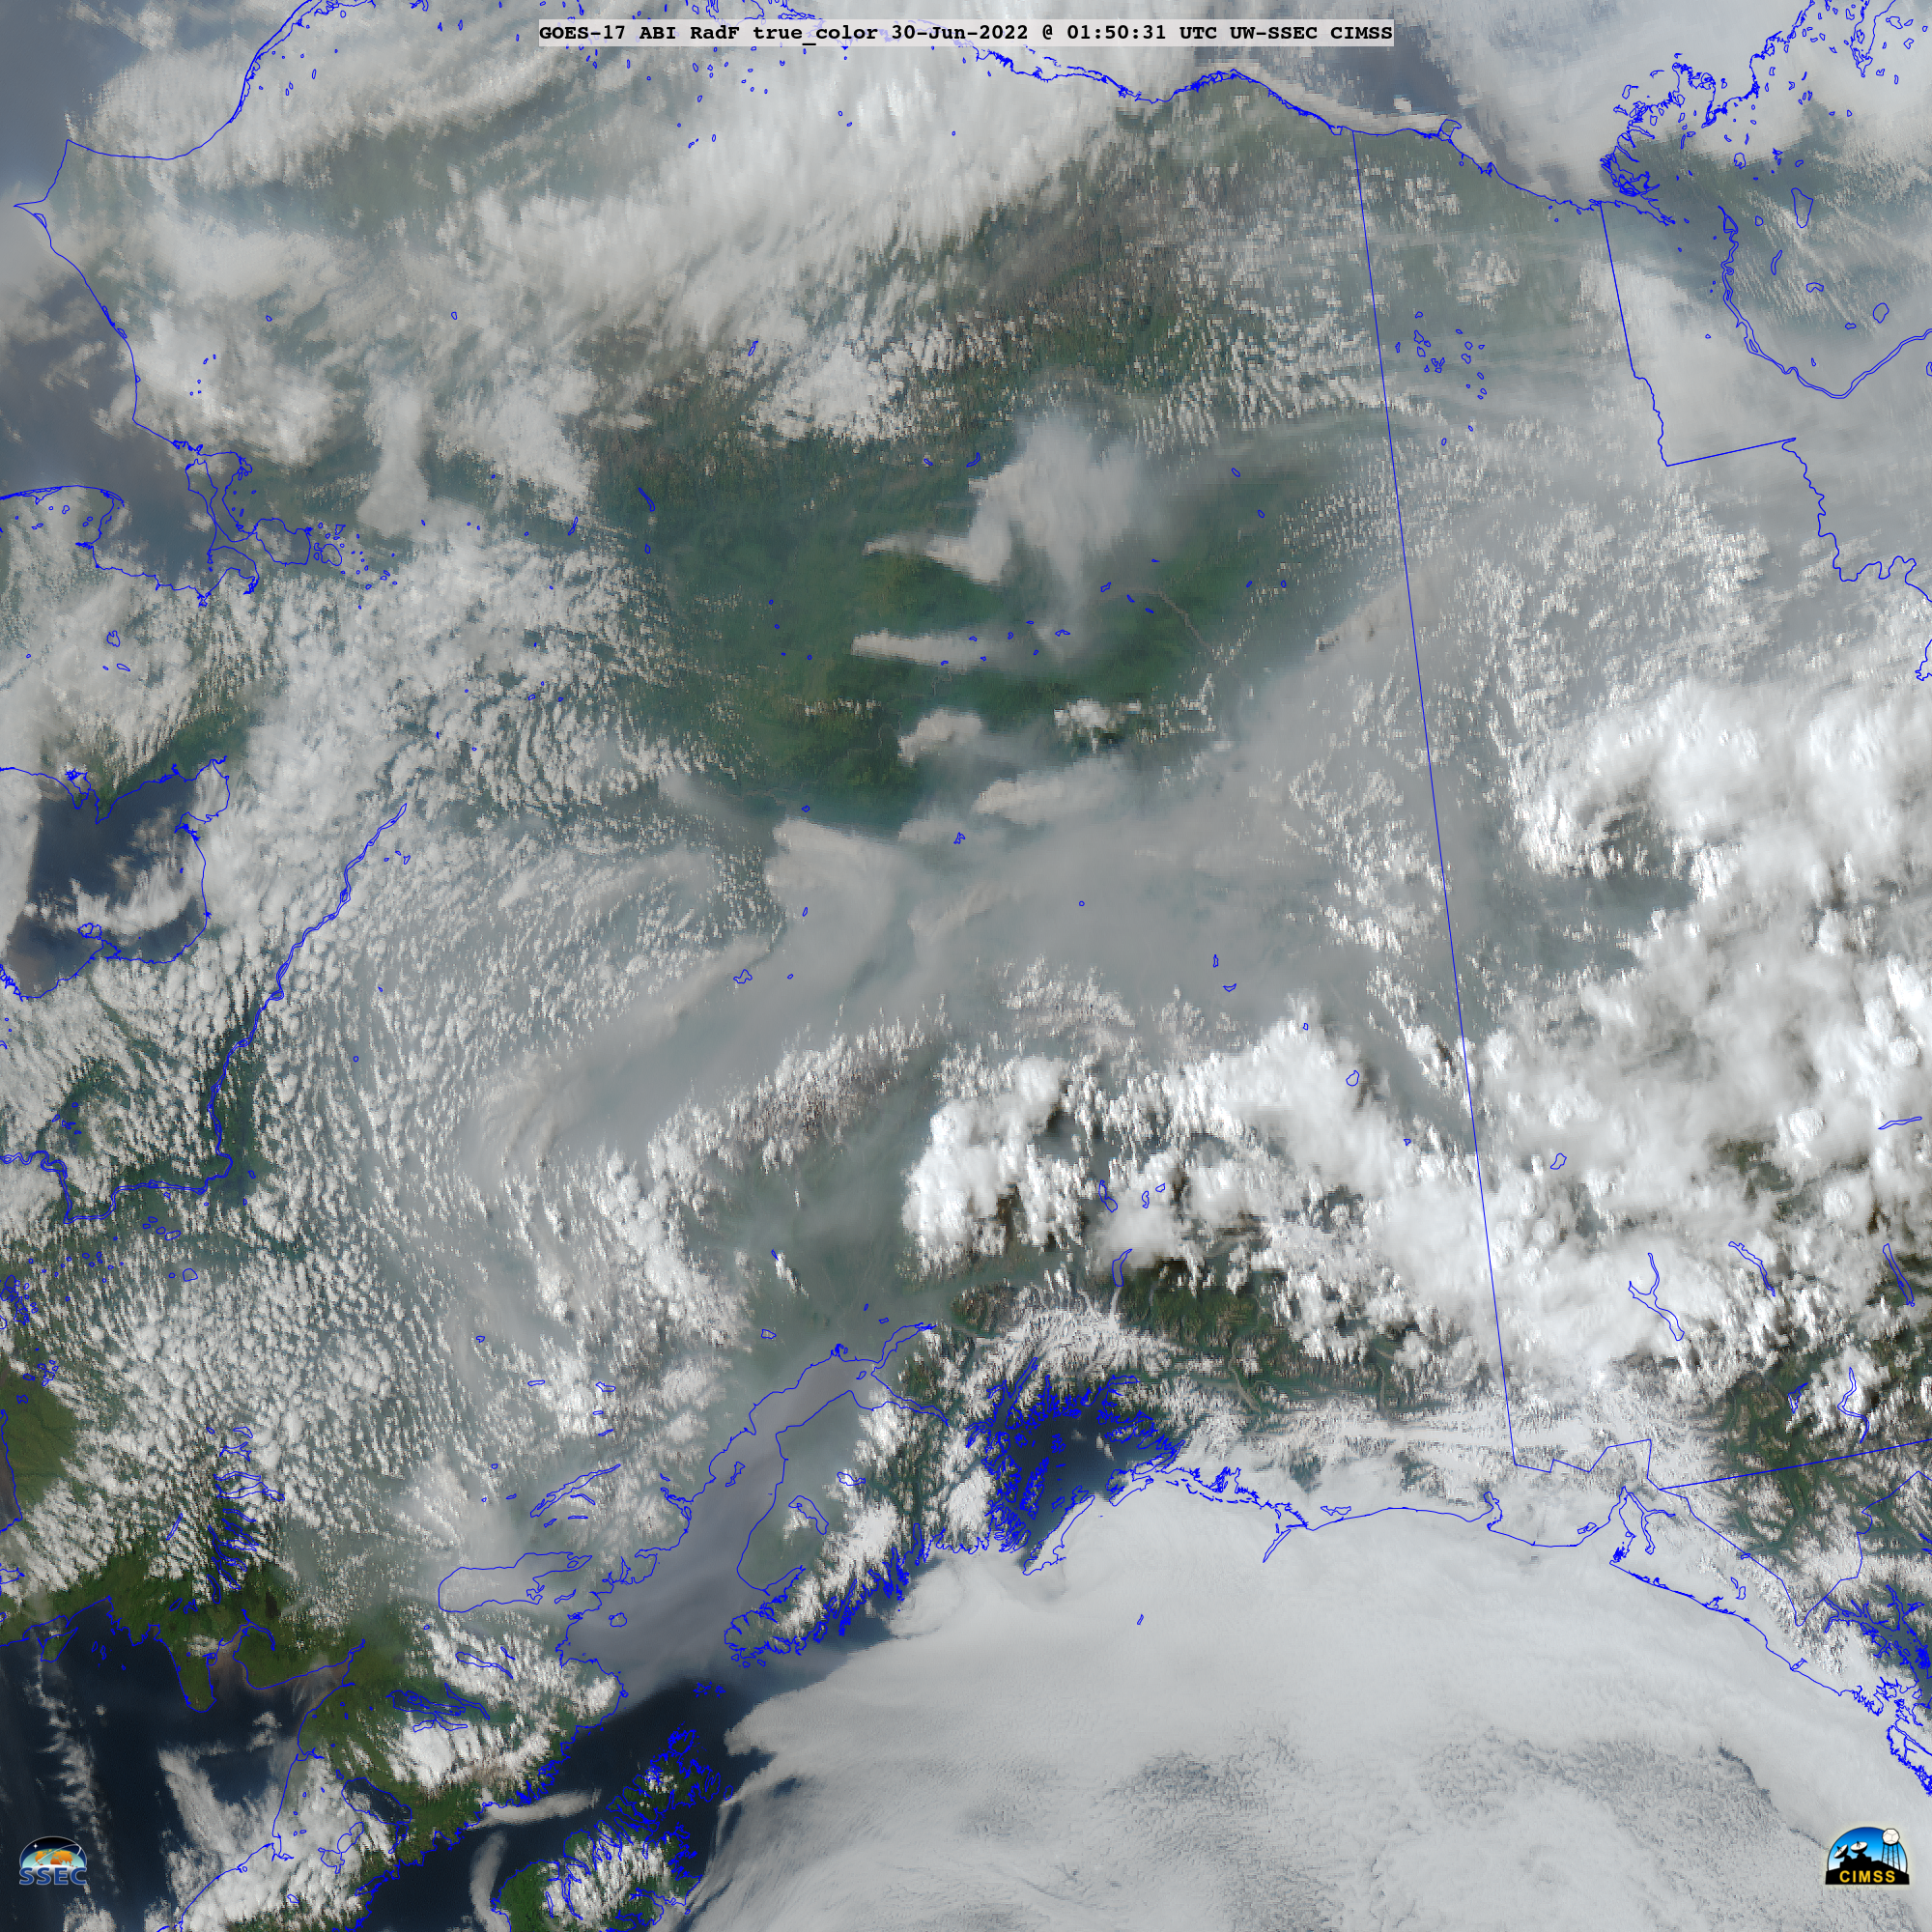
GOES-17 (GOES-West) True Color RGB images created using Geo2Grid (above) showed a widespread pall of smoke covering much of southern Alaska — from above-normal fire activity during the preceding several days, amid drought conditions — along with the growth of new smoke plumes from many of the larger fires later in... Read More
