Tropical Storm Iba off the coast of Brazil

GOES-16 “Red” Visible (0.64 µm) images, with GLM Groups plotted in red [click to play animation | MP4]
![GOES-16 "Clean" Infrared Window (10.3 µm) images [click to play animation | MP4]](https://cimss.ssec.wisc.edu/satellite-blog/wp-content/uploads/sites/5/2019/03/190324_goes16_infrared_TS_Iba_anim.gif)
GOES-16 “Clean” Infrared Window (10.3 µm) images [click to play animation | MP4]
![NOAA-20 VIIRS True Color Red-Green-Blue (RGB) and Infrared Window (11.45 µm) images at 1610 UTC [click to enlarge]](https://cimss.ssec.wisc.edu/satellite-blog/wp-content/uploads/sites/5/2019/03/190324_16utc_noaa20_viirs_ttuecolor_infrared_TS_Iba_anim.gif)
NOAA-20 VIIRS True Color Red-Green-Blue (RGB) and Infrared Window (11.45 µm) images at 1610 UTC [click to enlarge]
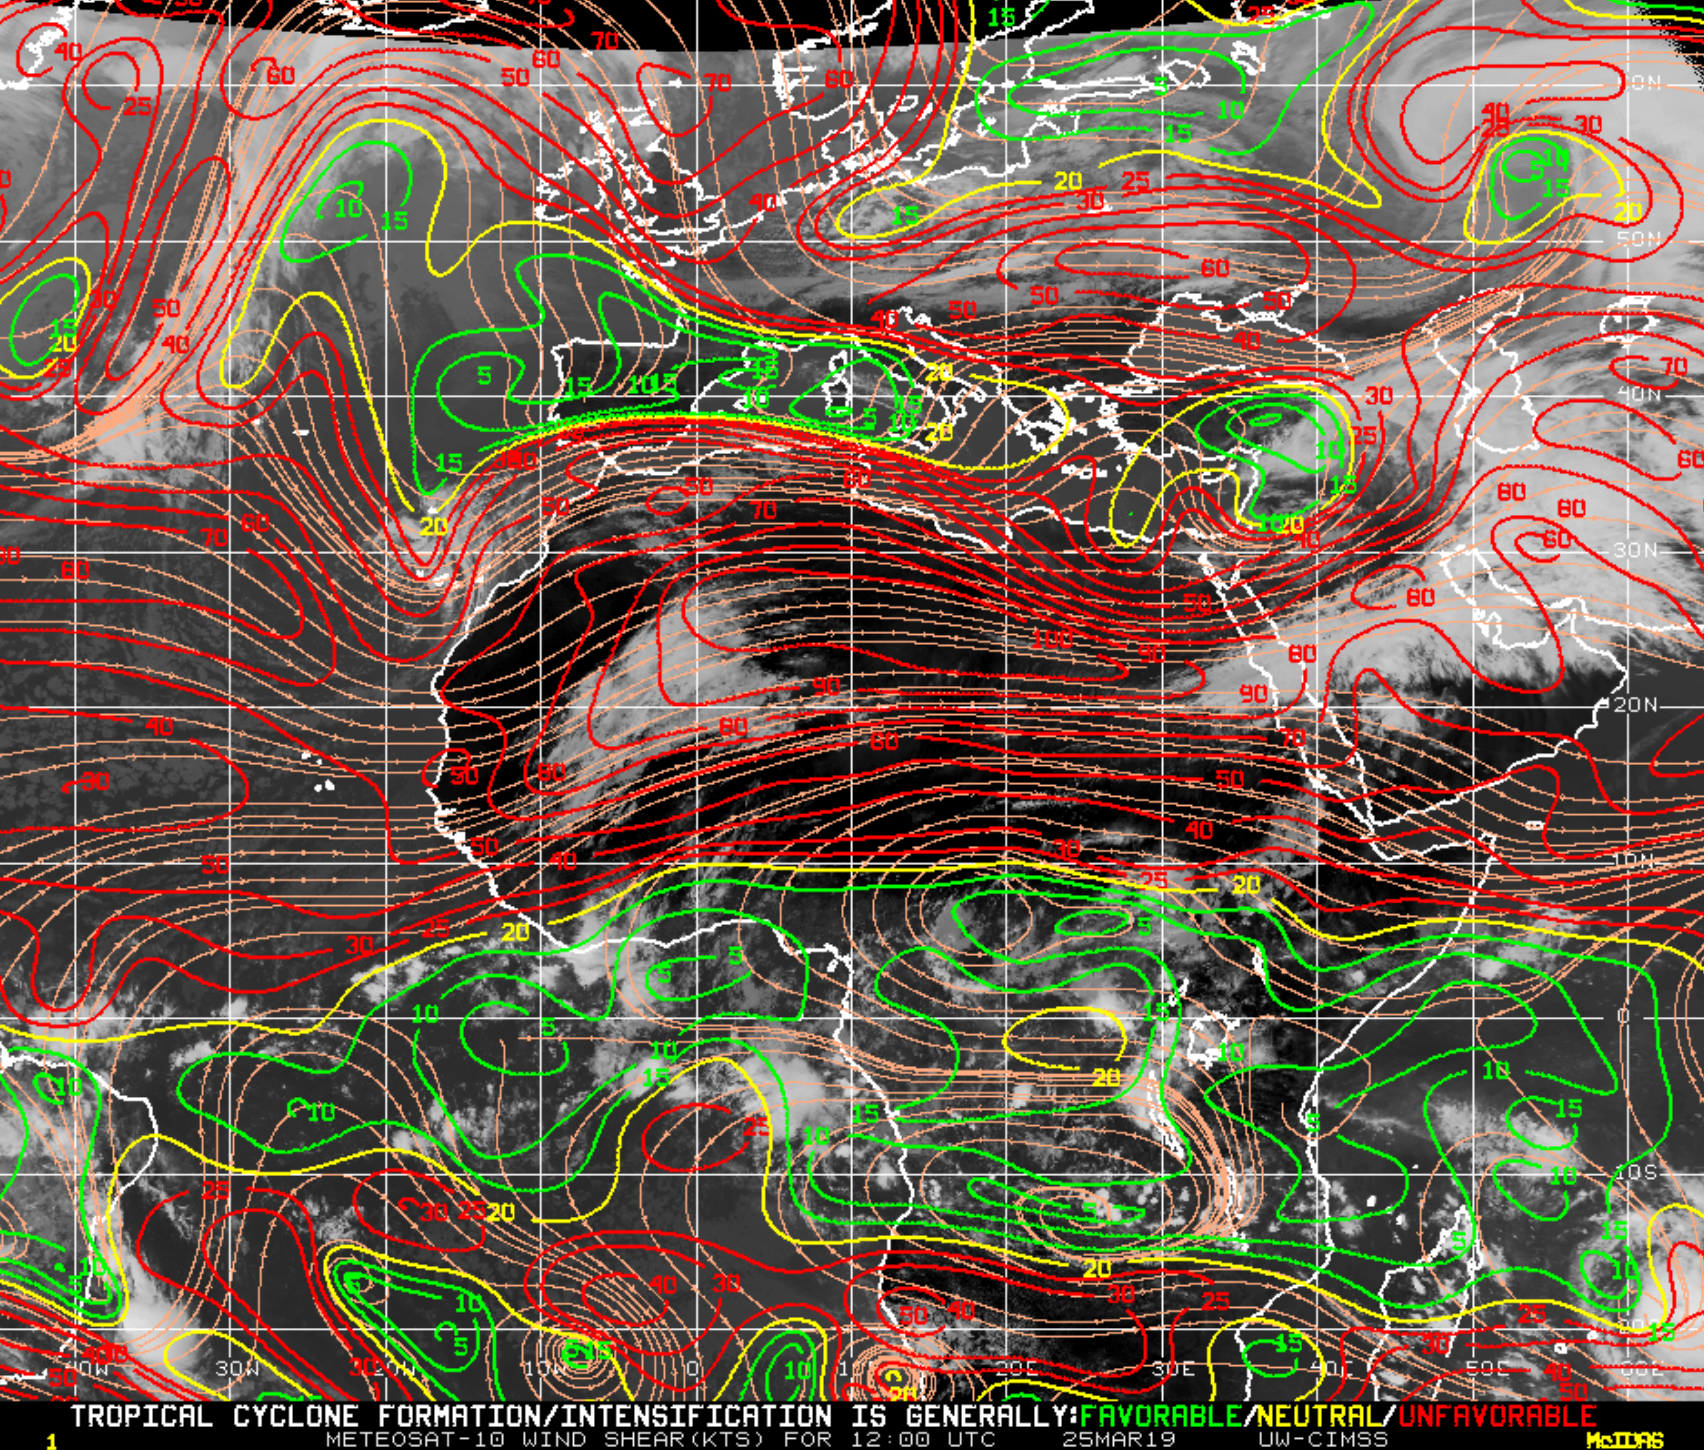
GOES-16 “Clean” Infrared Window (10.3 µm) images, with an overlay of 18 UTC deep-layer wind shear [click to enlarge]
GOES-16 “Clean” Infrared Window (10.3 µm) and Infrared-Water Vapor (10.3-6.9µm) BTD images [click to enlarge]
GOES-16 “Red” Visible (0.64 µm) images, with Metop-A ASCAT winds at 1137 UTC [click to enlarge]
![MIMIC Total Precipitable Water product [click to play animation]](https://cimss.ssec.wisc.edu/satellite-blog/wp-content/uploads/sites/5/2019/03/190324_mimicTPW_Iba_anim.gif)
MIMIC Total Precipitable Water product [click to play animation]
![Sea Surface Temperature analysis at 2230 UTC on 23 March [click to enlarge]](https://cimss.ssec.wisc.edu/satellite-blog/wp-content/uploads/sites/5/2019/03/190323_2230utc_sst_Iba.png)
Sea Surface Temperature analysis at 2230 UTC on 23 March [click to enlarge]
===== 25 March Update =====

GOES-16 “Red” Visible (0.64 µm) with GLM Groups (left) and “Clean” Infrared Window (10.3 µm, right) images [click to play animation | MP4]
A timely overpass of the Suomi NPP satellite at 1639 UTC provided 375-meter resolution VIIRS True Color RGB and Infrared Window (11.45 µm) images (below), which showed a large overshooting top that exhibited infrared brightness temperatures of -90ºC and colder (yellow), with a warmer ring of compensating subsidence immediately surrounding it. The coldest pixel had a brightness temperature of -103.7ºC — which is almost 1ºC colder than the -102.96ºC value noted over Australia in 2008.
![Suomi NPP VIIRS True Color RGB and Infrared Window (11.45 µm) images [click to enlarge]](https://cimss.ssec.wisc.edu/satellite-blog/wp-content/uploads/sites/5/2019/03/190325_16utc_suomiNPP_truecolorinfraredWindow_Iba_anim.gif)
Suomi NPP VIIRS True Color RGB and Infrared Window (11.45 µm) images [click to enlarge]
![VIIRS Infrared (11.45 µm) images from NOAA-20 at 1549 UTC and Suomi NPP at 1639 UTC [click to enlarge]](https://cimss.ssec.wisc.edu/satellite-blog/wp-content/uploads/sites/5/2019/03/190325_noaa20_suomiNPP_viirs_truecolor_infraredWindow_Iba_v2_anim.gif)
VIIRS Infrared (11.45 µm) images from NOAA-20 at 1549 UTC and Suomi NPP at 1639 UTC [click to enlarge]