Category 5 Hurricane Michael makes landfall along the Florida coast
![Sequence of Infrared Window images from Terra/Aqua MODIS (11.0 µm) and Suomi NPP VIIRS (11.45 µm) [click to enlarge]](https://cimss.ssec.wisc.edu/satellite-blog/wp-content/uploads/sites/5/2018/10/181010_modis_viirs_infrared_am_Michael_anim.gif)
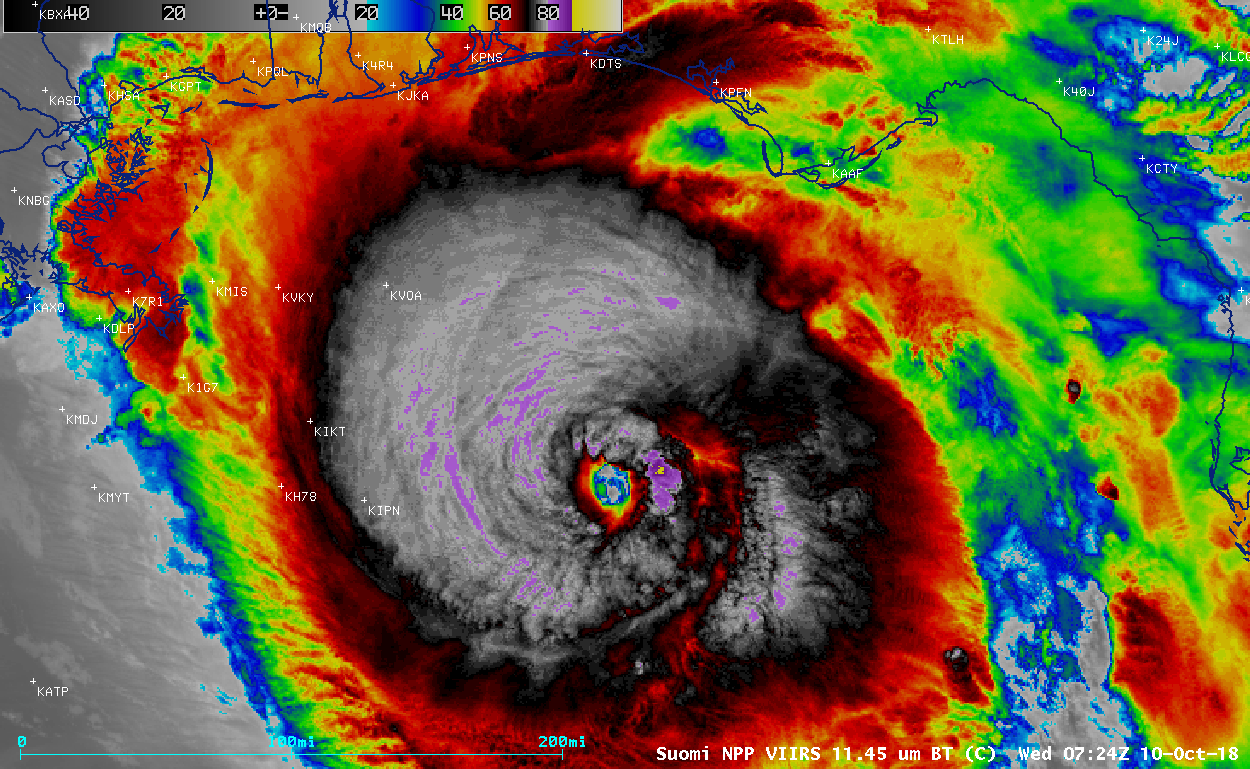
Infrared Window images from Terra/Aqua MODIS (11.0 µm) and NOAA-20/Suomi NPP VIIRS (11.45 µm) [click to enlarge]
Toggles between VIIRS Day/Night Band (0.7 µm) and Infrared Window (11.45 µm) images from NOAA-20 and Suomi NPP (below; courtesy of William Straka, CIMSS) revealed convectively-generated mesospheric airglow waves propagating away from the hurricane.
![NOAA-20 VIIRS Day/Night Band (0.7 µm) and Infrared Window (11.45 µm) images [click to enlarge]](https://cimss.ssec.wisc.edu/satellite-blog/wp-content/uploads/sites/5/2018/10/181010_0642utc_noaa20_viirs_DayNightBand_InfraredWindow_Hurricane_Michael_anim.gif)
NOAA-20 VIIRS Day/Night Band (0.7 µm) and Infrared Window (11.45 µm) images [click to enlarge]
![Suomi NPP VIIRS Day/Night Band (0.7 µm) and Infrared Window (11.45 µm) images [click to enlarge]](https://cimss.ssec.wisc.edu/satellite-blog/wp-content/uploads/sites/5/2018/10/181010_0732utc_suomiNPP_viirs_DayNightBand_InfraredWindow_Hurricane_Michael_anim.gif)
Suomi NPP VIIRS Day/Night Band (0.7 µm) and Infrared Window (11.45 µm) images [click to enlarge]
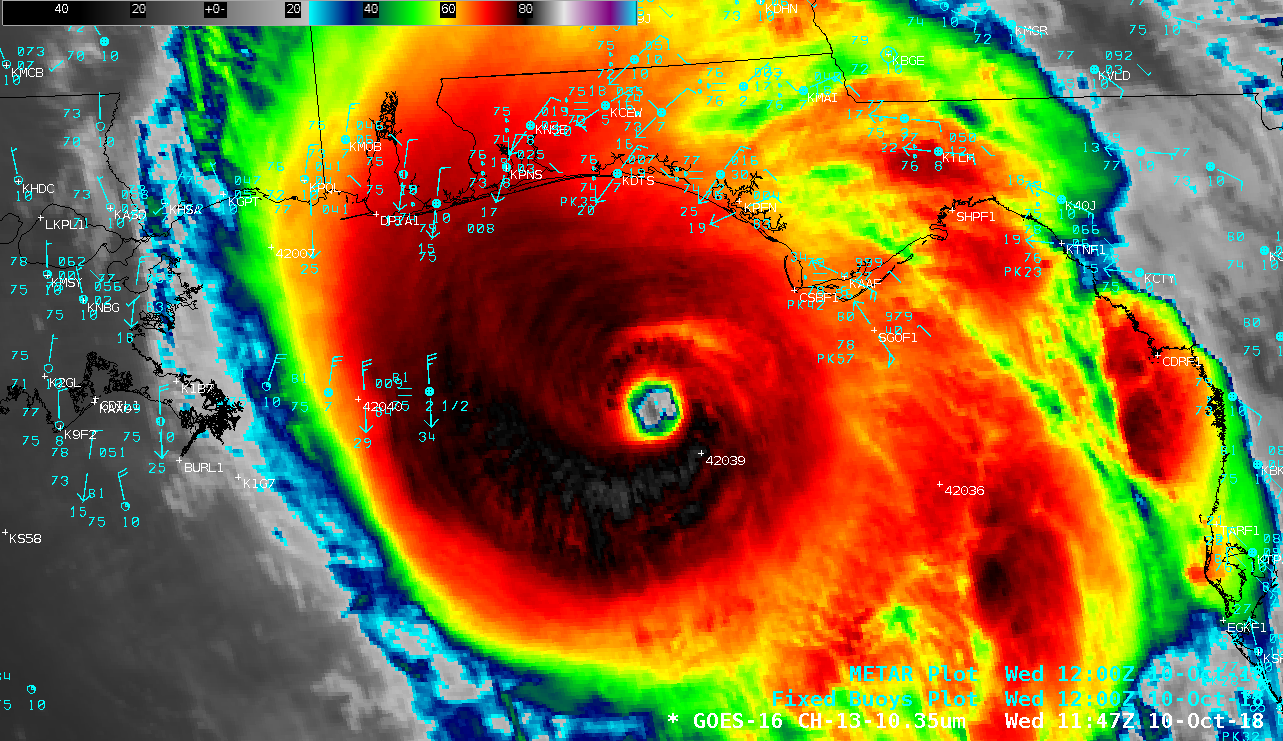
GOES-16 “Clean” Infrared Window (10.3 µm) images [click to play MP4 animation]
![GOES-16 "Red" Visible (0.64 µm) images [click to play MP4 animation]](https://cimss.ssec.wisc.edu/satellite-blog/wp-content/uploads/sites/5/2018/10/g16_vis_mich_fl-20181010_121928.png)
GOES-16 “Red” Visible (0.64 µm) images [click to play MP4 animation]
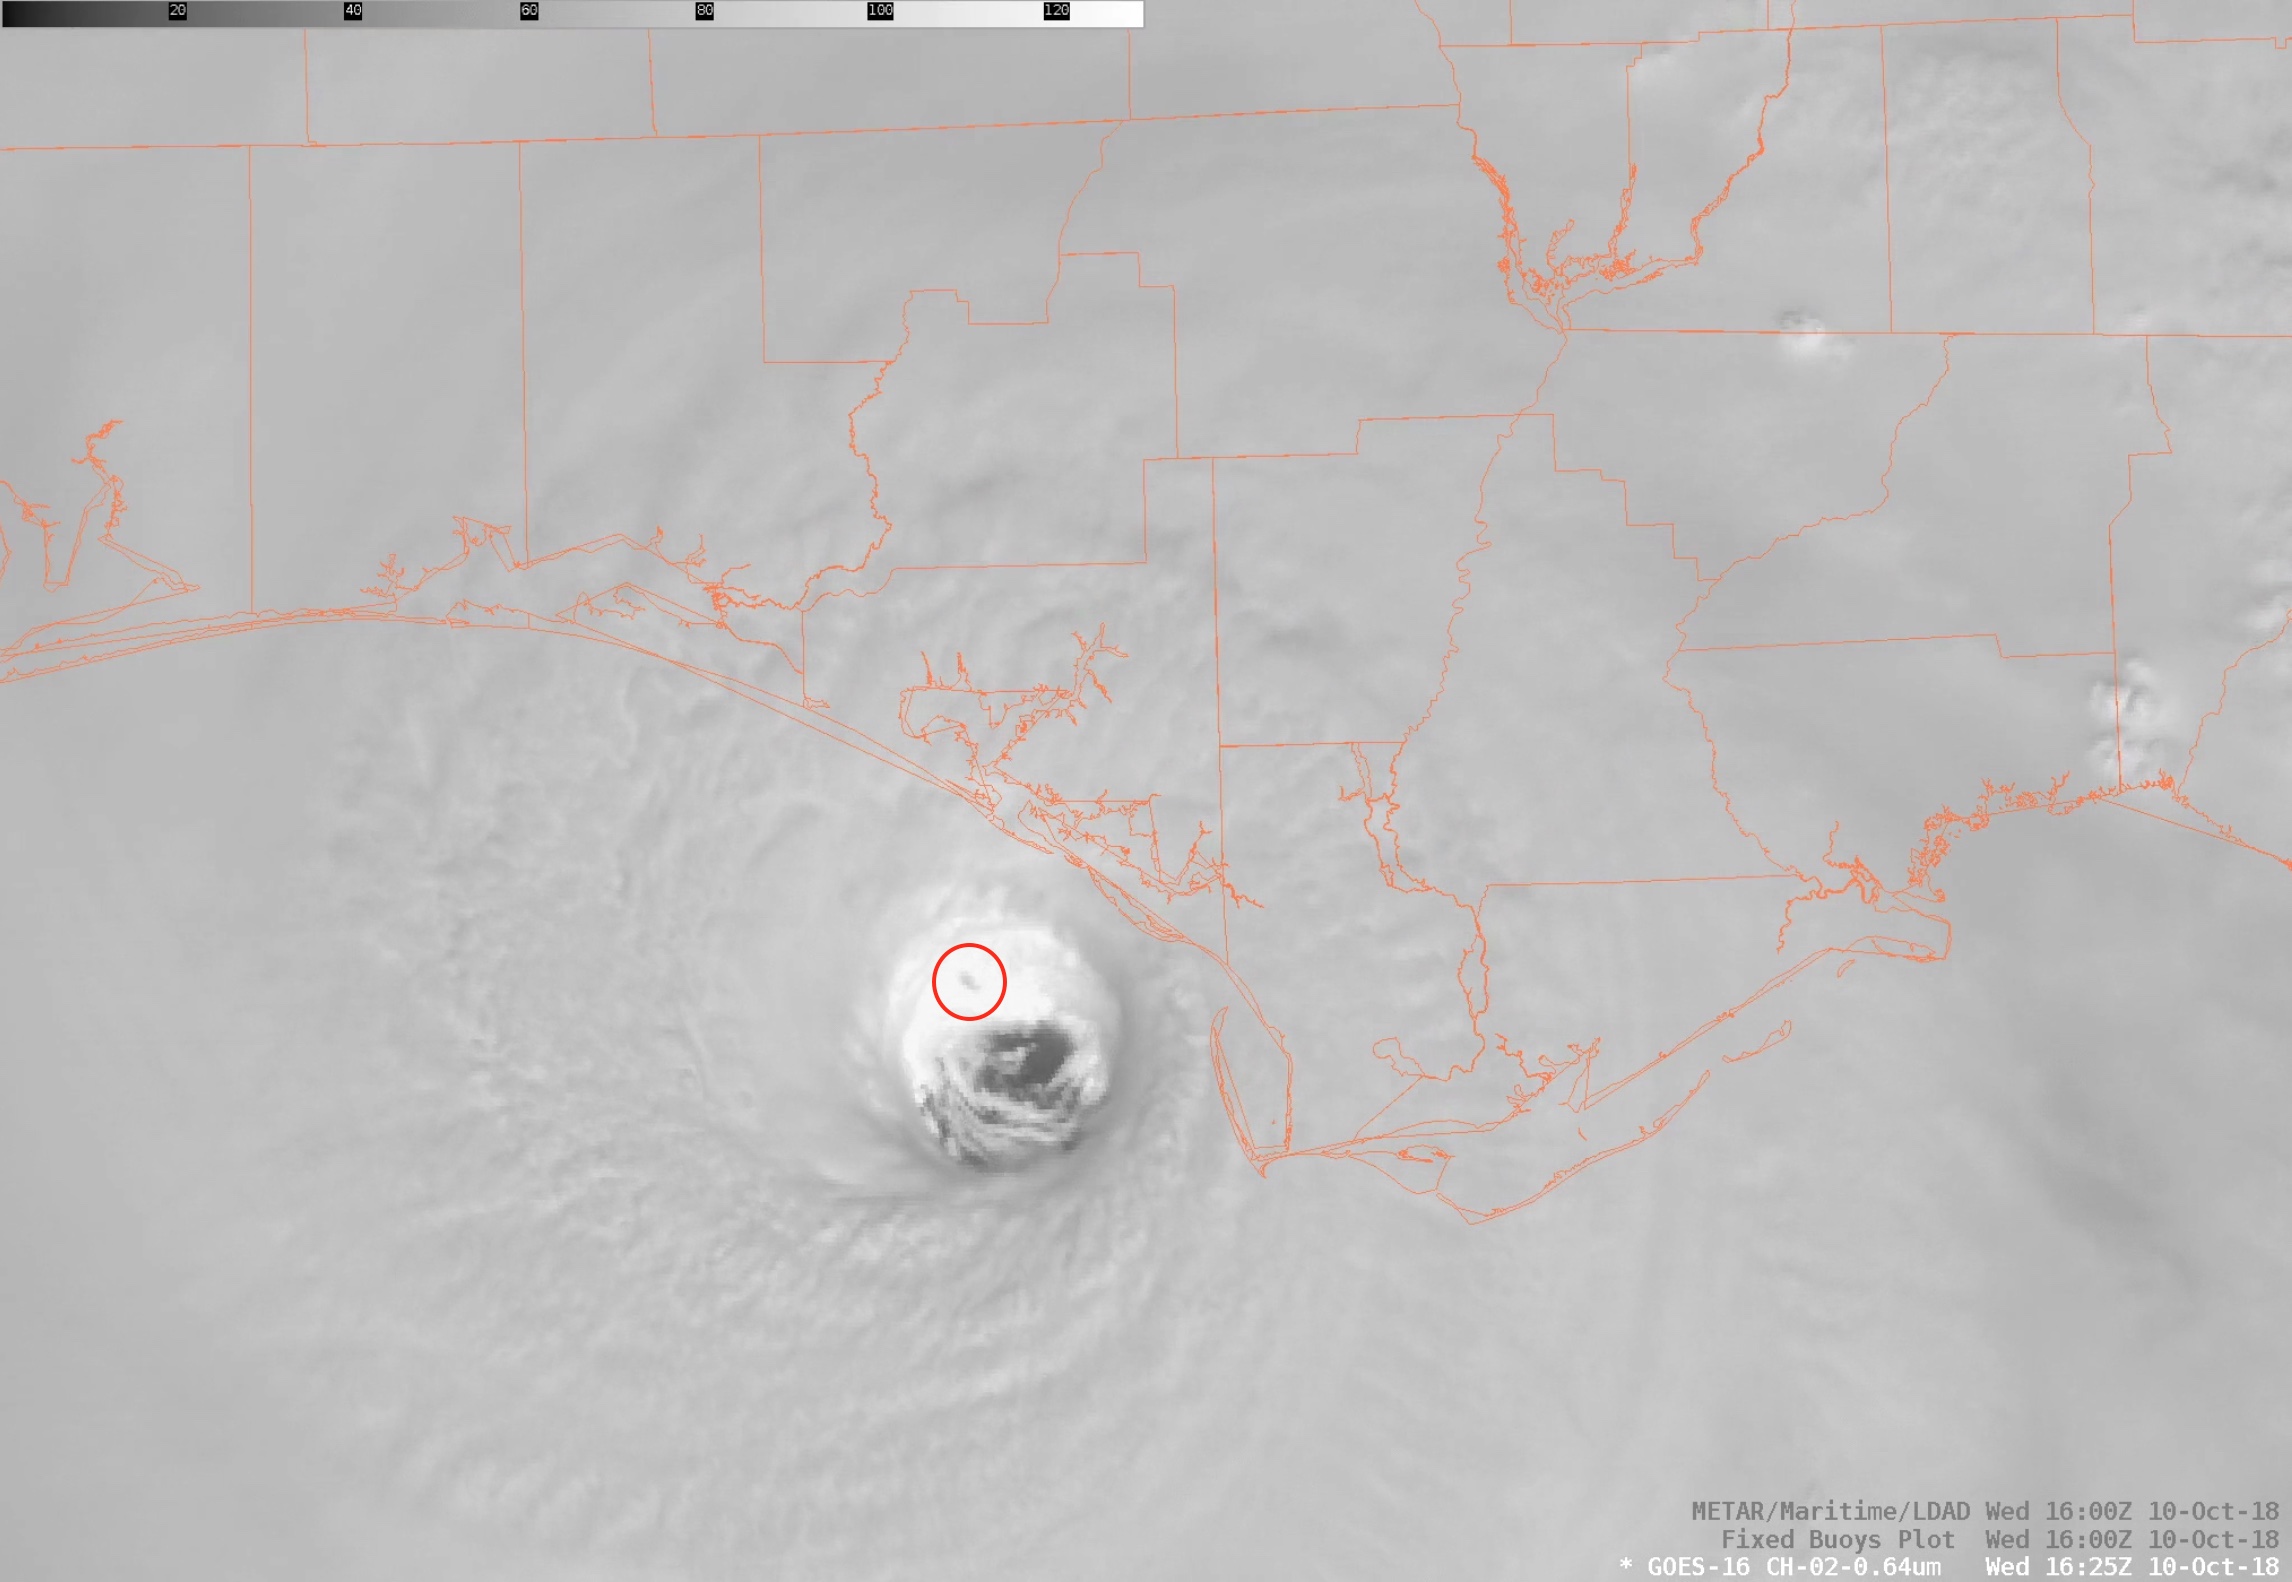
![GOES-16 "Red" Visible (0.64 µm) images [click to play MP4 animation]](https://cimss.ssec.wisc.edu/satellite-blog/wp-content/uploads/sites/5/2018/10/vis_zoom_mich-20181010_160228.png)
GOES-16 “Red” Visible (0.64 µm) images [click to play MP4 animation]
![GOES-16 "Clean" Infrared Window (10.3 µm) images [click to play MP4 animation]](https://cimss.ssec.wisc.edu/satellite-blog/wp-content/uploads/sites/5/2018/10/ir_zoom_mich-20181010_160228.png)
GOES-16 “Clean” Infrared Window (10.3 µm) images [click to play MP4 animation]
GOES-16 “Red” Visible (0.64 µm) images, with GLM lightning Groups plotted in red [click to play MP4 animation]

GOES-16 “Red” Visible (0.64 µm) images, with surface observations and with/without a map overlay [click to play animation | MP4]
![GOES-17 "Red" Visible (0.64 µm) images, with surface observations and with/without a map overlay [click to enlarge]](https://cimss.ssec.wisc.edu/satellite-blog/wp-content/uploads/sites/5/2018/10/181010_goes17_visible_Michael_eye_landfall_anim.gif)
GOES-17 “Red” Visible (0.64 µm) images, with surface observations and with/without a map overlay [click to enlarge]
![16-panel images of all GOES-16 ABI spectral bands [click to play animation | MP4]](https://cimss.ssec.wisc.edu/satellite-blog/wp-content/uploads/sites/5/2018/10/181010_1547utc_1642utc_goes16_abi_bands_Michael_eye_anim.gif)
All 16 spectral bands of the GOES-16 ABI [click to play animation | MP4]
![Infrared Window images from Aqua MODIS (11.0 µm) and NOAA-20/Suomi NPP VIIRS (11.45 µm) [click to enlarge]](https://cimss.ssec.wisc.edu/satellite-blog/wp-content/uploads/sites/5/2018/10/181010_modis_viirs_infrared_pm_Michael_anim.gif)
Infrared Window images from Aqua MODIS (11.0 µm) and NOAA-20/Suomi NPP VIIRS (11.45 µm) [click to enlarge]
![GOES-16 Mid/Upper-level winds, 21 UTC on 09 October to 21 UTC on 10 October [click to enlarge]](https://cimss.ssec.wisc.edu/satellite-blog/wp-content/uploads/sites/5/2018/10/181009_181010_goes16_upper_level_winds_Michael_anim.gif)
GOES-16 Mid-level (6.9 µm) Water Vapor images with Mid/Upper-level winds, from 21 UTC on 09 October to 21 UTC on 10 October [click to enlarge]
Aqua MODIS Near-Infrared “Cirrus” (1.37 µm) and Water Vapor (6.7 µm) images [click to enlarge]
![GOES-16 RGB images [click to play MP4 animation]](https://cimss.ssec.wisc.edu/satellite-blog/wp-content/uploads/sites/5/2018/10/181010_michael_rgb.jpeg)
GOES-16 RGB images [click to play MP4 animation]
“Red” Visible (0.64 µm) images from GOES-16 (left) and GOES-17 (right) [click to play animation]
===== 11 October Update =====
![Aqua MODIS True Color RGB images from 06 October and 11 October [click to enlarge]](https://cimss.ssec.wisc.edu/satellite-blog/wp-content/uploads/sites/5/2018/10/181006_181011_aqua_modis_truecolor_FL_before_after_Michael_anim.gif)
Aqua MODIS True Color RGB images from 06 October and 11 October [click to enlarge]
![Aqua MODIS True Color RGB images from 06 October and 11 October [click to enlarge]](https://cimss.ssec.wisc.edu/satellite-blog/wp-content/uploads/sites/5/2018/10/181006_181011_aqua_modis_truecolor_GoM_before_after_Michael_anim.gif)
Aqua MODIS True Color RGB images from 06 October and 11 October [click to enlarge]
![MIMIC Total Precipitable Water images, 07-11 October [click to play animation | MP4]](https://cimss.ssec.wisc.edu/satellite-blog/wp-content/uploads/sites/5/2018/10/181007_181011_mimic_tpw_Michael_anim.gif)
MIMIC Total Precipitable Water images, 07-11 October [click to play animation | MP4]
===== 18 October Update =====
![Terra MODIS True Color RGB images from 04 October and 18 October [click to enlarge]](https://cimss.ssec.wisc.edu/satellite-blog/wp-content/uploads/sites/5/2018/10/181004_181018_terra_modis_truecolor_FL_panhandle_before_after_Michael_anim.gif)
Terra MODIS True Color RGB images from 04 October and 18 October [click to enlarge]
Larger-scale versions of those same before/after Terra MODIS True Color RGB images from the SSEC MODIS Direct Broadcast site (below) showed that the path of damaged vegetation extended far northeastward across Georgia — Michael was still at Category 3 intensity when its center moved into the southwestern corner of the state.
![Terra MODIS True Color RGB images from 04 October and 18 October [click to enlarge]](https://cimss.ssec.wisc.edu/satellite-blog/wp-content/uploads/sites/5/2018/10/181004_181018_terra_modis_truecolor_Gulf_Coast_anim.gif)
Terra MODIS True Color RGB images from 04 October and 18 October [click to enlarge]
![Terra MODIS False Color RGB images from 04 October and 12 October [click to enlarge]](https://cimss.ssec.wisc.edu/satellite-blog/wp-content/uploads/sites/5/2018/10/181004_181012_terra_modis_falsecolor_FL_panhandle_before_after_Michael_anim.gif)
Terra MODIS False Color RGB images from 04 October and 12 October [click to enlarge]