Cyclone Kelvin makes landfall in Australia
![Himawari-8 Visible (0.64 µm, left) and Infrared Window (10.4 µm, right) images, with hourly surface plots at Broome [click to play Animated GIF | MP4 also available]](https://cimss.ssec.wisc.edu/satellite-blog/wp-content/uploads/sites/5/2018/02/180218_himawari8_visible_infrared_Cyclone_Kelvin_anim.gif)
Himawari-8 Visible (0.64 µm, left) and Infrared Window (10.4 µm, right) images, with hourly surface plots at Broome, Australia [click to play Animated GIF | MP4 also available]
A longer animation of Himawari-8 Infrared Window (10.4 µm) images (below) revealed a very large convective burst as Kelvin meandered near the coast early on 17 February — periodic cloud-top infrared brightness temperatures of -90 ºC or colder were seen. After making landfall, the eye structure eventually deteriorated by 18 UTC on 18 February.
![Himawari-8 Infrared Window (10.4 µm) images, with hourly surface plots [click to play MP4 | Animated GIF also available]](https://cimss.ssec.wisc.edu/satellite-blog/wp-content/uploads/sites/5/2018/02/HIM08_IR_KELVIN_17_18FEB2018_960x1280_B13_2018049_040000_0001PANEL_00131.GIF)
Himawari-8 Infrared Window (10.4 µm) images, with hourly surface plots [click to play MP4 | Animated GIF also available]
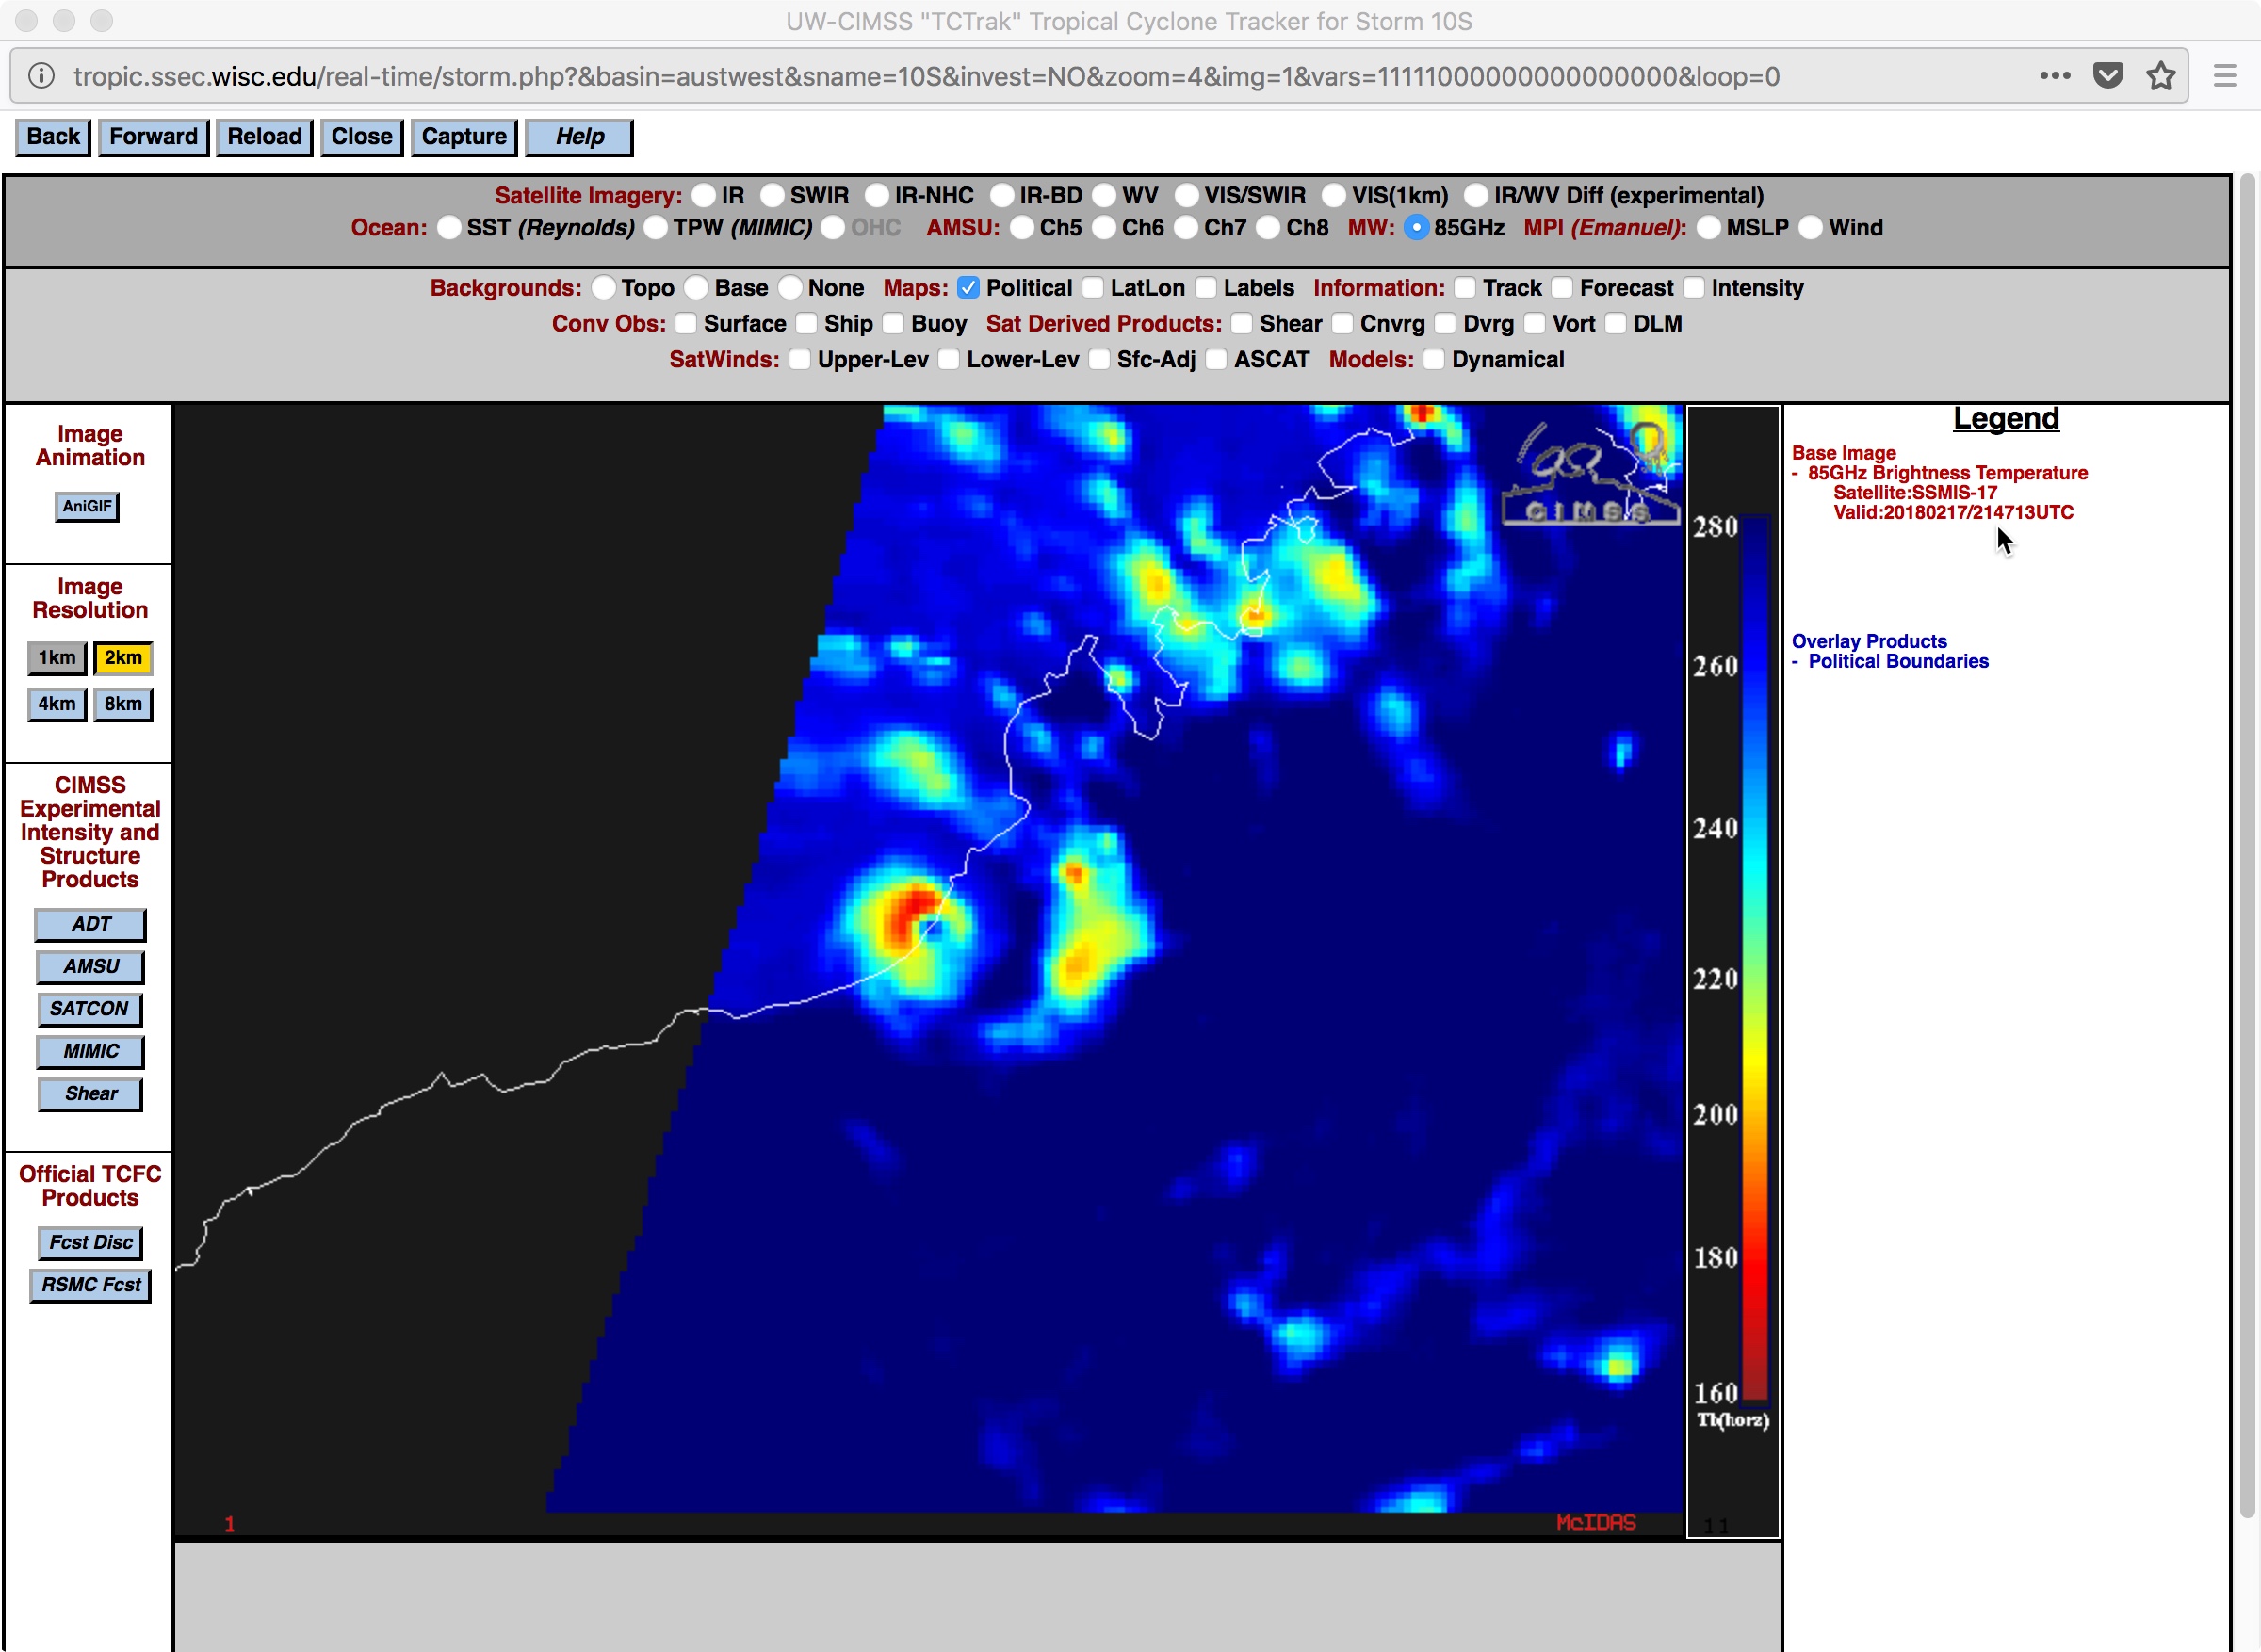
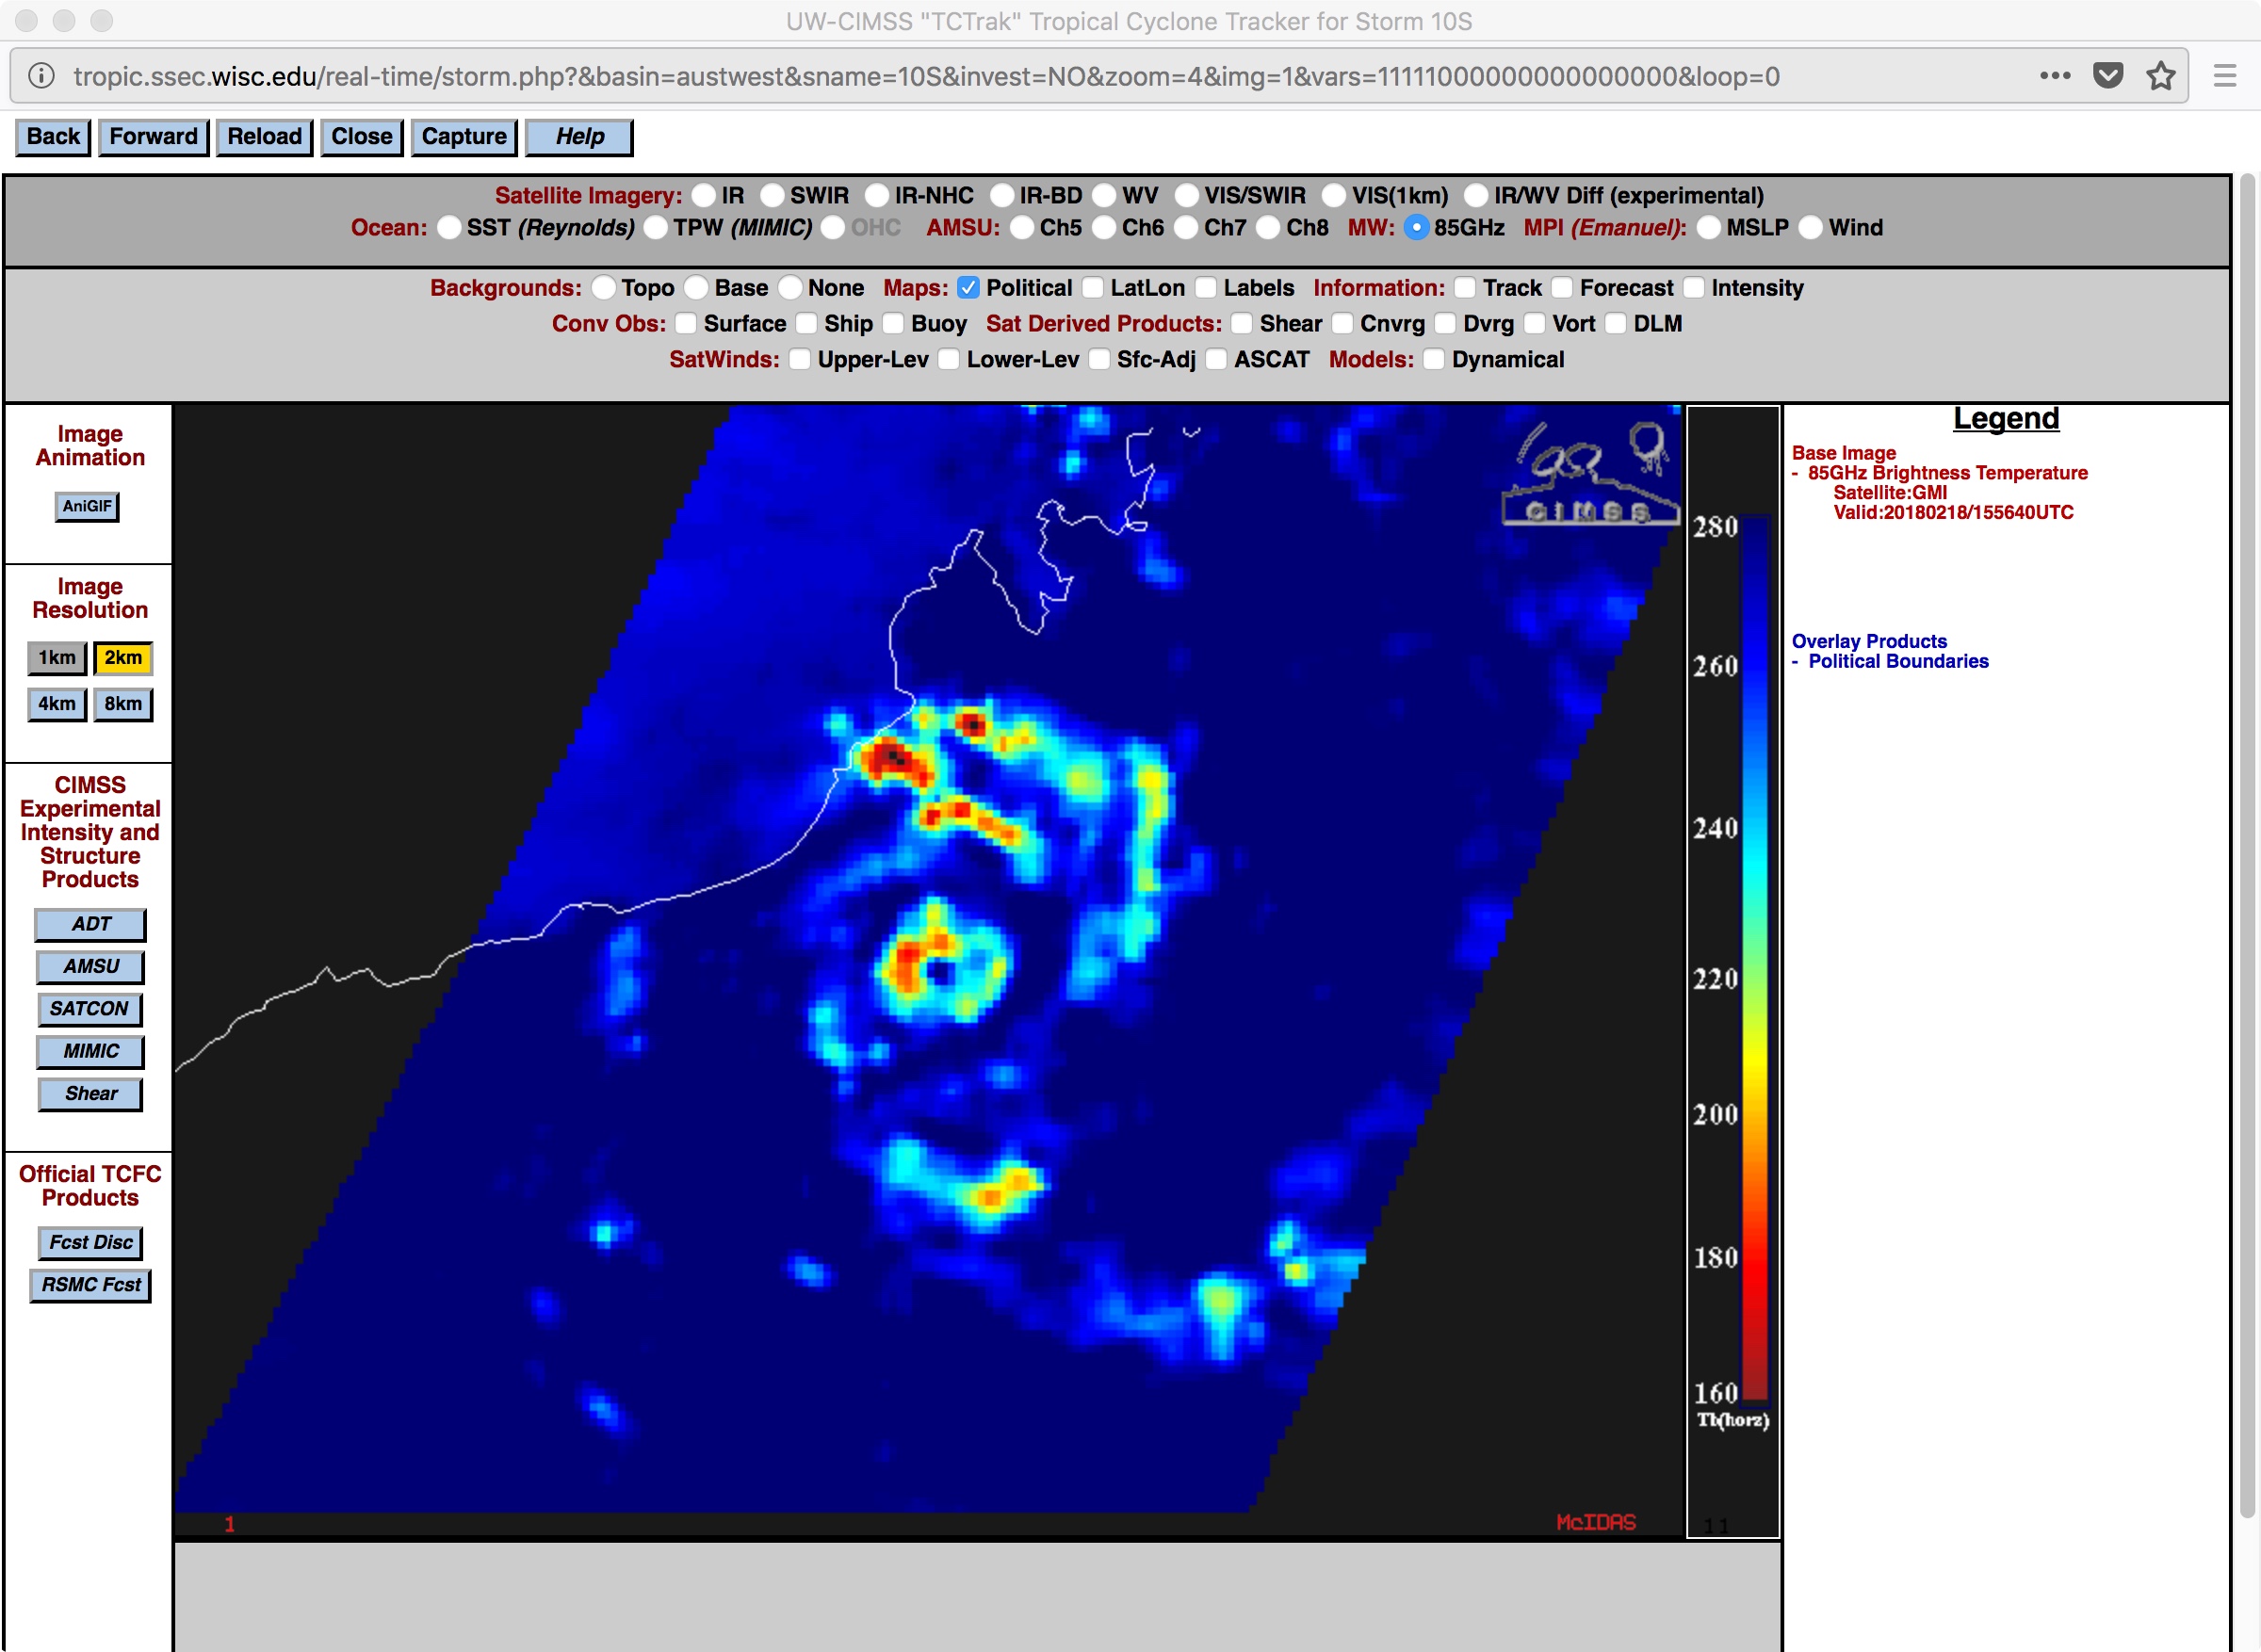
![MIMIC-TC morphed microwave imagery [click to enlarge]](https://cimss.ssec.wisc.edu/satellite-blog/wp-content/uploads/sites/5/2018/02/180217_180218_mimic_tc_Kelvin_anim.gif)
MIMIC-TC morphed microwave imagery [click to enlarge]
![Himawari-8 Water Vapor images, with Deep Layer Wind Shear product [click to enlarge]](https://cimss.ssec.wisc.edu/satellite-blog/wp-content/uploads/sites/5/2018/02/180217_18_himawari8_water_vapor_shear_Cyclone_Kelvin_anim.gif)
Himawari-8 Water Vapor images, with Deep Layer Wind Shear product [click to enlarge]
![Terra MODIS and Suomi NPP VIIRS True-color RGB images [click to enlarge]](https://cimss.ssec.wisc.edu/satellite-blog/wp-content/uploads/sites/5/2018/02/180218_modis_viirs_truecolor_Kelvin_anim.gif)
Terra MODIS and Suomi NPP VIIRS True-color RGB images [click to enlarge]