Bonnie
![GOES-13 6.5 µm Water Vapor Infrared images [click to play animation]](https://cimss.ssec.wisc.edu/satellite-blog/wp-content/uploads/sites/5/2016/05/BonnieWVanim_23May_29MayFULL.gif)
GOES-13 6.5 µm Water Vapor Infrared images[click to play animation]
![MIMIC Total Precipitable Water derived from Microwave imagery, 1800 UTC 28 May - 1700 UTC 30 May [click to enlarge]](https://cimss.ssec.wisc.edu/satellite-blog/wp-content/uploads/sites/5/2016/05/MIMIC_TPW_Bonnie_72hrs_ending1700UTC_30May.gif)
MIMIC Total Precipitable Water derived from Microwave imagery, 1800 UTC 28 May – 1700 UTC 30 May [click to enlarge]
![Rapidscat Scatterometer Winds, 1012 UTC on 27 May [click to enlarge]](https://cimss.ssec.wisc.edu/satellite-blog/wp-content/uploads/sites/5/2016/05/160527_1012utc_rapidscat_Invest91L.gif)
Rapidscat Scatterometer Winds, 1012 UTC on 27 May [click to enlarge]
![MODIS-based Sea Surface Temperatures, 1848 UTC on 27 May [click to enlarge]](https://cimss.ssec.wisc.edu/satellite-blog/wp-content/uploads/sites/5/2016/05/MODIS_SST_20160527_1848.png)
MODIS-based Sea Surface Temperatures, 1848 UTC on 27 May [click to enlarge]
![Suomi NPP VIIRS Day/Night Band (0.70 µm Visible) and Infrared (11.45 µm) Imagery at 0621 UTC on 27 May 2016 [click to enlarge]](https://cimss.ssec.wisc.edu/satellite-blog/wp-content/uploads/sites/5/2016/05/DNB_NPP_11.45_27May2016_0621toggle.gif)
Suomi NPP VIIRS Day/Night Band (0.70 µm Visible) and Infrared (11.45 µm) Imagery at 0621 UTC on 27 May 2016 [click to enlarge]
![Suomi NPP VIIRS Day/Night Band (0.70 µm Visible) and Infrared (11.45 µm) Imagery at 0742 UTC on 28 May 2016 [click to enlarge]](https://cimss.ssec.wisc.edu/satellite-blog/wp-content/uploads/sites/5/2016/05/DNB_NPP_11.45_28May2016_0742toggle.gif)
Suomi NPP VIIRS Day/Night Band (0.70 µm Visible) and Infrared (11.45 µm) Imagery at 0742 UTC on 28 May 2016 [click to enlarge]
![Suomi NPP VIIRS Day/Night Band (0.70 µm Visible) and Infrared (11.45 µm) Imagery at 0723 UTC on 29 May 2016 [click to enlarge]](https://cimss.ssec.wisc.edu/satellite-blog/wp-content/uploads/sites/5/2016/05/DNB_NPP_11.45_29May2016_0723toggle.gif)
Suomi NPP VIIRS Day/Night Band (0.70 µm Visible) and Infrared (11.45 µm) Imagery at 0723 UTC on 29 May 2016 [click to enlarge]
![GOES-13 Infrared (10.7 µm) Imagery at 2045 UTC on 28 May and at 1045 UTC 29 May 2016; the Yellow Arrow points to the low-level circulation center [click to enlarge]](https://cimss.ssec.wisc.edu/satellite-blog/wp-content/uploads/sites/5/2016/05/GOES13_IR4_28MAY2016_2045_29MAY_1045toggle.gif)
GOES-13 Infrared (10.7 µm) Imagery at 2045 UTC on 28 May and at 1045 UTC 29 May 2016; the Yellow Arrow points to the low-level circulation center [click to enlarge]
===== 01 June Update =====
![GOES-13 Visible (0.63 µm) images [click to play MP4 animation]](https://cimss.ssec.wisc.edu/satellite-blog/wp-content/uploads/sites/5/2016/06/960x1280_EASTL_B1_GOES13_VIS_BONNIE_01JUNE2016_2016153_181500_0001PANEL.GIF)
GOES-13 Visible (0.63 µm) images [click to play MP4 animation]
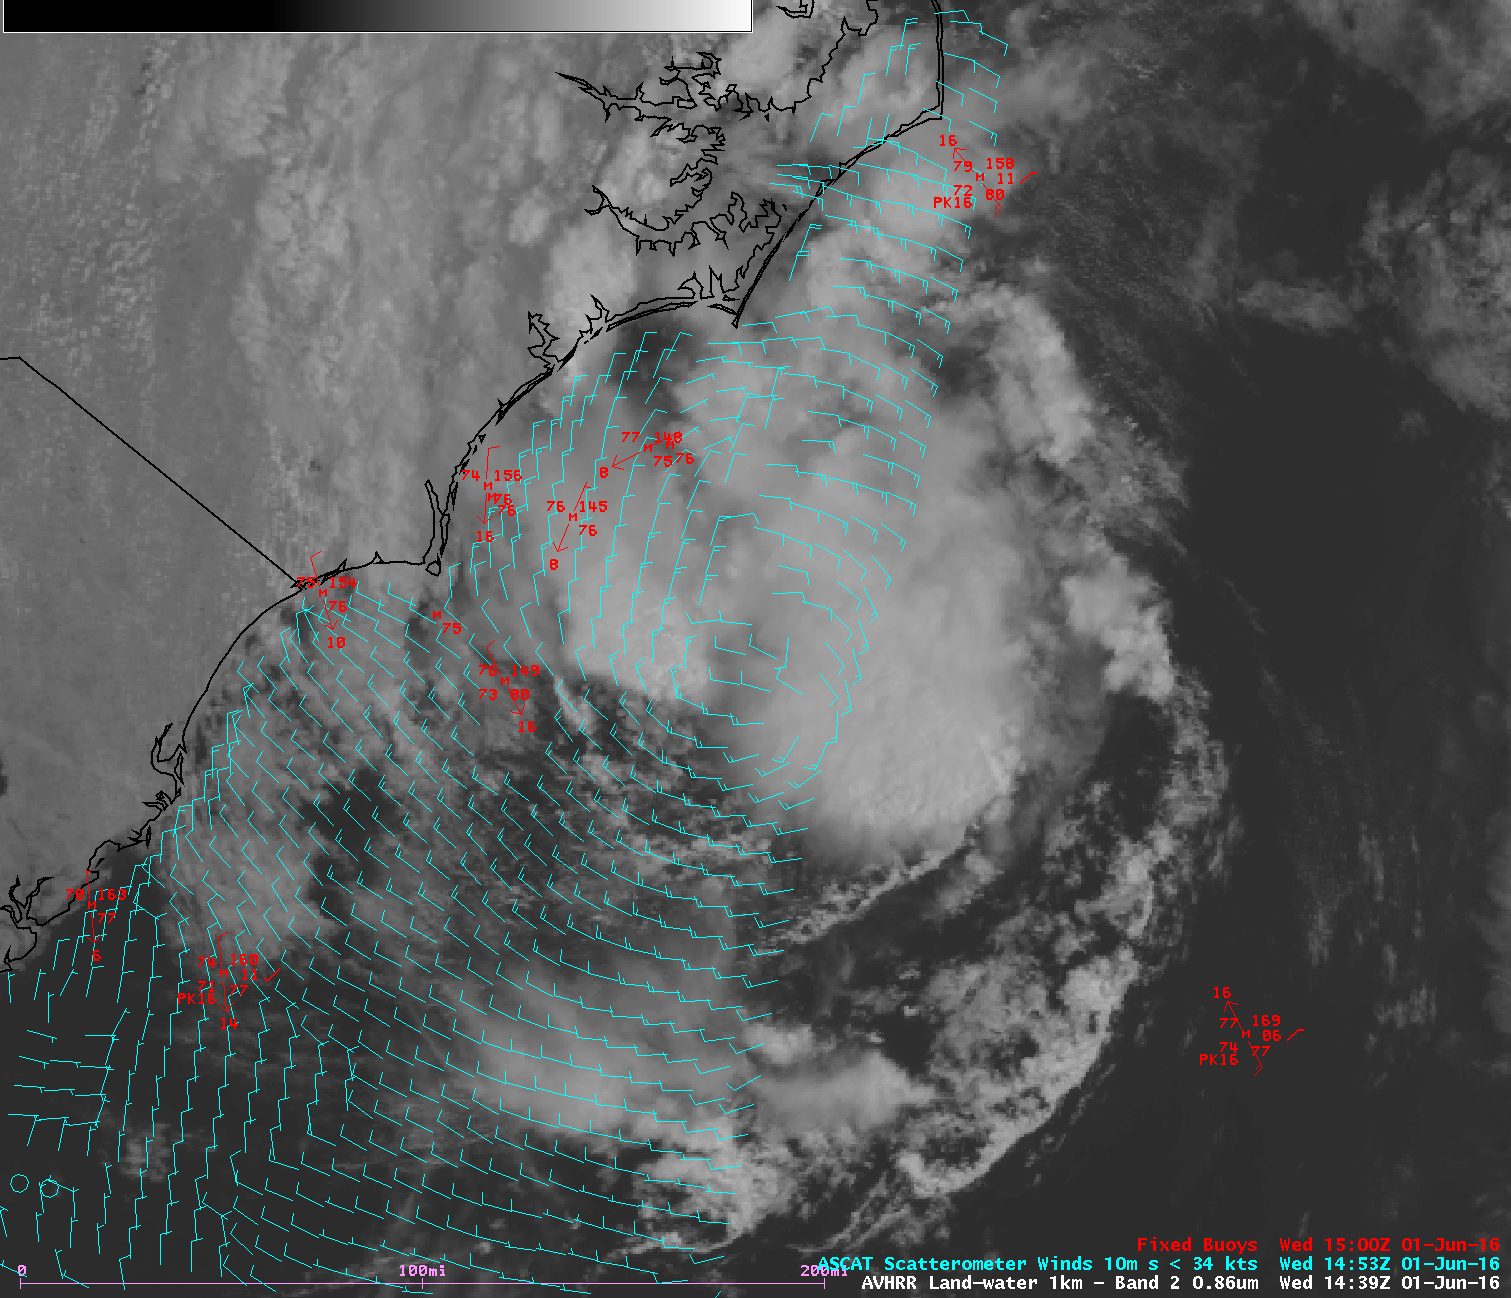
On the morning of 01 June, an overpass of the Metop-B ASCAT instrument sampled the flow around the low-level circulation center (LLCC) off the coast of North Carolina; several hours later, Suomi NPP VIIRS Visible (0.64 µm) and Infrared Window (11.45 µm) images provided a high-resolution view of the system at 1755 UTC (below). Cloud-top IR brightness temperatures were as cold as -78º C within the small convective cluster located just north of the LLCC.
![Suomi NPP VIIRS Visible (0.64 µm) and Infrared Window (11.45 µm) images [click to enlarge]](https://cimss.ssec.wisc.edu/satellite-blog/wp-content/uploads/sites/5/2016/06/160601_1752utc_viirs_visible_infrared_Bonnie_remnants_anim.gif)
Suomi NPP VIIRS Visible (0.64 µm) and Infrared Window (11.45 µm) images [click to enlarge]