This website works best with a newer web browser such as Chrome, Firefox, Safari or Microsoft Edge. Internet Explorer is not supported by this website.

Arctic low north of Alaska, and its effect on ice in the Beaufort Sea

A sequence of Suomi-NPP VIIRS Visible (0.64) images (above) displayed the cyclonically-curved cloud structure associated with an Arctic low pressure system (surface analyses) located between Alaska and the North Pole on 14 April 2024. A blend of Atmospheric Motion Vectors derived from NOAA-20 and NOAA-21 (below) showed the flow pattern at... Read More

Suomi-NPP VIIRS Visible (0.64 µm) images, from 2333 UTC on 13 April to 2132 UTC on 14 April [click to play animated GIF | MP4]

A sequence of Suomi-NPP VIIRS Visible (0.64) images (above) displayed the cyclonically-curved cloud structure associated with an Arctic low pressure system (surface analyses) located between Alaska and the North Pole on 14 April 2024. A blend of Atmospheric Motion Vectors derived from NOAA-20 and NOAA-21 (below) showed the flow pattern at various altitudes around this Arctic low. Real-time polar winds derived from a variety of satellites are available here.

NOAA-20 and NOAA-21 Infrared images with plots of blended Atmospheric Motion Vectors derived from both satellites, from 2229 UTC on 13 April to 1936 UTC on 14 April (credit: Rich Dworak, CIMSS) [click to play animated GIF | MP4]

The pressure gradient along the southern edge of this low was responsible for strong west-southwest winds across parts of Alaska’s North Slope — for example, a plot of surface report data from Utqiagvik (Barrow, station identifier PABR) showed wind gusts of 20-24 knots, with intermittent reductions in visibility due to blowing snow (below).

Plot of surface report data from Utqiagvik (Barrow) [click to enlarge]

A closer view of Suomi-NPP VIIRS Visible images centered over the Beaufort Sea (below) showed the effect of these strong westerly winds on the deformation of numerous ice leads off the north coast of Alaska. In addition, narrow cloud streets highlighted areas where blowing snow was likely occurring over the sea ice.

Suomi-NPP VIIRS Visible (0.64 µm) images, from 1459 UTC to 2132 UTC on 14 April [click to play animated GIF | MP4]


Suomi-NPP VIIRS Sea Ice Thickness and Sea Ice Temperature derived products at 0000 UTC on 15 April [click to enlarge]

A toggle between Suomi-NPP VIIRS Sea Ice Thickness and Sea Ice Temperature derived products at 0000 UTC on 15 April — displayed using RealEarth — is shown above. Probing these two products indicated values of 3.3 m and 257.3 K, respectively (below).

Probed values of Suomi-NPP VIIRS Sea Ice Thickness and Sea Ice Temperature derived products at 0000 UTC on 15 April [click to enlarge]

Daily composite images of the Sea Ice Temperature, Sea Ice Thickness and Sea Ice Age derived products from NOAA-20, NOAA-21 and Suomi-NPP (source) on 14 April are shown below.

Daily composite images of the Sea Ice Temperature, Sea Ice Thickness and Sea Ice Age derived products from NOAA-20, NOAA-21 and Suomi-NPP on 14 April [click to play animated GIF | MP4]

View only this post Read Less

Severe weather over Niihau (and flooding on Kauai) in the Hawai’ian Islands

he NWS Forecast Office in Honolulu late on Thursday (8:33 PM local time 11 April, or 0633 UTC on 12 April) issued a Severe Thunderstorm warning for the island of Niihau to the southwest of Kauai. Subsequently, flood warnings were issued for Kauai. The animation above (from the southwest corner of the GOES-18 PACUS domain) shows the... Read More

GOES-18 Day Cloud Phase Distinction and then Band 13 Clean Window Infrared (10.3 µm) along with LightningCast probability fields and GLM Flash Extent Density, 2246 UTC on 11 April to 0701 UTC on 12 April 2024; the transition from Day Cloud Phase Distinction to Band 13 occurs at 0401 UTC. (Click to enlarge)

he NWS Forecast Office in Honolulu late on Thursday (8:33 PM local time 11 April, or 0633 UTC on 12 April) issued a Severe Thunderstorm warning for the island of Niihau to the southwest of Kauai. Subsequently, flood warnings were issued for Kauai. The animation above (from the southwest corner of the GOES-18 PACUS domain) shows the development of the convection to the southwest of the Hawai’ian Islands that intensified as it approached Niihau and Kauai. Note especially the increase in FED that occurred after 0616 UTC just east of Niiahu, as shown below in an animation that steps more slowly from 0621 to 0636 UTC, overlapping the time of warning issuance. Peak FED occurs at 0636 UTC (87), having ramped up from 19 at 0606 UTC!

GOES-18 13 Clean Window Infrared (10.3 µm) along with LightningCast probability fields and GLM Flash Extent Density, 0601 UTC to 0701 UTC on 12 April 2024 (Click to enlarge)

The thunderstorms accompanied a significant moistening of the atmosphere as depicted below by MIMIC Total Precipitable water fields. Deep moisture moved northward through the western Hawai’ian islands; the moisture was drawn northward by a strong storm northwest of the main Hawai’ian Islands readily apparent as the cyclonic swirl in the TPW fields.

MIMIC Total Precipitable Water, 1300 UTC on 11 April to 1200 UTC on 12 April 2024 (Click to enlarge)

The moistening is also apparent in the soundings from Lihue on the island of Kauai, shown below. Total Precipitable Water jumps from 1.3 to 1.7″ in the 12 hours shown; note also how the low-level winds become more favorable for severe weather with the increase of low-level southeasterlies.

Radiosonde from PHLI (Lihue on the island of Kauai) at 1200 UTC 11 April and 0000 UTC on 12 April 2024 (Click to enlarge)

Microwave estimates of Rain Rate computed from Direct Broadcast data in Honolulu (at this site), shows the significant increase in rain rates after 0700 UTC, with heavy rain diagnosed over Kauai!

MIRS Rain Rates, 0024 to 1228 UTC on 12 April 2024 (Click to enlarge)

MetopC overflew the Hawai’ian islands at around 0750 UTC (Rain Rate from that overpass is in the animation above); NUCAPS profiles from MetopC are now in AWIPS, complementing the fields from NOAA-20 (and soon (sometime after 1 May), NOAA-21) that occur closer to 00/12 UTC. The Total Totals index from those profiles, below, shows considerably instability to the southwest of the Hawai’ian Islands. Although this pass was too late for the Severe Weather warning issuance, information in the profiles can be used to ascertain how the convection might evolve in the near future.

Total totals index from MetopC NUCAPS profiles, and Sounding Availability Plots, ca. 0750 UTC on 12 April 2024 (Click to enlarge)

The rain over the island of Kauai was very heavy, as might be expected given the MIMIC TPW fields and the snapshot views of Rain Rate shown above. Rainfall totals are discussed here.


An interesting question was posed at the online Honolulu forecast office weather briefing on Friday: Does the 0000 UTC Sounding at Lihue (shown above in a toggle, and also here) have an Elevated Mixed Layer (EML)? The very steep lapse rate between about 720 and 600 mb and the nearly constant moisture content are both consistent with the presence of an EML. The GOES-18 Band 10 infrared imagery (7.34 µm, the ‘low-level’ water vapor band), below, is also suggestive of an EML; in the color enhancement used, deep reds are often associated with EMLs. Convection over Niihau and Kauai develops along the leading edge of the warm region in the water vapor imagery. The Band 10 weighting function, at bottom (from this website), shows a peak contribution in Band 10 (drawn in dark magenta) from about 620 mb, in the middle of the steep lapse rate shown at Lihue at the same time.

GOES-18 Low-level water vapor infrared imagery (Band 10, 7.34 µm), hourly from 0000 to 0700 UTC on 12 April 2024 (Click to enlarge)
0000 UTC Weighting Function for GOES-18 bands 8 (brown), 9 (cyan) and 10 (dark magenta) at 20 N, 165 W (the blue dot on the globe) computed from GFS data.

View only this post Read Less

Satellite signatures of the SpaceX USSF-68 Mission launch

1-minute Mesoscale Domain Sector GOES-18 (GOES-West) images from all 16 of the ABI spectral bands — in addition to a Rocket Plume RGB (above) displayed signatures of the SpaceX USSF-62 Mission (to deploy the new WSF-M satellite) Falcon 9 rocket that was launched from Vandenberg Space Force Base, California at 1425 UTC on 11 April 2024.... Read More

1-minute GOES-18 images of ABI spectral bands 01-16 and a Rocket Plume RGB, from 1424-1435 UTC on 11 April [click to play animated GIF | MP4]

1-minute Mesoscale Domain Sector GOES-18 (GOES-West) images from all 16 of the ABI spectral bands — in addition to a Rocket Plume RGB (above) displayed signatures of the SpaceX USSF-62 Mission (to deploy the new WSF-M satellite) Falcon 9 rocket that was launched from Vandenberg Space Force Base, California at 1425 UTC on 11 April 2024. A warm thermal signature of the Stage 1 rocket booster was evident in images from all of the Near-Infrared and Infrared spectral bands (Bands 03-16) and the RGB imagery as it quickly moved east-northward from the launch site — and either a somewhat-bright reflectance signature or a relatively cool thermal signature of the Stage 1 rocket booster’s condensation cloud was seen in most of the spectral bands as it drifted slowly eastward from the launch site (evaporating quickly in the dry atmosphere).

In addition, a warm thermal signature of the Stage 1 rocket re-entry burn was apparent at 1431 UTC (just northeast of Vandenberg KVBG) to begin slowing its descent in order to make a landing back at Vandenberg.

One interesting aspect seen in Upper-level Water Vapor (Band 08) and Rocket Plume RGB images after Stage 2 rocket booster ignition (which occurred around 1427 UTC — at that time, the peak 3.9 µm infrared brightness temperature reached 71.81ºC — was the rapid southward expansion of the water-vapor-rich rocket plume. A plot of rawinsonde data from Vandenberg, California (below) showed that the high-altitude transition to general northerly flow began at altitudes of 20-30 km (the 40 hPa pressure level and above).

Plot of rawinsonde data from Vandenberg, California at 1200 UTC on 11 April [click to enlarge]

With GOES-16 (GOES-East) images (below), although the satellite viewing angle was larger (62.34 degrees, vs 43.82 degrees for GOES-18), similar rocket signatures were observed in many of the ABI spectral bands and the RGB — albeit displaced to the west, due to parallax associated with the high-altitude features.

5-minute GOES-16 images of ABI spectral bands 01-16 and a Rocket Plume RGB, from 1421-1431 UTC on 11 April [click to play animated GIF | MP4]

View only this post Read Less

Severe thunderstorms across parts of Texas, Louisiana Mississippi and Alabama — with heavy rainfall and tornadoes in southern Louisiana

30-second (ending at 1200 UTC) and 1-minute Mesoscale Domain Sector GOES-16 “Clean” Infrared Window (10.3 µm) images (above) included plots of time-matched (within +/- 3 minutes) plots of SPC Storm Reports (09 April | 10 April) across parts of Texas, Louisiana, Mississippi and Alabama on 10 April 2024. The corresponding 1-minute GOES-16 “Red” Visible (0.64 µm) images after... Read More

30-second (ending at 1200 UTC) and 1-minute GOES-16 “Clean” Infrared Window (10.3 µm) images from 1020-1725 UTC on 10 April, with time-matched (within +/- 3 minutes) SPC Storm Reports plotted in cyan [click to play animated GIF | MP4]

30-second (ending at 1200 UTC) and 1-minute Mesoscale Domain Sector GOES-16 “Clean” Infrared Window (10.3 µm) images (above) included plots of time-matched (within +/- 3 minutes) plots of SPC Storm Reports (09 April | 10 April) across parts of Texas, Louisiana, Mississippi and Alabama on 10 April 2024. The corresponding 1-minute GOES-16 “Red” Visible (0.64 µm) images after sunrise are shown below.

1-minute GOES-16 “Red” Visible (0.64 µm) images from 1201-1725 UTC on 10 April, with time-matched (within +/- 3 minutes) SPC Storm Reports plotted in red [click to play animated GIF | MP4]

One notable event that occurred during this period was heavy rainfall which produced flooding in the New Orleans, Louisiana area — 1-minute GOES-16 Infrared images (below) showed the clusters of thunderstorms responsible for precipitation accumulations that exceeded 1.0-2.0 inches per hour at times.

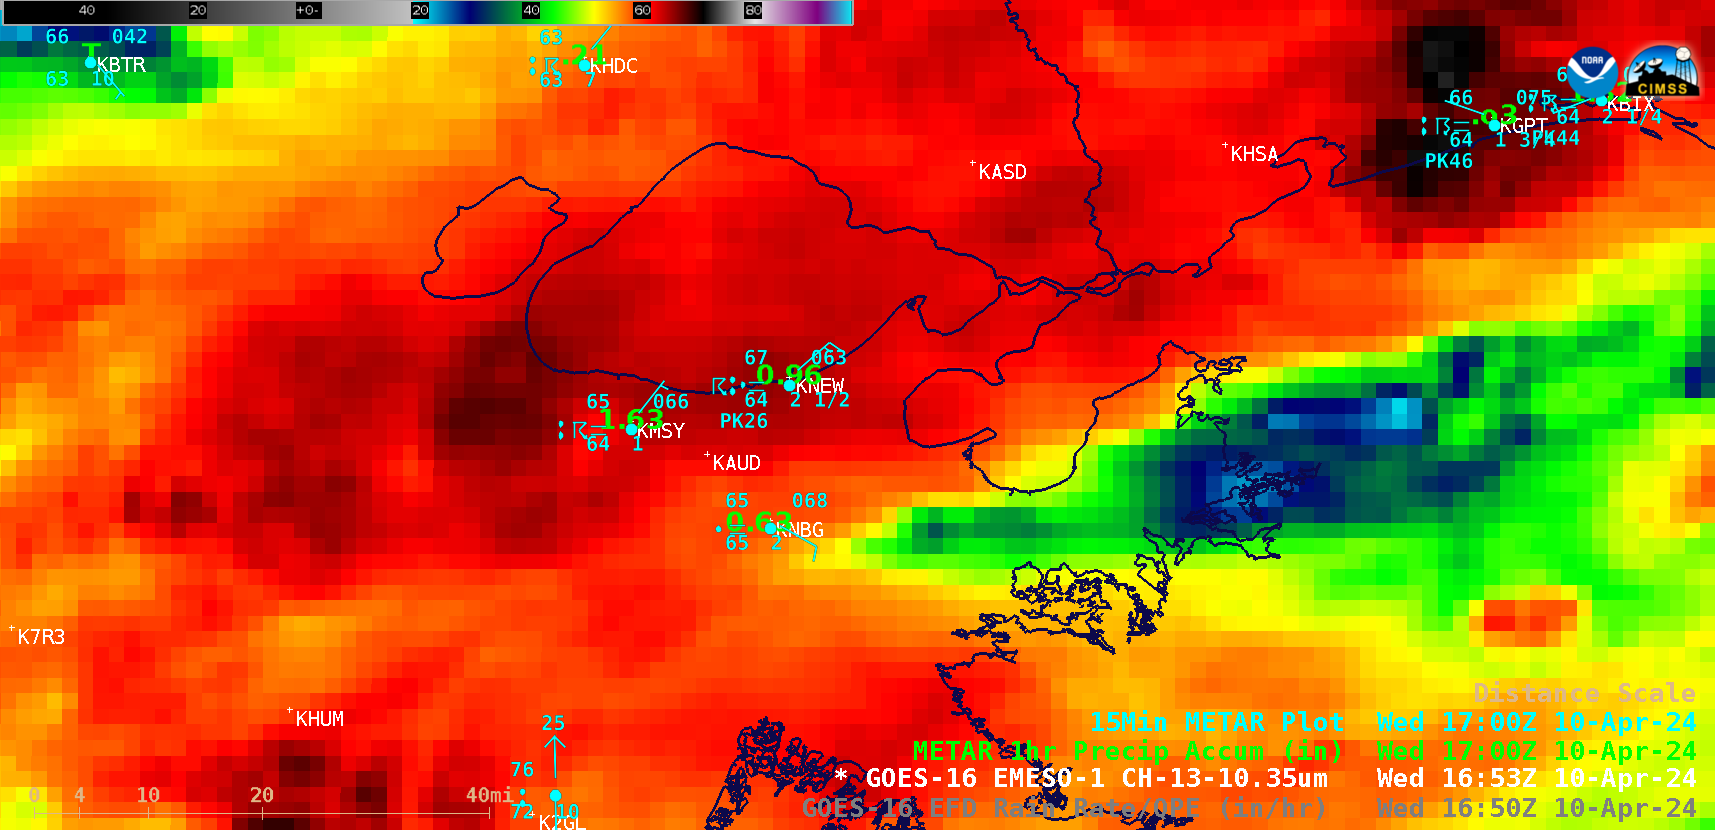
1-minute GOES-16 (10.3 µm) Infrared images from 1200-1900 UTC on 10 April, with plots of 15-minute METAR surface reports (cyan) and 1-hour precipitation accumulation (green) [click to play animated GIF | MP4]

A cursor sample of the GOES-16 cloud-top 10.3 µm infrared brightness temperature at 1250 UTC (below) displayed a corresponding GOES-16 Rain Rate of 2.16 in/hr (below).

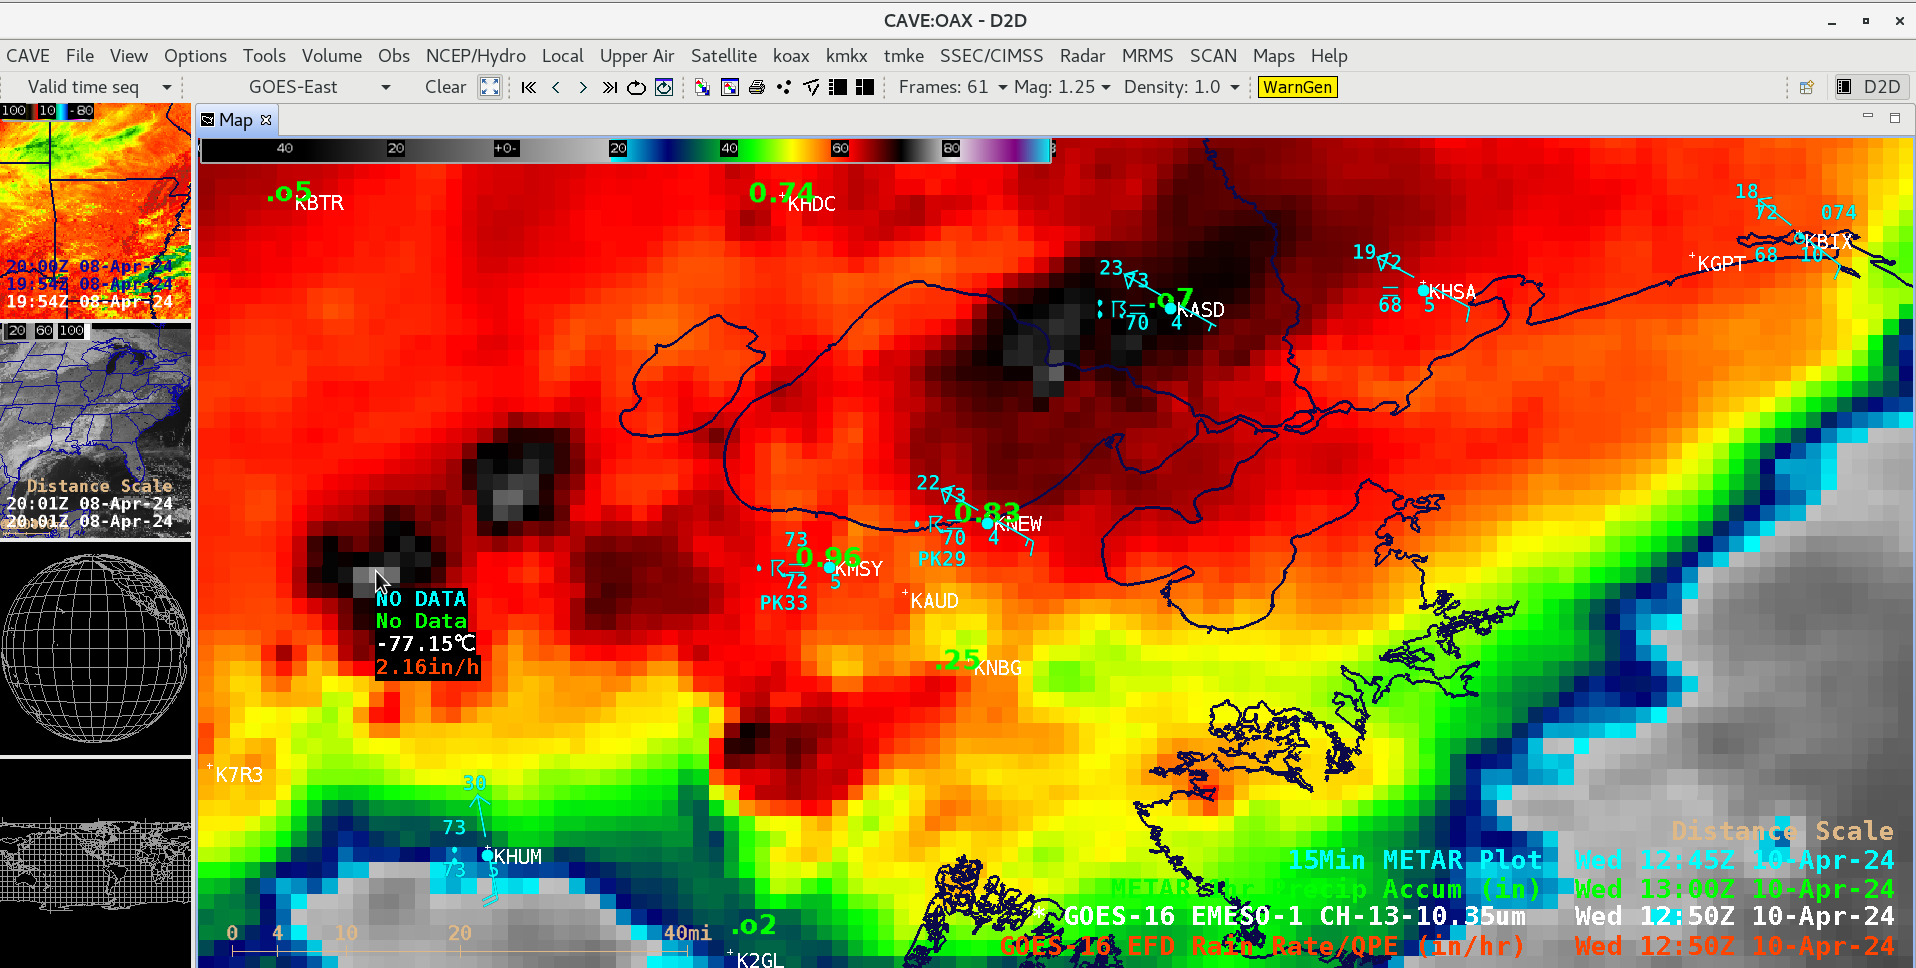
Cursor sample of the 1250 UTC GOES-16 cloud-top 10.3 µm infrared brightness temperature (white) along with the corresponding GOES-16 Rain Rate derived product (red) [click to enlarge]

Just prior to sunrise in southwest Louisiana, another notable event was a convective line that produced EF1/EF2-rated tornadoes in the Lake Charles area — overlapping 1-minute Mesoscale Domain Sectors provided GOES-16 Infrared images at 30-second intervals (below), which showed the pulses of cold overshooting tops associated with these thunderstorms. This event is also discussed from a hyperspectral model perspective in this blog post.

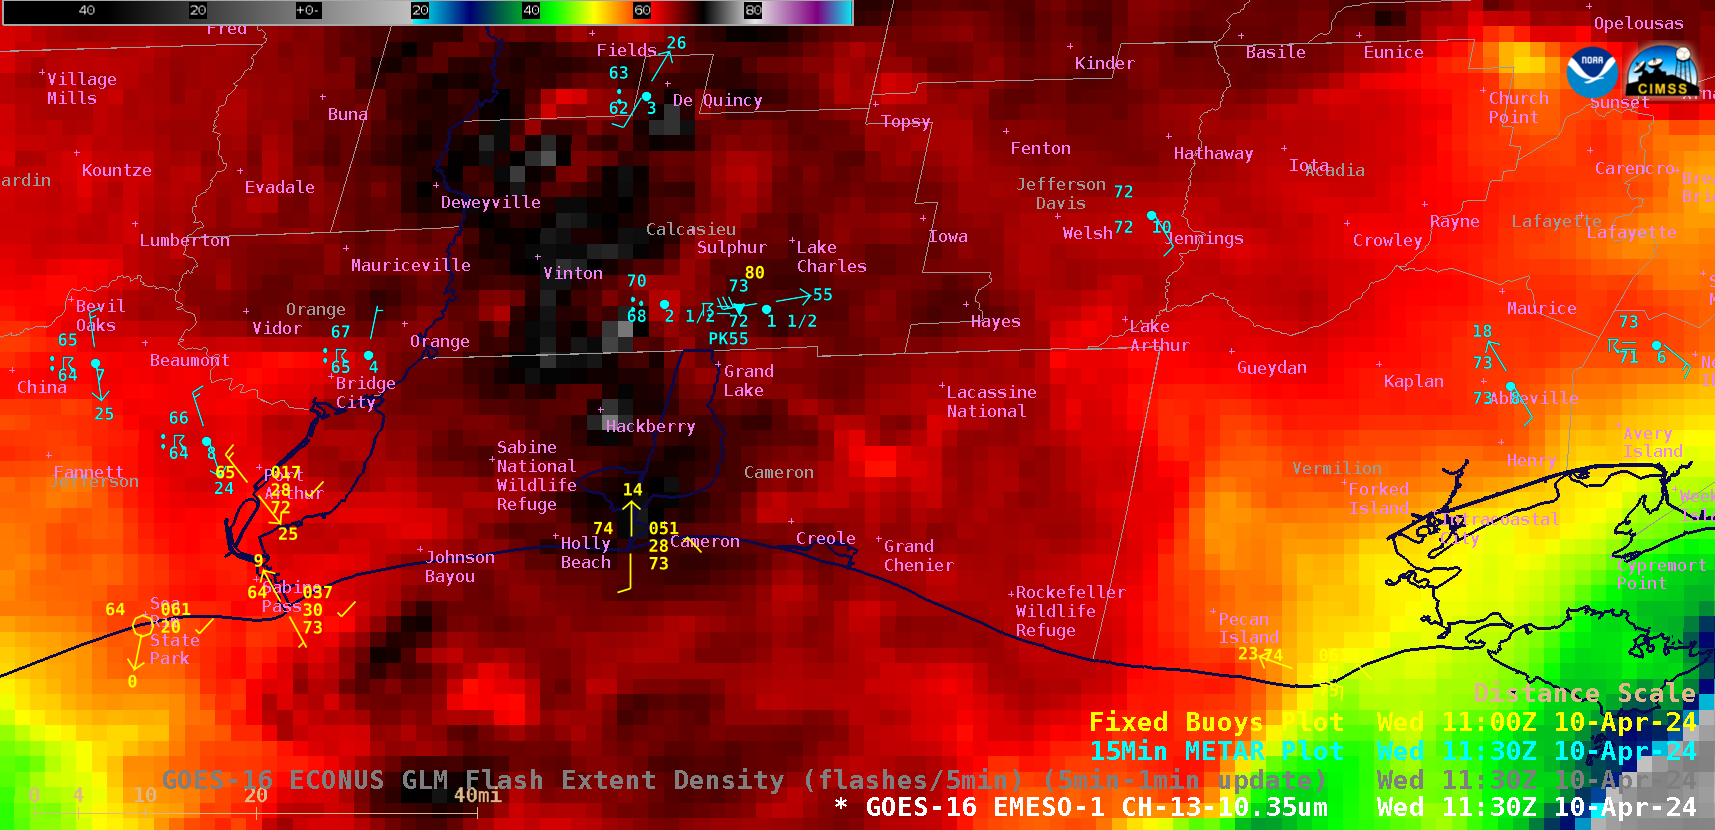
30-second GOES-16 Infrared (10.3 µm) images from 1100-1200 UTC on 10 April, with plots of 15-minute METAR surface reports (cyan) and hourly fixed buoy reports (yellow) [click to play animated GIF | MP4]

A cursor sample of 1126 UTC GOES-16 cloud-top 10.3 µm infrared brightness temperature (below) displayed a corresponding GOES-16 Cloud Top Temperature of -76.11ºC and a Cloud Top Height of 42974.84 ft.

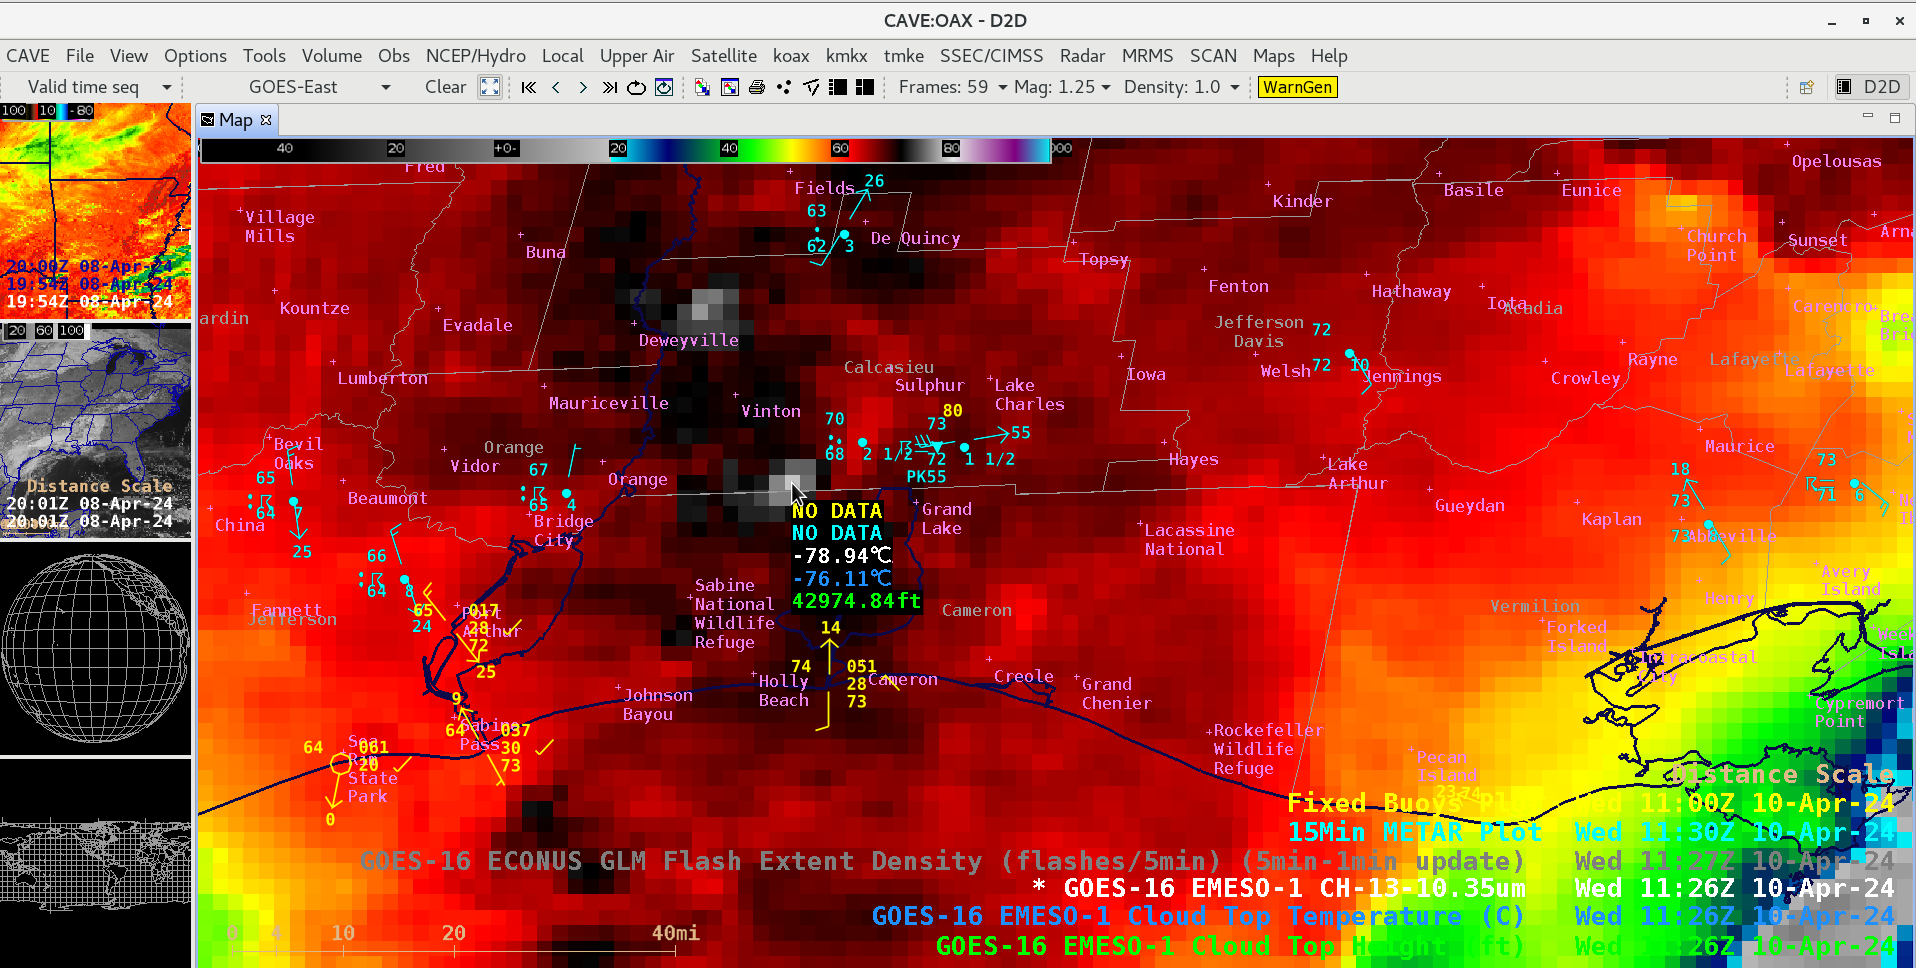
Cursor sample of 1126 UTC GOES-16 cloud-top 10.3 µm infrared brightness temperature (white) along with the corresponding GOES-16 Cloud Top Temperature (blue) and Cloud Top Height (green) derived products [click to enlarge]

30-second GOES-16 Infrared images with an overlay of GLM Flash Extent Density (below) revealed a notable amount of lighting actvity associated with this tornado-producing line of thundertorms.

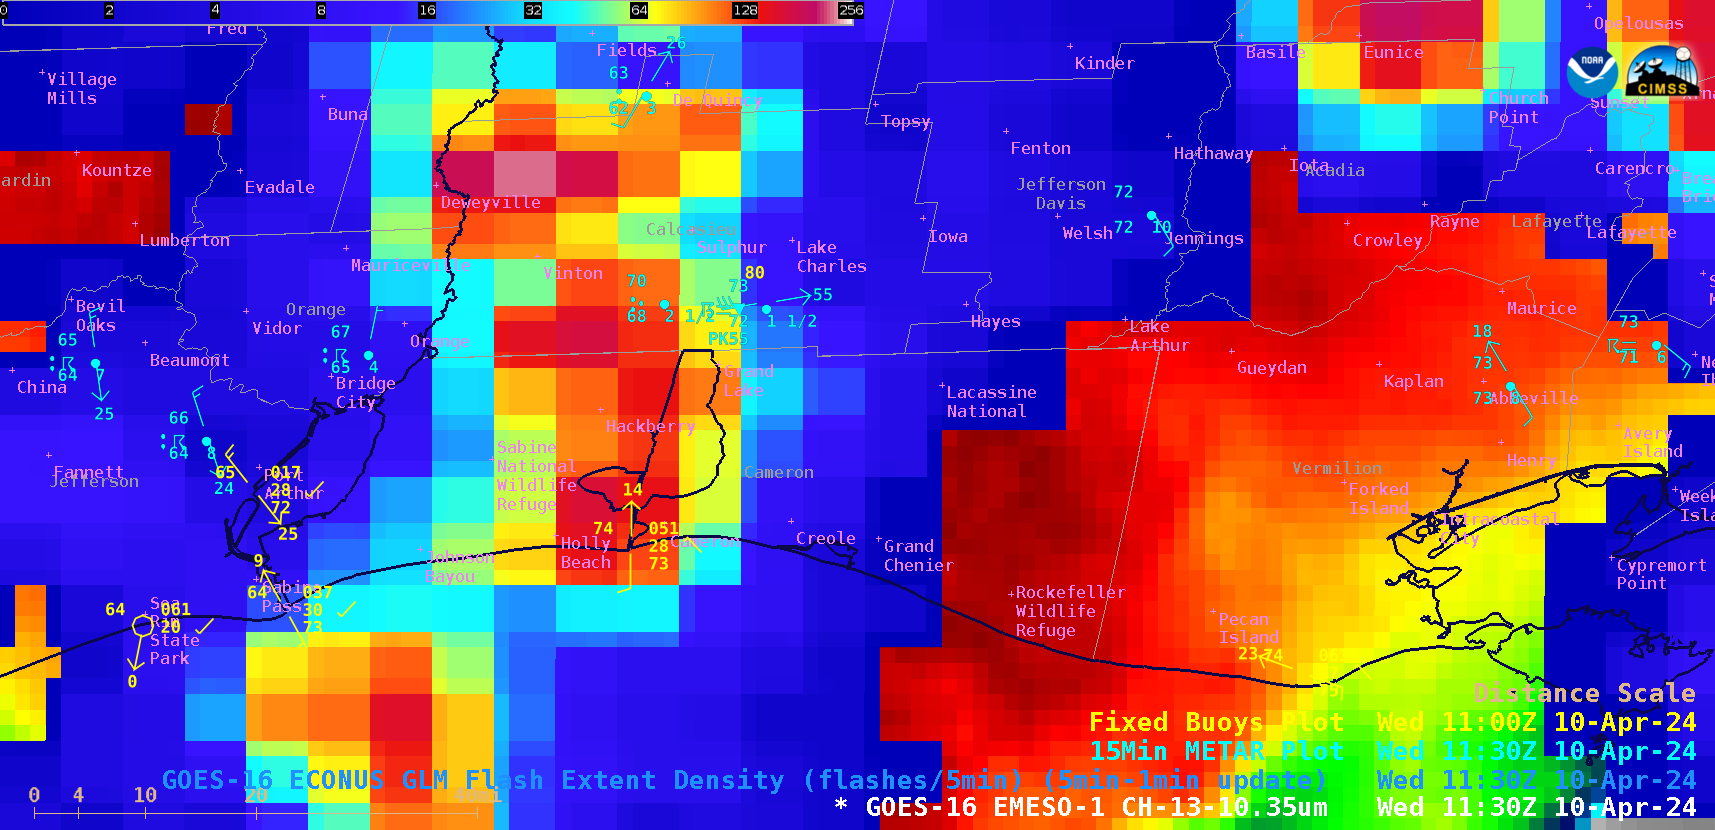
30-second GOES-16 Infrared (10.3 µm) images with an overlay of GLM Flash Extent Density from 1100-1200 UTC on 10 April, including plots of 15-minute METAR surface reports (cyan) and hourly fixed buoy reports (yellow) [click to play animated GIF | MP4]

View only this post Read Less