
Snow is widespread today from central Pennsylvania northward into central New York. Accumulating snow only rarely falls this early in the season in that part of the country, and at many stations this is the earliest measurable snow on record. The above image is an enhanced 11-micron image from GOES-12 with surface observations (in white) and buoy observations (in black) superimposed. (Click image to enlarge)
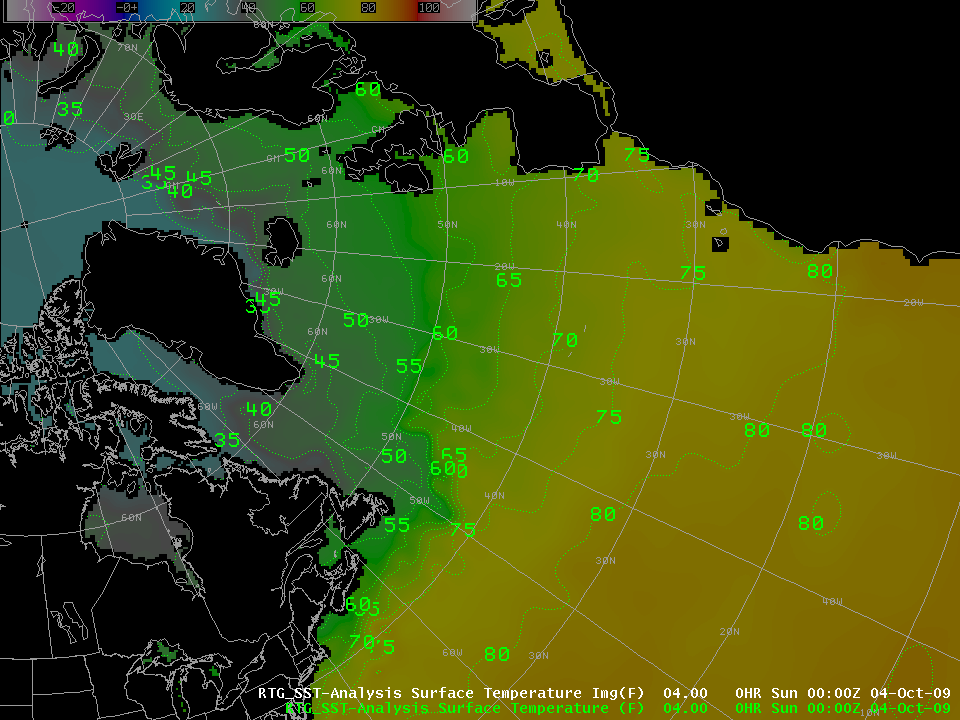
One reason for snow’s rarity can be viewed in the sea surface temperatures plotted in black — ocean surface temperatures are still in the low 60s off the coast of New Jersey. That source of relative warmth can have a powerful effect if the wind is from the east, and it can be fatal to a snowfall.
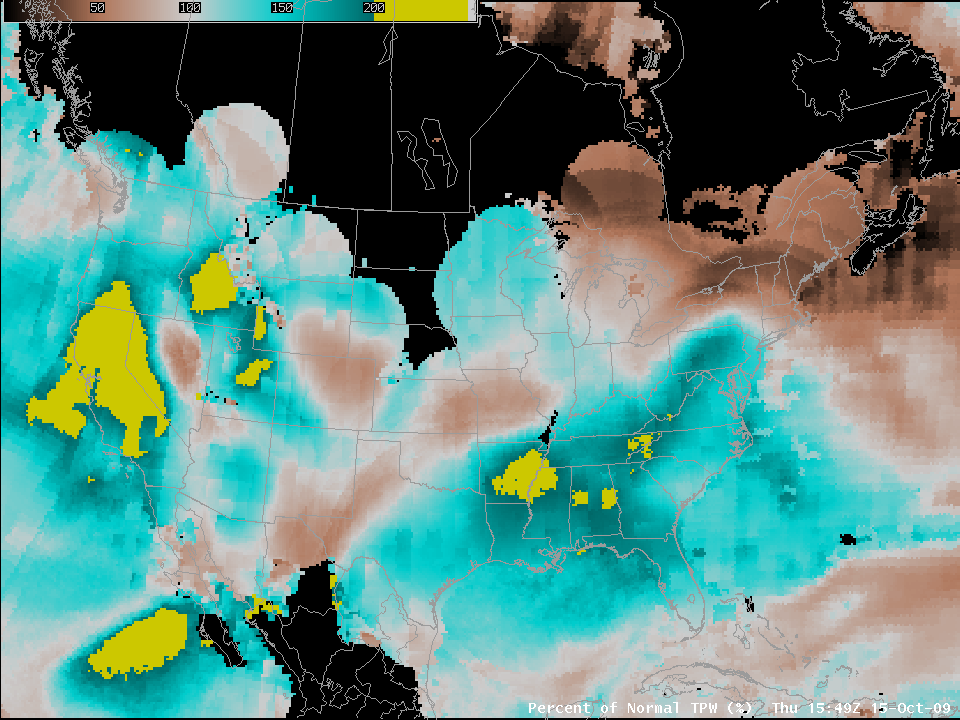
Much of the moisture from this storm, however, is not coming from the east, but from the west and southwest, as suggested in this plot of total precipitable water — plotted as a percentage of normal — derived from AMSU and SSM/I instruments on the NOAA polar orbiters. (See image here; note the axis of high percentages along the spine of the Appalachians).
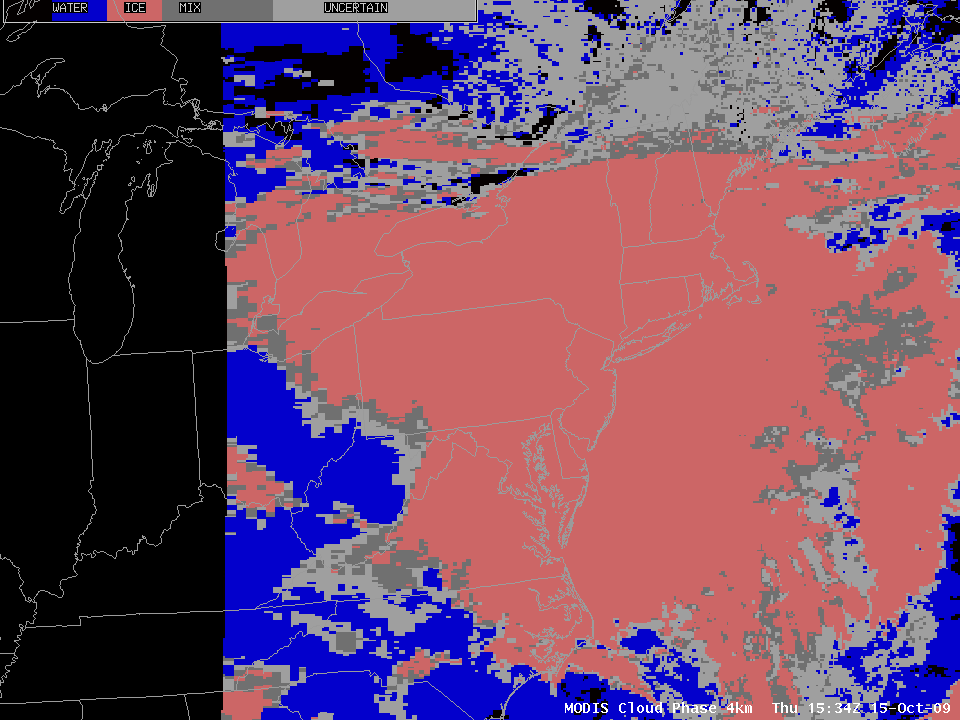
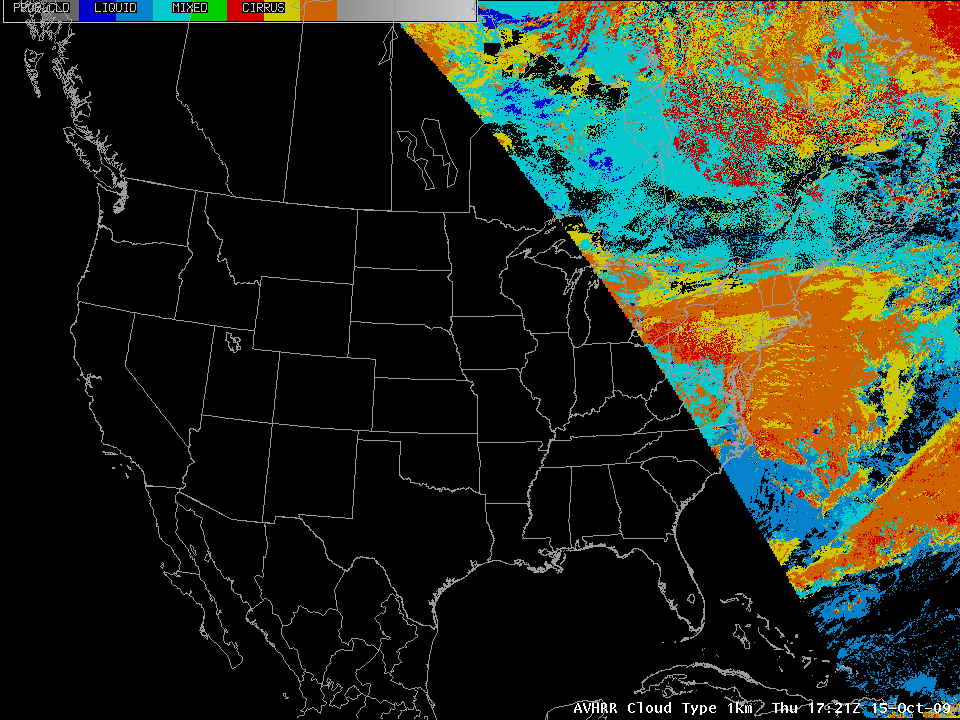
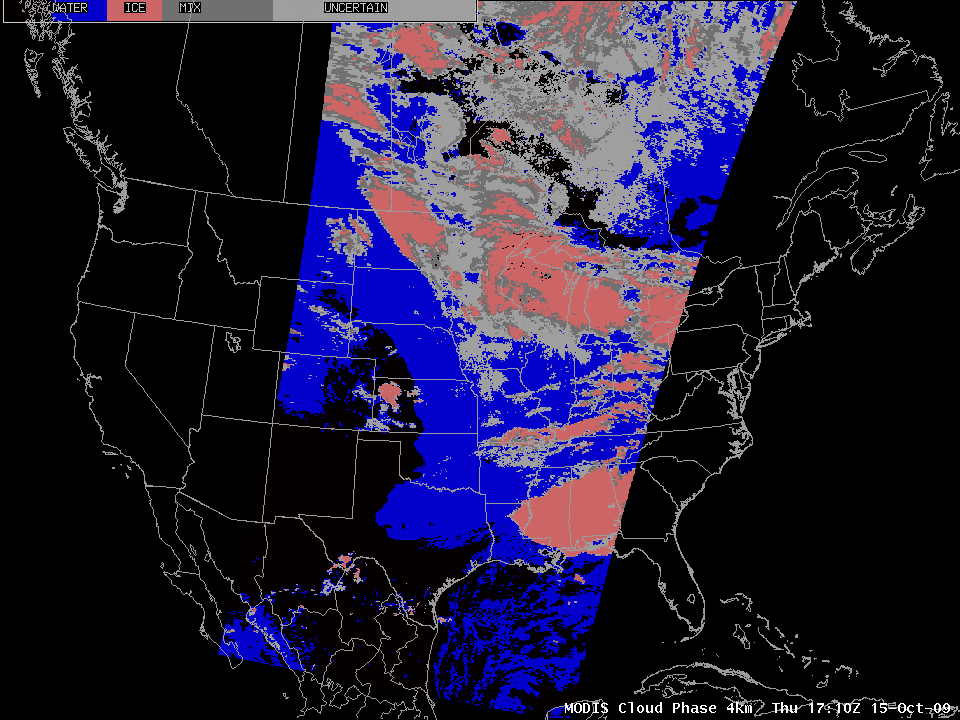
A vital feature for the production of snow is the presence of ice crystals within a mixed-phase cloud. When that happens, the Bergeron-Findeisen process allows ice crystals to grow at the expense of water droplets, and these ice crystals can then fall towards the surface, either maintaining their integrity as snow all the way down or melting to rain drops. If ice crystals are not present, cloud droplets will grow via Collision and Coalescence, and a drizzle or light rain is more likely. Cloud types derived from different channels on MODIS (image here, valid at 1534 UTC on 15 October) and from AVHRR (image here, valid at 1721 UTC 15 October). Both images suggest that the presence of ice crystals for the seeder-feeder mechanism might be limited if winds at cloud level are westerly. Should that happen, the snow of this afternoon would become light rain or drizzle tonight. MODIS cloud phase from 1710 UTC of 15 October, however, which has a swath farther to the west, does show more ice clouds upstream of Pennsylvania and New York, an observation that suggests snow may continue, if surface and near-surface temperatures remain cool enough.
(Updated, 16 October: Some snow totals as of 1200 UTC 16 October: 4.7″ in State College, 3.2″ in Philipsburg, 2.4″ in Altoona, 5.9″ in Wellsboro)
View only this post Read Less


