
GOES-12 0.65 µm vs GOES-13 0.63 µm visible images
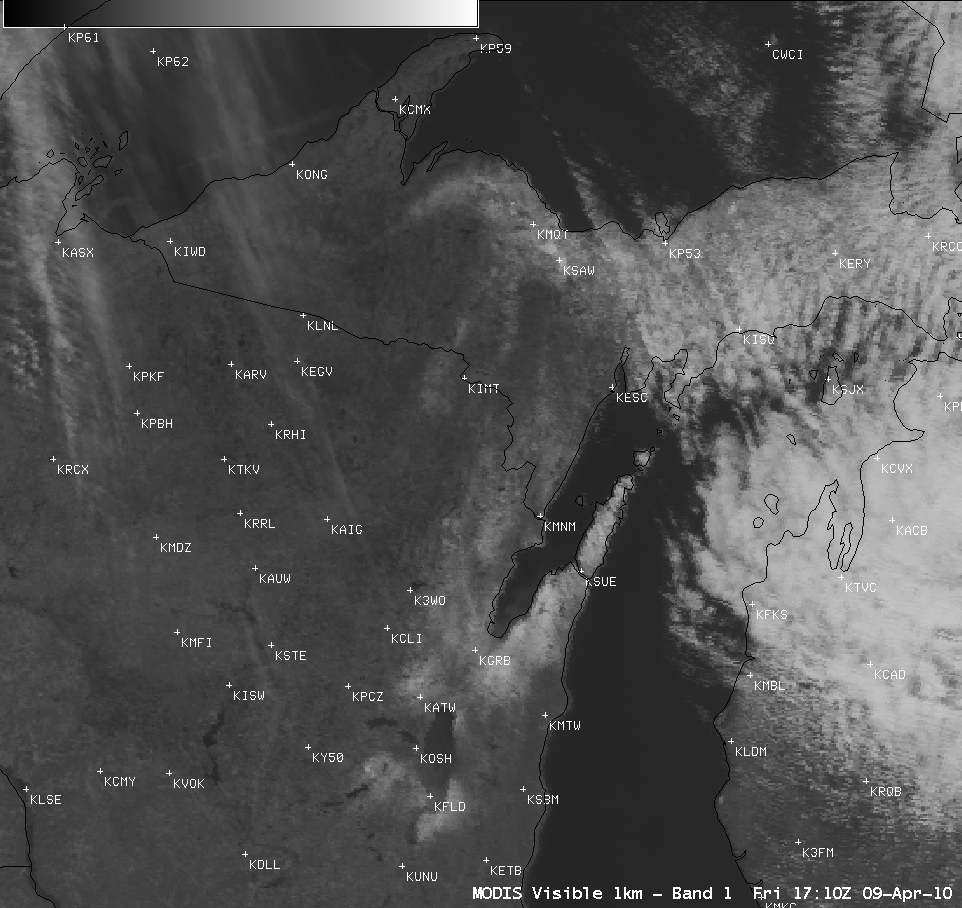
As of 18:34 UTC on 14 April 2010, GOES-13 (launched May 2006, with a Post Launch Test in December 2006) replaced GOES-12 (launched July 2001) as the operational GOES-East satellite — for more information, see the NOAA NESDIS Satellite Services Division. A sequence of AWIPS images (above) shows the last three GOES-12 visible images followed by the first three GOES-13 visible images centered over the Upper Midwest region of the US during the satellite transition period. Both the GOES-12 and the GOES-13 visible images are enhanced using the “Linear” AWIPS enhancement (see below for more details).
Note that areas of dense vegetation (for example, over river valleys, and also across much of southern Indiana) appear slightly darker on the GOES-13 visible channel images. This is due to the fact that the visible channel on the newer GOES series — GOES-13 and beyond — is a narrower channel (centered at 0.63 µm, vs 0.65 µm for the older GOES satellites) that misses the “brighter” portion of the grass/vegetation spectrum (green plot) that begins to increase rapidly at wavelengths higher than about 0.7 µm (below). You will also notice that the cloud features appear slightly brighter in the last three GOES-13 images — this is due to the fact that the GOES visible detector performance tends to degrade over time, so the visible images from the much older GOES-12 satellite appear slightly “washed out” in comparison.

GOES-12 vs GOES-13 visible channel spectral response function plots
Note to AWIPS users: because of the different characteristics of the GOES-13 visible channel, it is suggested that you change the default GOES visible image enhancement from “ZA” to “Linear” — as seen in a GOES-13 visible image comparison with those 2 enhancements (below), the GOES-13 imagery can appear too dark with the default “ZA” enhancement.

GOES-13 visible image: “ZA” enhancement vs “Linear” enhancement
======================================

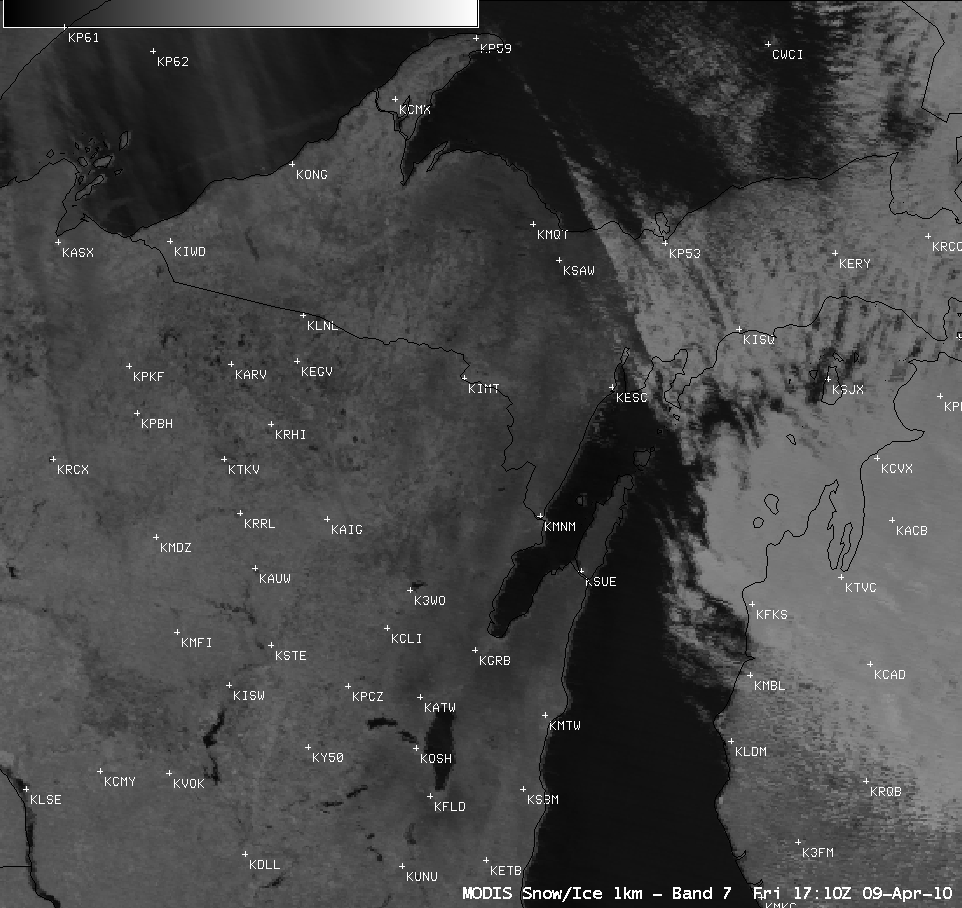
GOES-12 vs GOES-13 Sounder 4.5 µm shortwave IR images
There are also significant improvements in the quality of the GOES-13 Sounder data, due to the fact that GOES-12 had been experiencing filter wheel problems for quite some time. AWIPS comparisons of the last GOES-12 and the first GOES-13 Sounder 4.5 µm shortwave IR images (above) and 6.5 µm water vapor channel images (below) clearly demonstrate the dramatic reduction in noise — in these Sounder composite images, the western portion of the image is GOES-11 (GOES-West) data, while the eastern portion of the image is either GOES-12 or GOES-13 (GOES-East) data. In particular, the 6.5 µm water vapor image is “cleaner” on GOES-13 as a result of “colder” detectors on the newer spacecraft design, which more effectively radiate to space.

GOES-12 vs GOES-13 Sounder 6.5 µm water vapor channel images
View only this post Read Less
")

")
")
")

")
