 image")
Aqua MODIS Red/Green/Blue (RGB) image
The eruption of the Eyjafjallajokull volcano on southern Iceland continued on 19 April 2010 (in addition, see the previous CIMSS Satellite Blog entries published on 15 April and 21 March). A McIDAS Red/Green/Blue (RGB) image composite using Aqua MODIS channels 01/04/03 (above) revealed yet another large ash plume streaming southward over the North Atlantic Ocean. According to the London Volcanic Ash Advisory Center (VAAC), the ash from this latest eruption was generally confined to 10,000-15,000 feet and lower. With the volcanic ash plume drifting to the south, air traffic in the immediate vicinity of Reykjavik-Keflavik International Airport (station identifier BIKF) was not affected — and after a 5-day shut-down of air traffic across much of Europe, some airports there were finally beginning to allow limited flights to resume.
The corresponding volcanic ash retrieval products (below, courtesy of Mike Pavolonis, NOAA/NESDIS/STAR/CoRP/ASPB) indicated that the total ash loading was 75.82 kilotons, the maximum ash height was 7.37 km, and the mean ash particle effective radius was 3.51 micrometers. Note that these volcanic ash retrieval products are available in near-realtime at this NOAA/NESDIS/STAR/CIMSS site.

MODIS volcanic ash retrieval products
In addition to MODIS instruments on Terra and Aqua, the AVHRR instrument on the NOAA polar orbiters can give information on the state of the eruption. NOAA-19 passed over Iceland at 04:08 UTC 19 April, and NOAA-16 passed over at 09:16 UTC 19 April. What do the two views suggest?
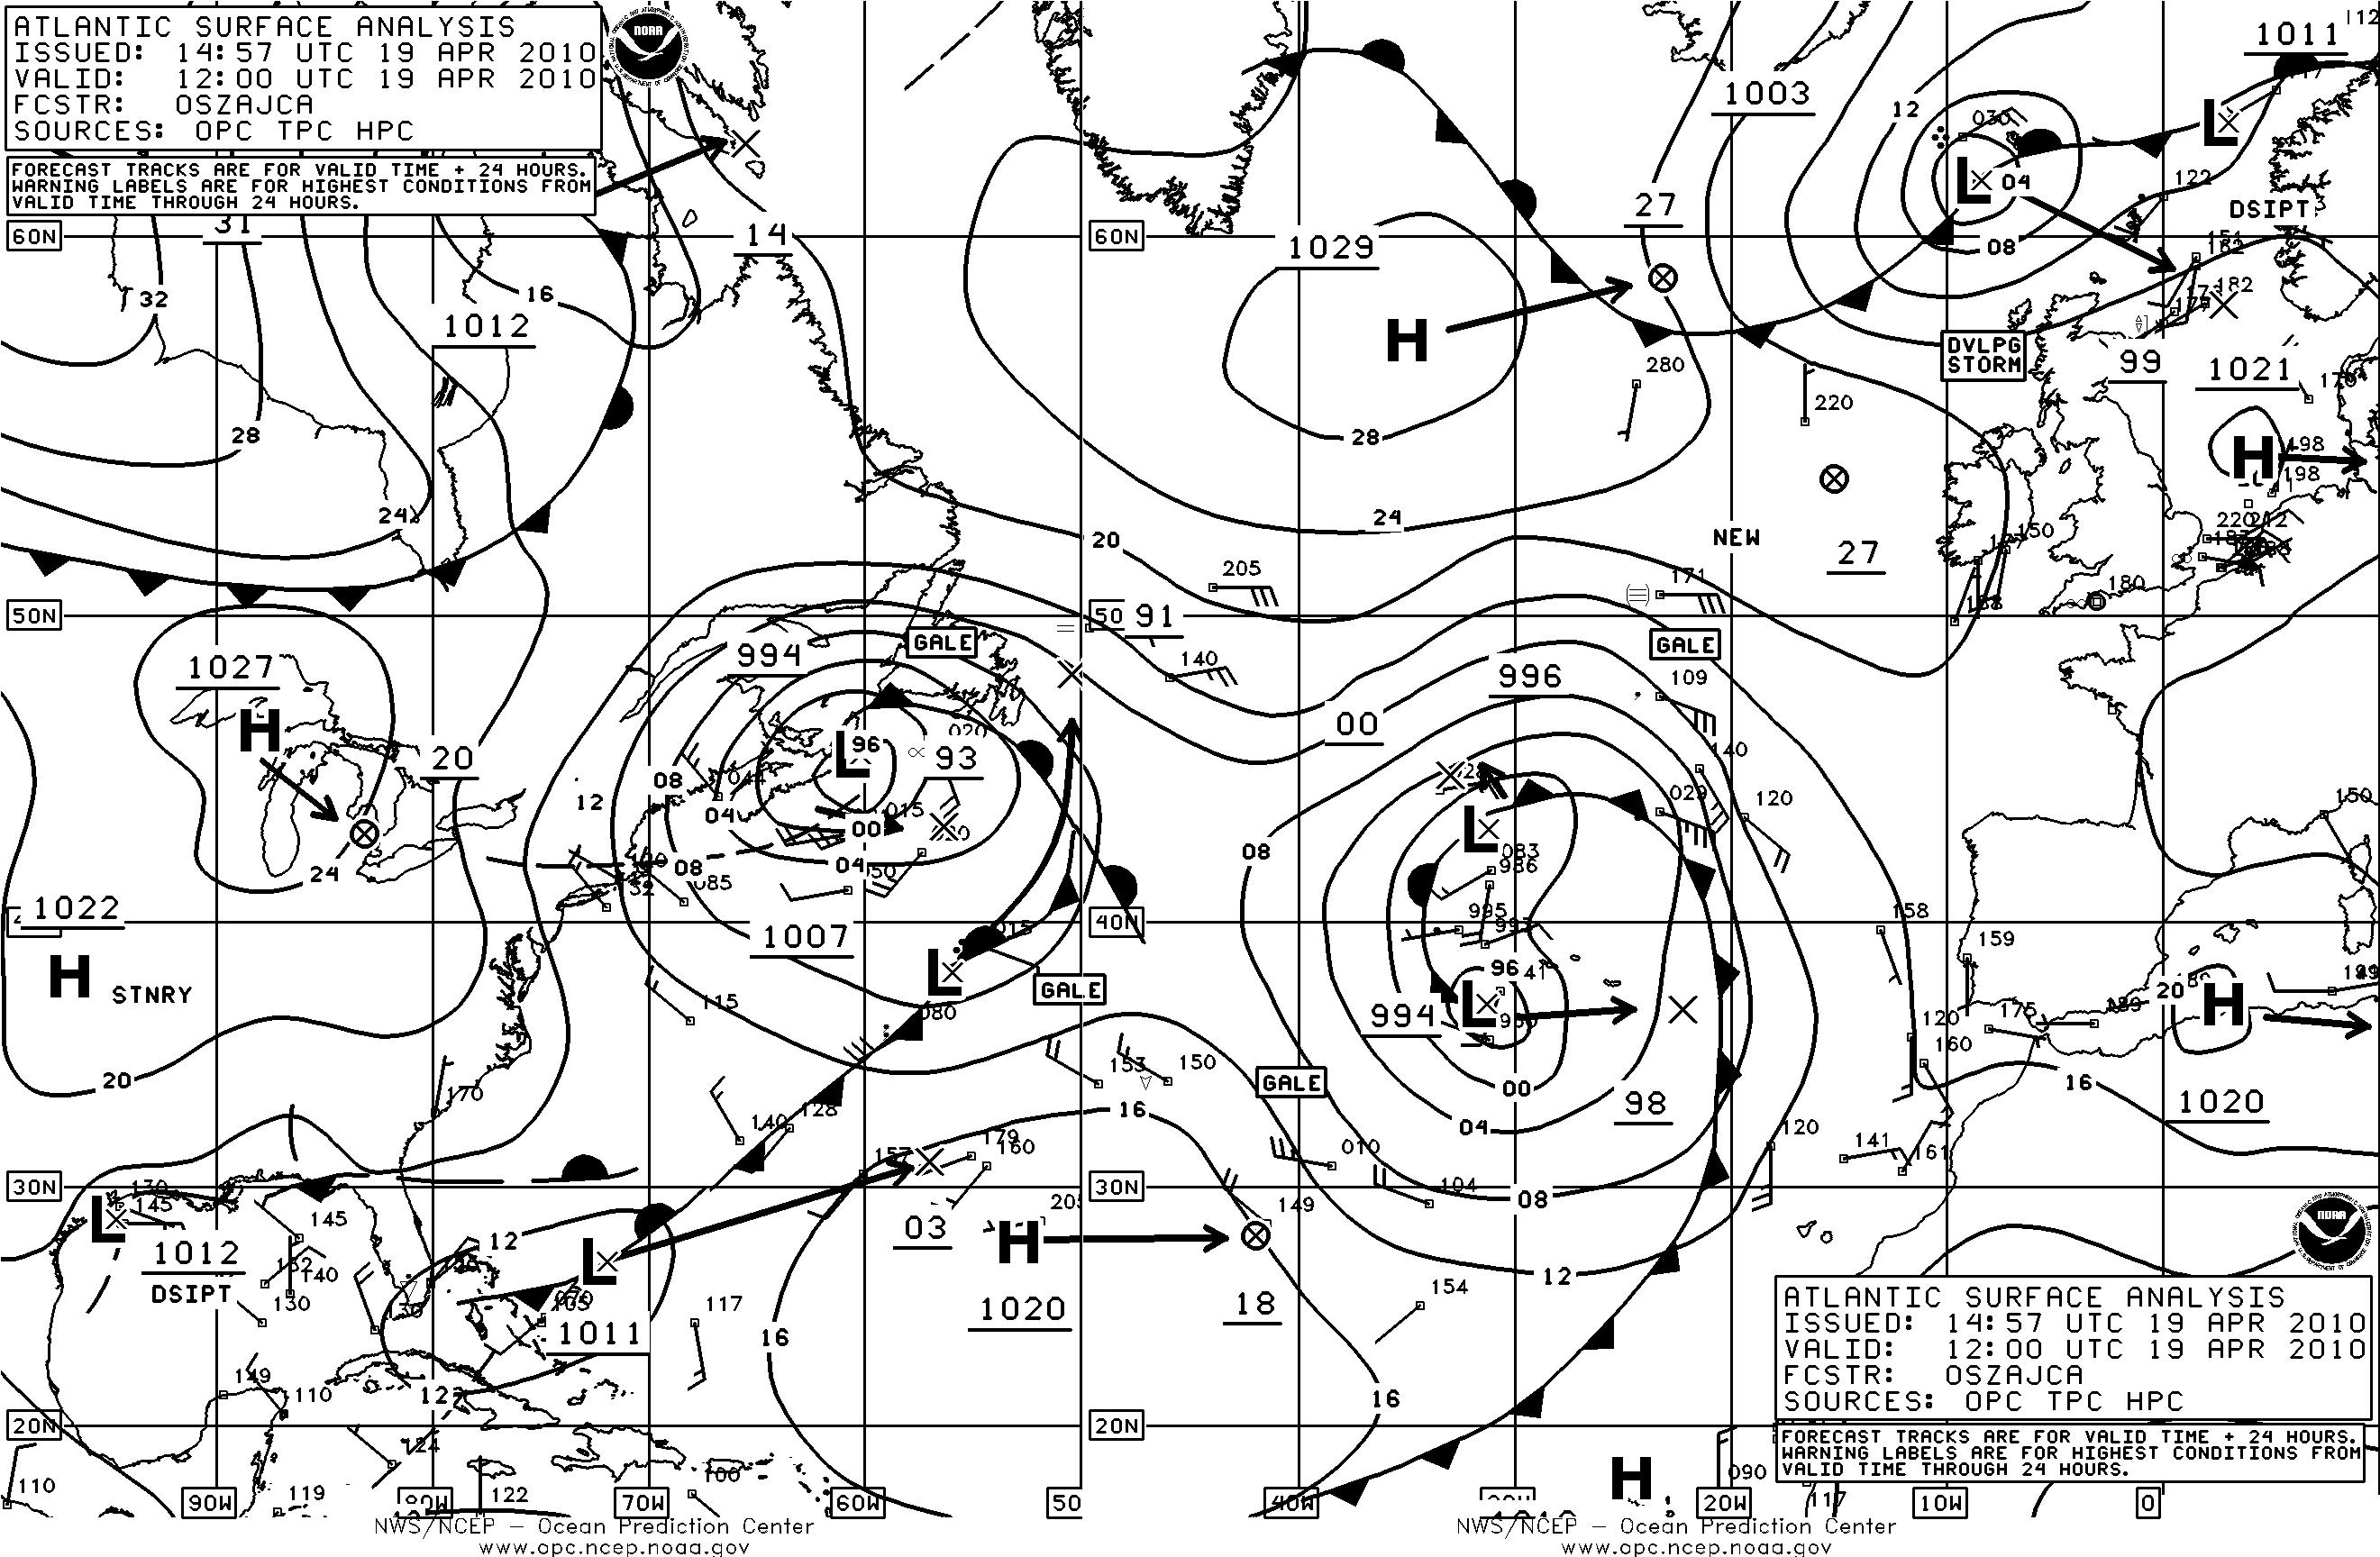
Only the NOAA-16 pass occurred during daylight, and that image, below, centered on the Volcano, shows a plume extending southward from Iceland in the wake of a low pressure system (the cyclonic swirl of clouds in the eastern half of the image) departing to the east.
 .
.
Infrared imagery from 0408 UTC and 0916 UTC today suggest how the ash cloud may be changing with time. The 3.74 micron imagery and the 10.8-micron imagery, below, both show an increase in the area covered by the plume. This suggests an ongoing eruption. The 10.8-micron imagery in particular shows a lengthening of the volcanic plume southward from Iceland. The 3.74 micron imagery is affected by radiation reflected from the Sun. The 0408 UTC image occurred before sunrise. Only radiation emitted by the Earth, or clouds, or ash, is detected by the satellite. Note the warm (dark) spot that colocates with the volcano: brightness temperatures there are 20 K warmer than surrounding pixels. The 0916 UTC occurred during daylight, and as such, solar radiation at 3.74 microns can be reflected off the Earth and detected by the satellite. The sum total of radiation (emitted plus reflected) will always be greater than only the emitted radiation, thus the scene will appear warmer (and in the greyscale enhancement, darker): the “extra” radiation detected by the satellite is interpreted to mean a warmer emitting surface. Note the striking appearance of the plume. It is very dark (warm) because the particles in the plume are highly reflective. At 0916 UTC, the volcano still retains its dark spot presence in the 3.74 micron imagery. The brightness temperature remains about 20 K warmer than at surrounding pixels.


 and 3.7 µm shortwave IR images")
MODIS Red/Green/Blue (RGB) and 3.7 µm shortwave IR images
Eyjafjallajökull continued to erupt on 20 April 2010. An Aqua MODIS Red/Green/Blue (RGB) image (above) showed a thin but well-defined cloud plume (likely a plume of volcanic steam) arcing southeastward, with a hint of a broader volcanic ash plume spreading out southward from the volcano. The corresponding MODIS 3.7 µm shortwave IR image displayed a pronounced “hot spot” (yellow to red color enhancement) associated with the source of the eruption.
An animation of Meteosat-9 volcanic ash retrieval products (below) indicated that the cloud heights decreased rapidly with time (likely a result of relatively large particles), and the ash cloud quickly became undetectable with increasing distance from the source volcano, due to its low optical depth and obstruction by meteorological clouds.

Meteosat-9 volcanic ash retrieval products
View only this post Read Less


")
")


 image showing the ash plume on 17 April 2010")


")

