
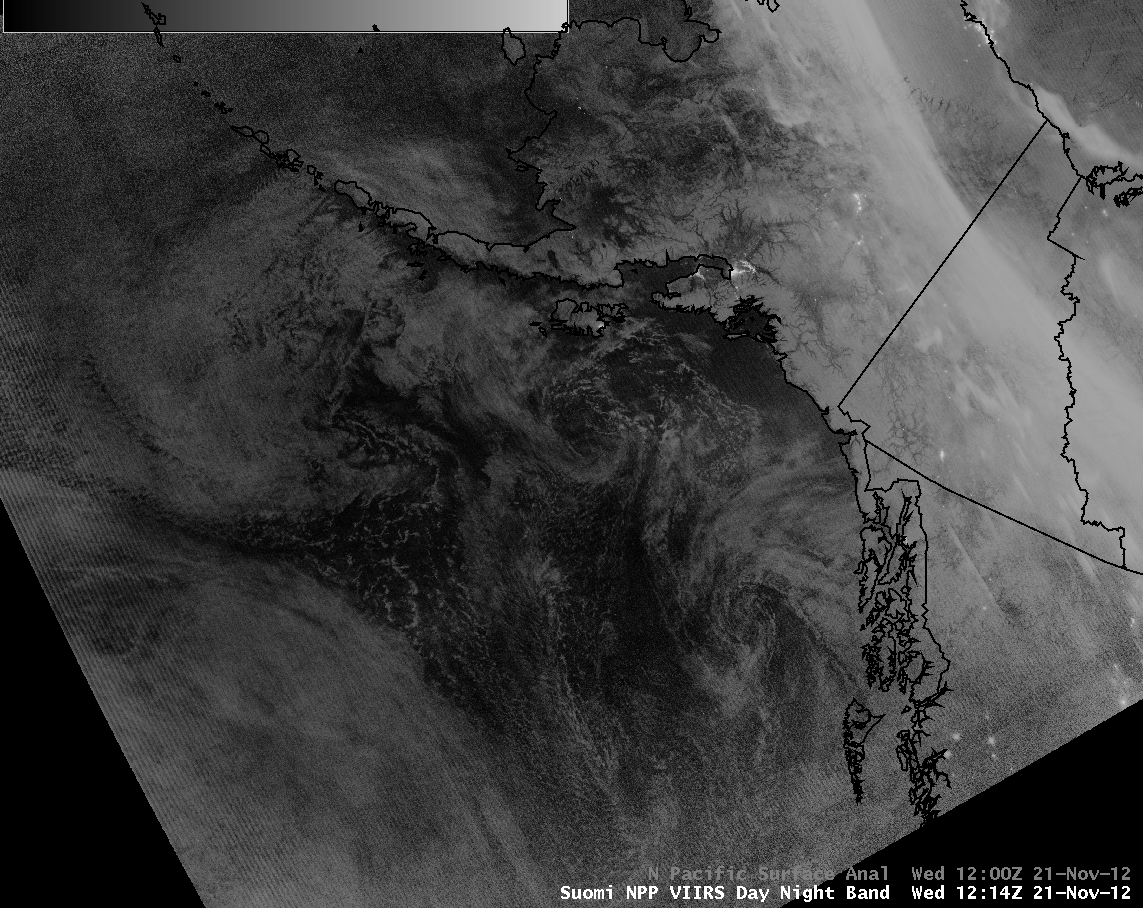
Suomi NPP VIIRS 11.45 µm IR image with surface analysis
The National Weather Service forecast office at Juneau, Alaska mentioned their use of Suomi NPP VIIRS imagery:
SOUTHEAST ALASKA FORECAST DISCUSSION
NATIONAL WEATHER SERVICE JUNEAU AK
553 AM AKST WED NOV 21 2012.SHORT TERM…SOMEWHAT COMPLICATED PATTERN IN THE GULF AND NORTHEAST PACIFIC THIS MORNING. THERE ARE AROUND 4 SEPARATE
CIRCULATION CENTERS VISIBLE ON IR AND VIIRS NIGHTTIME VISIBLE IMAGES. THE STRONGEST IS WEST OF DIXON ENTRANCE CURRENTLY AND IS SLOWLY WEAKENING AS IT REMAINS NEARLY STATIONARY. A SECOND LOW IS JUST SE OF KODIAK ISLAND, A THIRD IS AROUND 50N 140W, AND THE FOURTH IS A VERY WEAK ONE OVER HAIDA GWAII.
AWIPS images of Suomi NPP VIIRS 11.45 µm IR channel (above) and 0.7 µm Day/Night Band data (below) at 12:14 UTC or 3:14 AM local time on 21 November 2012 showed the cloud features associated with the complex pattern over the Gulf of Alaska at that particular time (comparison of IR and Day/Night Band images).
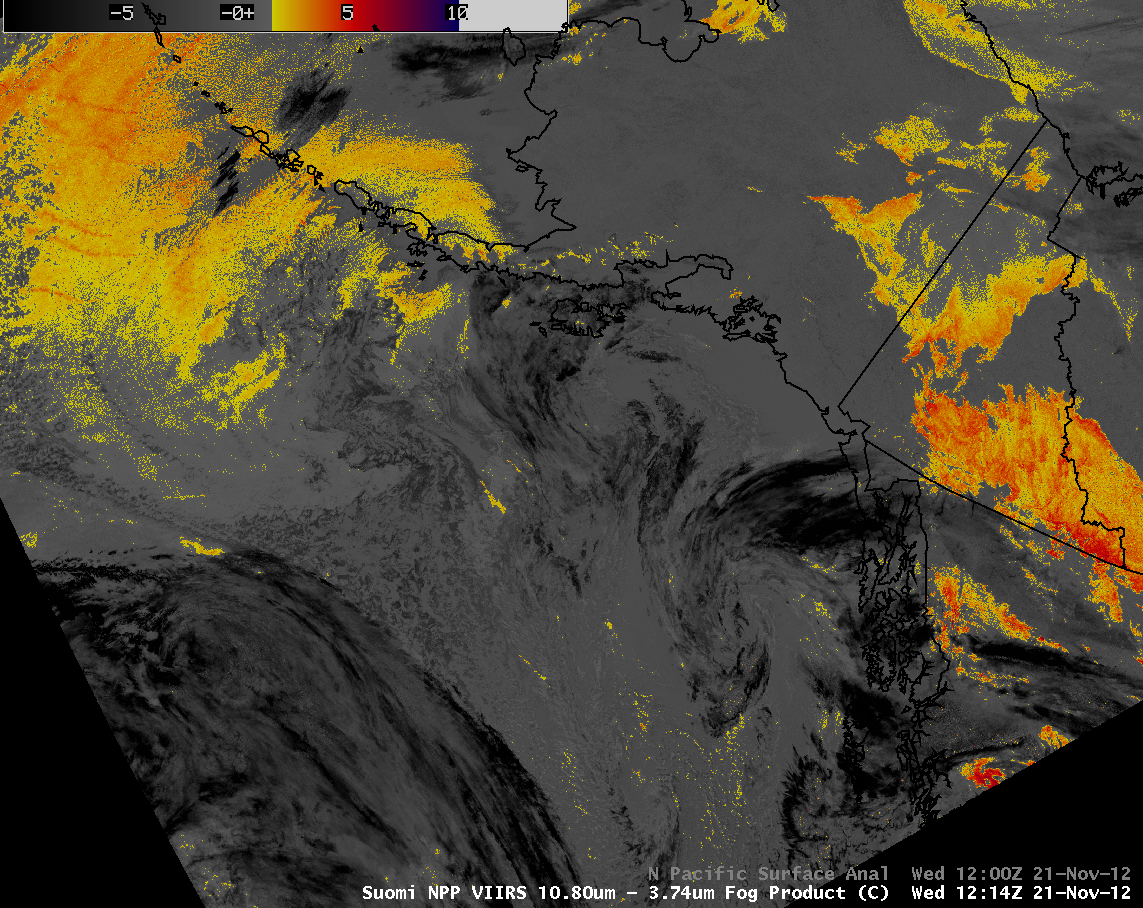
Items of interest to note on the VIIRS IR image: (1) wave clouds well downwind (to the south of) the Aleutian Islands, where northerly winds were as strong as gale force, and (2) large patches of fog and stratus clouds (VIIRS IR brightness temperature difference “Fog/stratus product”) across parts of the Yukon, east-central Alaska, and the North Slope region of Alaska.
Interesting features to point out on the Day/Night Band image include: (1) the bright city lights of populated areas such as Anchorage and Fairbanks, (2) bright northwest-to-southeast oriented swaths of the Aurora Borealis across parts of Alaska and the Yukon, as well as just off the Arctic Ocean coastline, and (3) the cluster of bright lights associated with drilling activity in the Prudhoe Bay oil field area along the northern coast of Alaska.

Suomi NPP VIIRS 0.7 µm Day/Night Band image with surface analysis
A comparison of GOES-15 10.7 µm IR and Suomi NPP VIIRS 11.45 µm IR images (below) shows that in far northern latitudes the superior spatial resolution of imagery from polar-orbiter satellites provides much clearer view of many of the the various cloud features.

Suomi NPP VIIRS 11.45 µm IR and GOES-15 10.7 µm IR images
View only this post Read Less


 and GOES-13 (right) 0.63 µm visible images (click image to play animation")


")
 images")
 images")

 image (displayed using Google Earth)")


