This website works best with a newer web browser such as Chrome, Firefox, Safari or Microsoft Edge. Internet Explorer is not supported by this website.

Fires and thunderstorms as viewed by VIIRS

A comparison of AWIPS images of Suomi NPP VIIRS 11.45 µm IR, 0.7 µm Day/Night Band, and 3.74 µm shortwave IR data (above) showed (1) a pair of strong thunderstorms over the Montana/North Dakota/South Dakota border region, with cold cloud top IR brightness temperatures and excellent illumination of the overshooting... Read More

Suomi NPP 11.45 µm IR, 0.7 µm Day/Night Band, and 3.74 µm shortwave IR images

Suomi NPP 11.45 µm IR, 0.7 µm Day/Night Band, and 3.74 µm shortwave IR images

A comparison of AWIPS images of Suomi NPP VIIRS 11.45 µm IR, 0.7 µm Day/Night Band, and 3.74 µm shortwave IR data (above) showed (1) a pair of strong thunderstorms over the Montana/North Dakota/South Dakota border region, with cold cloud top IR brightness temperatures and excellent illumination of the overshooting tops and other cloud features due to the full phase of the moon, and (2) a few wildfires that were burning, with the largest ones being located in southeastern Montana and northeastern Wyoming. The wildfires exhibited “hot spots” (black to yellow to red color enhancement) on the shortwave IR image, and also appeared very bright on the Day/Night Band image due to the large areas of flames.

METAR surface reports plotted on the VIIRS IR image (below) revealed that Buffalo, South Dakota (station identifier K2WX) had a wind gust of 48 knots (55 mph). Hail of 2.0 inches in diameter was reported from this storm 25 minutes earlier at 09:15 UTC.

Suomi NPP VIIRS 11.45 µm IR image + METAR surface reports

Suomi NPP VIIRS 11.45 µm IR image + METAR surface reports


A comparison of the 275-meter resolution (projected onto a 1-km AWIPS grid) Suomi NPP VIIRS 11.45 µm IR image with the corresponding 4-km resolution GOES-13 10.7 µm IR image (below) demonstrates (1) the obvious advantage of higher spatial resolution, with better details seen in the storm top structure; the coldest cloud top IR brightness temperature on the VIIRS image was -77 C, compared to -63 C on the GOES image, and (2) the significant geo-location displacement of the GOES-13 image features, due to the problem of parallax with such a large satellite viewing angle (which is about 60 degrees for this region from the GOES-13 satellite).

Suomi NPP VIIRS 11.45 µm IR image + GOES-13 10.7 µm IR image

Suomi NPP VIIRS 11.45 µm IR image + GOES-13 10.7 µm IR image

View only this post Read Less

Derecho moving southeastward from the Midwest to the East Coast

An AWIPS image of 1-km resolution POES AVHRR 10.8 µm IR channel data with overlays of cumulative SPC storm reports (above) showed a strong mesoscale convective system (MCS) as it was moving southeastward across northern Indiana at 18:23 UTC or 12:23 PM local time on Read More

POES AVHRR 10.8 µm IR channel image + cumulative SPC storm reports

POES AVHRR 10.8 µm IR channel image + cumulative SPC storm reports

An AWIPS image of 1-km resolution POES AVHRR 10.8 µm IR channel data with overlays of cumulative SPC storm reports (above) showed a strong mesoscale convective system (MCS) as it was moving southeastward across northern Indiana at 18:23 UTC or 12:23 PM local time on 29 June 2012 — this MCS evolved into a long-lived progressive derecho event, producing a broad swath of wind damage across the Ohio River Valley and into the Mid-Atlantic states (SPC storm reports). A peak wind gust of 91 mph was recorded at Fort Wayne, Indiana, with hail as large as 3.0 inches in diameter falling near Danville, Illinois. At least 12 fatalities have been attributed to this derecho.

Two ingredients helping to fuel the development and upscale growth of this derecho event were convergence/lift along a quasi-stationary frontal boundary, and rich moisture pooled along and just south of the frontal boundary. 10-km resolution GOES-13 sounder Total Precipitable Water (TPW) derived product imagery (below; click image to play animation) showed TPW values in the 50 to 65 mm (2.0 to 2.4 inch) range.

GOES-13 sounder Total Precipitable Water derived product imgery (click image to play animation)

GOES-13 sounder Total Precipitable Water derived product imgery (click image to play animation)

================================

GOES-13 sounder Lifted Index derived product imagery (click image to play animation)

GOES-13 sounder Lifted Index derived product imagery (click image to play animation)

There was also extreme instability present along and just south of this frontal boundary, as seen on GOES-13 sounder derived product images of Lifted Index or LI (above; click image to play animation) and Convective Available Potential Energy or CAPE (below; click image to play animation). AWIPS cursor sampling of these instability products showed widespread LI values of -14.8º C, and CAPE values of 6000 J per kg (denoted by the lighter purple color enhancements on each sounder product).

GOES-13 sounder Convective Available Potential Energy (CAPE) derived product (click image to play animation)

GOES-13 sounder Convective Available Potential Energy (CAPE) derived product (click image to play animation)

Clear sky single-field-of-view (SFOV) GOES-13 sounder temperature and moisture profiles within this axis of extreme instability (below) showed an LI value of -16.8º C at Point A in far eastern Illinois at 16 UTC. Note that the locations of some of these available GOES sounder temperature/moisture profiles were situated between the standard rawinsonde sites of Lincoln, Illinois (KILX) and Wilmington, Ohio (KILN) — this demonstrates the potential value of using GOES sounder data in regions (or at times of the day) between conventional rawinsonde launches.

GOES-13 sounder vertical profiles of temperature and dew point

GOES-13 sounder vertical profiles of temperature and dew point

3 comparisons of 1-km resolution POES AVHRR and MODIS visible channel and IR channel imagery with plots of cloud-to-ground lightning strikes (below) depicted the storm structure at 18:18 UTC, 19:17 UTC, and 19:48 UTC. Thunderstorms on the 19:48 UTC POES AVHRR image exhibited a minimum cloud top IR brightness temperature of -90 C.

POES AVHRR 0.86 µm visible, 12.0 µm IR, and cloud-to-ground lightning strikes

POES AVHRR 0.86 µm visible, 12.0 µm IR, and cloud-to-ground lightning strikes

MODIS 0.65 µm visible, 11.0 µm IR, and cloud-to-ground lightning strikes data

MODIS 0.65 µm visible, 11.0 µm IR, and cloud-to-ground lightning strikes data

POES AVHRR 0.86 µm visible, 12.0 µm IR, and cloud-to-ground lightning data

POES AVHRR 0.86 µm visible, 12.0 µm IR, and cloud-to-ground lightning data

4-km resolution GOES-13 10.7 µm IR channel images with overlays of SPC storm reports (below) showed the southeastward progression of the MCS and the attendant hail and damaging winds reports. The GOES-13 IR images also exhibited unusually cold IR brightness temperatures, at times as low as -81º C (at 20:45 UTC).

GOES-13 10.7 µm IR images + SPC storm reports (click image to play animation)

GOES-13 10.7 µm IR images + SPC storm reports (click image to play animation)

During the following overnight hours, the core of the derecho continued to move southeastward across West Virginia, Virginia, and eventually to the East Coast and the adjacent offshore waters of the Atlantic Ocean. In addition to creating a widespread swath of damaging winds at the surface, the MCS was also responsible for a number of reports of high-altitude turbulence, as seen on 4-km resolution GOES-13 10.7 µm IR images with overlays of pilot reports of turbulence (below; click image to play animation). Severe turbulence was reported over or near the periphery of the storm at 01:00 UTC, 02:16 UTC, and 02:45 UTC.

GOES-13 10.7 µm IR channel images + Pilot reports of turbulence (click image to play animation)

GOES-13 10.7 µm IR channel images + Pilot reports of turbulence (click image to play animation)

Better storm-top structure can be seen on a sequence of 1-km resolution POES AVHRR 12.0 µm and MODIS 11.0 µm IR images (below), including a very detailed view of the transverse banding that formed along the northern edge of the dissipating MCS.

POES AVHRR 12.0 µm IR + MODIS 11.0 µm IR images

POES AVHRR 12.0 µm IR + MODIS 11.0 µm IR images

An overlay of 1-hour cloud-to-ground lightning strikes (ending at 07:00 UTC) on the Suomi NPP VIIRS 11.45 µm IR channel image at 07:14 UTC (below) showed a decreasing amount of lightning activity as the parent MCS began to slowly dissipate as it moved out over the waters of the western Atlantic Ocean. The corresponding 07:14 UTC VIIRS 0.7 µm Day/Night Band image did manage to reveal a few bright white pixels resulting from cloud-top illumination by clusters of lightning.

Suomi NPP VIIRS 11.45 µm IR image + VIIRS 0.7 µm Day/Night Band image

Suomi NPP VIIRS 11.45 µm IR image + VIIRS 0.7 µm Day/Night Band image

The strong surface winds downed a large number of trees and powerlines, causing widespread power outages that affected over 3 million people. One area especially hard-hit was West Virginia and adjacent portions of Virginia and Ohio, where a before/after comparison of Suomi NPP VIIRS 0.7 µm Day/Night Band (DNB) images around 07 UTC (4 AM local time) on 29 June and 30 June (below; courtesy of Jordan Gerth, CIMSS) revealed the large areas of darkness (lack of city lights) on 30 June after the derecho had moved through. The large dark areas seen on the DNB images over Pennsylvania on 29 June (VIIRS IR image) and Ohio/Michigan on 30 June (VIIRS IR image) were due to strong thunderstorms obscuring the view of the city lights below.

Suomi NPP VIIRS 0.7 µm Day/Night Band images on 29 June and 30 June

Suomi NPP VIIRS 0.7 µm Day/Night Band images on 29 June and 30 June

UPDATE: GOES-13 10.7 µm IR channel images of the entire derecho event (below; also available as a QuickTime movie). The GOES-13 satellite had been placed into Rapid Scan Operations (RSO). providing images as frequently as every 5-10 minutes during much of the life cycle of the storm.

GOES-13 10.7 µm IR channel images (click image to play animation)

GOES-13 10.7 µm IR channel images (click image to play animation)

In addition, a McIDAS-V combination of GOES-13 10.7 µm IR images and CAPE derived from overpasses of the Suomi NPP CrIS and the Aqua AIRS instruments (below; image courtesy of Joleen Feltz) showed that the derecho was moving toward pockets of instability that were in place along the trough axis that was oriented from southwest to northeast along the East Coast. Plotted in yellow are the surface wind gusts of 80 mph or greater associated with the derecho.

GOES-13 IR + CAPE from Suomi NPP CrIS and Aqua AIRS

GOES-13 IR + CAPE from Suomi NPP CrIS and Aqua AIRS

View only this post Read Less

Western US wildfires

Numerous wildfires continued to burn across much of the western US into late June, due to a combination of moderate to extreme drought, high temperatures, and strong winds. McIDAS images of 1-km resolution GOES-15 0.63 µm visible channel data (above; click image to play animation) showed... Read More

GOES-15 0.63 µm visible channel images (click image to play animation)

GOES-15 0.63 µm visible channel images (click image to play animation)

Numerous wildfires continued to burn across much of the western US into late June, due to a combination of moderate to extreme drought, high temperatures, and strong winds. McIDAS images of 1-km resolution GOES-15 0.63 µm visible channel data (above; click image to play animation) showed large smoke plumes from the more significant fires that were burning in Montana and Wyoming on 27 June 2012. The GOES-15 satellite had been placed into Super Rapid Scan Operations (SRSO) mode, providing bursts of imagery at 1-minute intervals. The smoke plume from the fire burning in southwestern Wyoming was remarkably long, and was lofted high enough to easily pass over the Wind River Range of mountains (which has a number of peaks over 13,000 feet or 1362 meters). A pilot report mentioned that the top of the smoke layer extended to 34,000 feet.

250-meter resolution MODIS true-color and false-color Red/Green/Blue (RGB) images
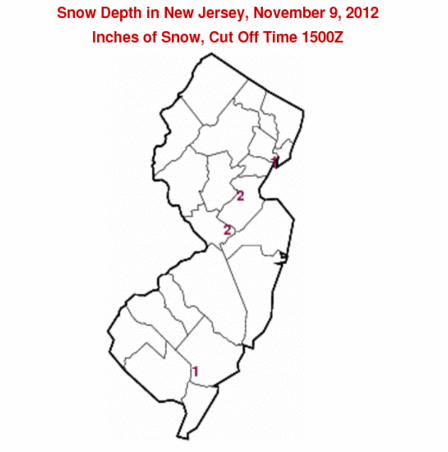
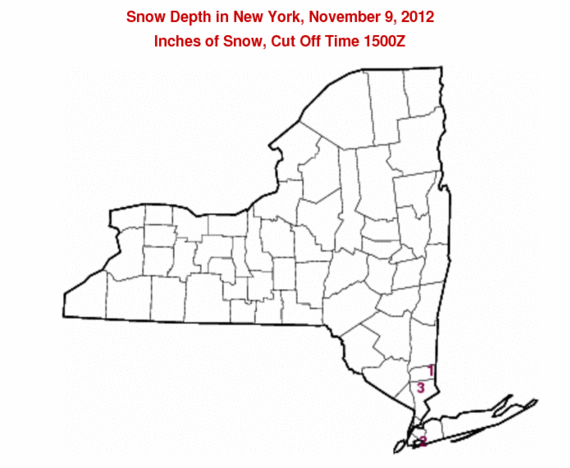
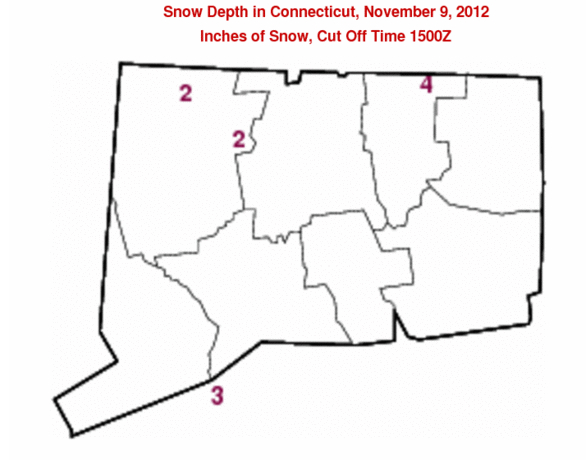
 from the SSEC MODIS Today site (below) showed greater detail of the thick smoke plume passing over the Wind River Range, as well as the large “hot spots” (pink color enhancement on the false-color image) associated with the actively burning fires.

MODIS true-color and false-color RGB images

MODIS true-color and false-color RGB images

AWIPS images of 4-km resolution GOES-13 3.9 µm shortwave IR data (below; click image to play animation) showed the hot spots associated with some of the larger fires in Utah, Wyoming, and Montana as they burned through the following night.

GOES-13 3.9 µm shortwave IR channel images (click image to play animation)

GOES-13 3.9 µm shortwave IR channel images (click image to play animation)

A comparison of a 4-km resolution GOES-13 3.9 µm shortwave IR image with the corresponding 1-km resolution MODIS 3.7 µm shortwave IR image (below) demonstrated the advantage of higher spatial resolution for detecting the heat signatures from the smaller fires, as well as more accurately locating the boundaries of the larger fire complexes. On the MODIS image, some of the pixel IR brightness temperatures were so hot that they “wrapped around” to the cold end of the temperature scale, and appeared white.

MODIS 3.7 µm vs GOES-13 3.9 µm shortwave IR images

MODIS 3.7 µm vs GOES-13 3.9 µm shortwave IR images

On the following morning of 28 June, GOES-15 0.63 µm visible channel images (below; click image to play animation) showed the large areal coverage of the smoke, which had moved as far east as the Great Lakes region. An HD version of this GOES-15 visible image animation is available here, along with a close-up version centered on the western Wyoming fire which showed filaments of smoke (which had settled into the valleys overnight) becoming mixed and ventilated upward into the boundary layer as daytime heating and surface winds increased during the morning hours.

GOES-15 0.63 µm visible channel images (click image to play animation)

GOES-15 0.63 µm visible channel images (click image to play animation)

View only this post Read Less

Drilling activity in the Eagle Ford (Texas) and Bakken (North Dakota) oil shale formations

Hat tip to Tom Lee (Naval Research Laboratory, Monterey, California) for alerting us to another region of the US where a pronounced satellite signature of extensive drilling operations can be seen using Suomi NPP VIIRS Day/Night Band imagery. A comparison of AWIPS images of 375-meter resolution (projected onto a 1-km... Read More

Suomi NPP VIIRS 3.74 µm shortwave IR and 0.7 µm Day/Night Band images

Suomi NPP VIIRS 3.74 µm shortwave IR and 0.7 µm Day/Night Band images

Hat tip to Tom Lee (Naval Research Laboratory, Monterey, California) for alerting us to another region of the US where a pronounced satellite signature of extensive drilling operations can be seen using Suomi NPP VIIRS Day/Night Band imagery. A comparison of AWIPS images of 375-meter resolution (projected onto a 1-km AWIPS grid) 3.74 µm shortwave IR data and the corresponding 0.7 µm Day/Night Band data (above) revealed the bright night-time illumination of widespread drilling activity across the Eagle Ford oil shale formation in southeastern Texas at 08:49 UTC (3:49 AM local time) on 25 June 2012. On the shortwave IR image, a number of small “hot spots” (pixels with a darker red color enhancement) could be seen, which were associated with natural gas flares at some of the larger drilling rig sites.

A similar signature of night-time drilling activity had been previously noted on VIIRS Day/Night Band imagery across the Bakken oil shale formation in western North Dakota — and a comparison with the color-enhanced shortwave IR image (below) at 08:30 UTC (2:30 or 3:30 AM local time, depending on the exact location) on 26 June 2012 again showed a number of natural gas flare “hot spots” at some of the larger illuminated drilling rig sites.

Suomi NPP VIIRS 3.74 µm shortwave IR and 0.7 µm Day/Night Band images

Suomi NPP VIIRS 3.74 µm shortwave IR and 0.7µm Day/Night Band images

Note that there is some striping seen in the Day/Night Band (DNB) image over North Dakota — a view of the entire VIIRS DNB swath (below) shows that North Dakota was located within the “stray light zone” of the Suomi NPP satellite orbit, where some sunlight was reachng the DNB detectors. Farther to the south over Texas, there was no stray ligt contamination evident on the DNB image.

Suomi NPP VIIRS 0.7 µm Day/Night Band image

Suomi NPP VIIRS 0.7 µm Day/Night Band image

A May 2011 map of the Lower 48 state natural gas and oil shale “plays” (below) suggested that there are likely other regions of the US where similar VIIRS DNB and shortwave IR satellite signatures might be seen.

Map of Lower 48 states natural gas and shale oil plays

Map of Lower 48 states natural gas and shale oil plays

View only this post Read Less