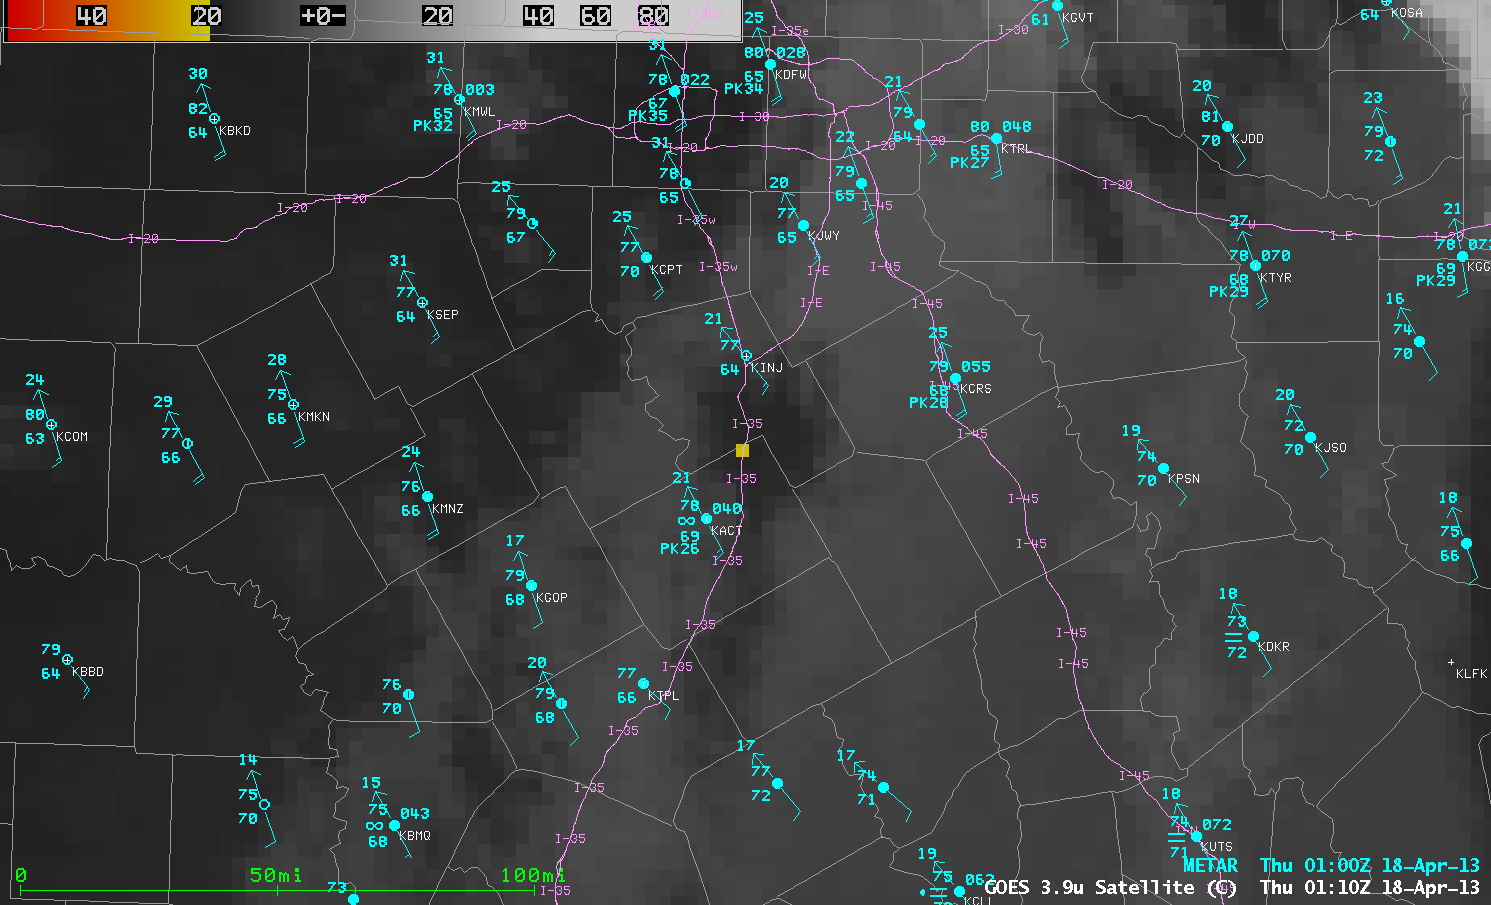
This website works best with a newer web browser such as Chrome, Firefox, Safari or Microsoft Edge. Internet Explorer is not supported by this website.

The “Black Marble”: City Lights At Night

On 05 December 2012 NASA and the NOAA National Geophysical Data Center (NGDC) jointly released a “Black Marble” global composite of night-time Suomi NPP VIIRS 0.7 µm Day/Night Band imagery (collected from multiple cloud-free satellite overpasses in April and October 2012) — the image above shows this dataset visualized using... Read More

Suomi NPP VIIRS Day/Night Band composite (global view)

Suomi NPP VIIRS Day/Night Band composite (global view)

On 05 December 2012 NASA and the NOAA National Geophysical Data Center (NGDC) jointly released a “Black Marble” global composite of night-time Suomi NPP VIIRS 0.7 µm Day/Night Band imagery (collected from multiple cloud-free satellite overpasses in April and October 2012) — the image above shows this dataset visualized using the SSEC Web Map Server. See the NASA news story and the SSEC news story for additional details.

Suomi NPP VIIRS 0.7 µm Day/Night Band composite image (North America)

Suomi NPP VIIRS 0.7 µm Day/Night Band composite image (North America)

A closer view of North America is shown above, with a zoomed-in image centered on Madison, Wisconsin shown below.

Suomi NPP VIIRS 0.7 µm Day/Night Band composite image (centered on Madison, WI)

Suomi NPP VIIRS 0.7 µm Day/Night Band composite image (centered on Madison, WI)

Many examples of the VIIRS Day/Night Band showing a variety of phenomena can be found elsewhere on the CIMSS Satellite Blog.

View only this post Read Less

Valley fog in Kentucky, and aircraft “distrails” in South Carolina

Two features of interest appeared on McIDAS images of GOES-13 0.63 µm visible channel data (above; click image to play animation) on the morning of 05 December 2012: (1) fingers of valley fog across much of Kentucky, which dissipated as daytime heating and... Read More

GOES-13 0.63 µm visible channel images (click image to play animation)

GOES-13 0.63 µm visible channel images (click image to play animation)

Two features of interest appeared on McIDAS images of GOES-13 0.63 µm visible channel data (above; click image to play animation) on the morning of 05 December 2012: (1) fingers of valley fog across much of Kentucky, which dissipated as daytime heating and boundary layer mixing increased, and (2) a pair of aircraft dissipation trails (or “distrails”) that first appeared north of Sumter (KSSC) and drifted east-northeastward between Florence (KFLO) and Darlington (KUDG). It is likely that these distrails (highlighted with yellow ‘>’ symbols) formed as aircraft heading to or from Columbia, South Carolina (KCAE) passed through the supercooled water droplet cloud layer, causing glaciation and subsequent fallout of the ice crystals to create the elongated clearing lines.

View only this post Read Less

Super Typhoon Bopha

Super Typhoon Bopha reached peak intensity (ADT plot | Advisory text) just before making landfall in the island of Mindanao in the Philippines on 03 December 2012. Earlier in the day, a comparison of McIDAS-X images of 375-meter resolution Suomi... Read More

Suomi NPP VIIRS 0.64 µm visible and 11.45 µm IR images

Suomi NPP VIIRS 0.64 µm visible and 11.45 µm IR images

Super Typhoon Bopha reached peak intensity (ADT plot | Advisory text) just before making landfall in the island of Mindanao in the Philippines on 03 December 2012. Earlier in the day, a comparison of McIDAS-X images of 375-meter resolution Suomi NPP VIIRS 0.64 µm visible channel and 11.45 µm IR channel data (above) revealed detailed patterns of cloud top wave structure: (1) the formation of “transverse bands” oriented perpendicular to the flow (which is fairly common in strong tropical cyclones), and (2) an arc-shaped gravity wave train in the northwest quadrant, which was likely propagating outward, away from the storm center. There were also a number of convective overshooting tops which exhibited IR brightness temperatures of -90 to -95º C (yellow enhancement).

MTSAT-1R 10.8 µm IR images (click image to play animation)

MTSAT-1R 10.8 µm IR images (click image to play animation)

McIDAS-X images of MTSAT-1R 10.8 µm IR channel images (above; click image to play animation) showed Super Typhoon Bopha as the eye made landfall around 20 UTC or 4 AM local time. Media reports indicated that there were as many as 270 fatalities as a result of flooding, mudslides, and falling trees.

A few hours prior to landfall, a comparison of McIDAS-V images of Suomi NPP VIIRS 0.7 µm Day/Night Band and 11.45 µm IR data (below; images courtesy of William Straka, CIMSS) again showed a signature of gravity waves propagating outward from the storm center — at this time (17:09 UTC or 1:09 AM local time) these gravity waves could be seen in all four quadrants of the storm top. The eye was not entirely cloud-free, with the Day/Night Band image showing moonlight being reflected off of low-level stratus near the ocean surface.

Suomi NPP VIIRS 0.7 µm Day/Night Band and 11.45 µm IR channel images

Suomi NPP VIIRS 0.7 µm Day/Night Band and 11.45 µm IR channel images

During the 01-03 December period, the MIMIC or Morphed Integrated Microwave Imagery at CIMSS product (below; click image to play animation) showed that Bopha experienced multiple eyewall replacement cycles as it moved south of the island of Palau (where it produced a wind gust of 70 mph at Koror) and toward the Philippines.

Morphed Integrated Microwave Imagery at CIMSS (click image to play animation)

Morphed Integrated Microwave Imagery at CIMSS (click image to play animation)

Bopha had an early storm track (below) that was unusually close to the Equator — in fact, the storm was classified as a typhoon at a latitude of 3.8º N on 30 November, making it the closest typhoon formation to the Equator on record for the West Pacific Basin.

Track of Super Typhoon Bopha

Track of Super Typhoon Bopha

View only this post Read Less

Cold air drainage into the valleys of the Yukon

As an area of arctic high pressure settled over the Yukon region of northwestern Canada on 29 November 2012, strong radiational cooling led to very cold surface air temperatures (-49º F at Mayo, station identifier CYMA) and drainage of this cold, dense air into the valleys and lower elevations. An AWIPS image... Read More

Suomi NPP VIIRS 11.45 µm IR image + METAR surface reports

Suomi NPP VIIRS 11.45 µm IR image + METAR surface reports

As an area of arctic high pressure settled over the Yukon region of northwestern Canada on 29 November 2012, strong radiational cooling led to very cold surface air temperatures (-49º F at Mayo, station identifier CYMA) and drainage of this cold, dense air into the valleys and lower elevations. An AWIPS image of Suomi NPP VIIRS 11.45 µm IR channel data with an overlay of METAR surface reports (above) showed the dendritic pattern of cold air drainage into the valleys (darker blue color enhancement); the coldest IR brightness temperature on the image was -51º C (violet color enhancement).

Even though fog and freezing fog was being reported at a few of the surface stations, a comparison of the Suomi NPP VIIRS 11.45 µm IR, 0.7 µm Day/Night Band, and the 11.45-3.74 µm “fog/stratus product” images (below) indicated that not all of the valley fog features could be easily seen — in particular, most of the areas of shallow ice fog did not exhibit a signal on the Day/Night Band or the fog/stratus product IR brightness temperature difference images.

Suomi NPP VIIRS 11.45 µm IR, 0.7 µm Day/Night Band, and 11.45-3.74 µm "fog/stratus product"

Suomi NPP VIIRS 11.45 µm IR, 0.7 µm Day/Night Band, and 11.45-3.74 µm “fog/stratus product”

View only this post Read Less