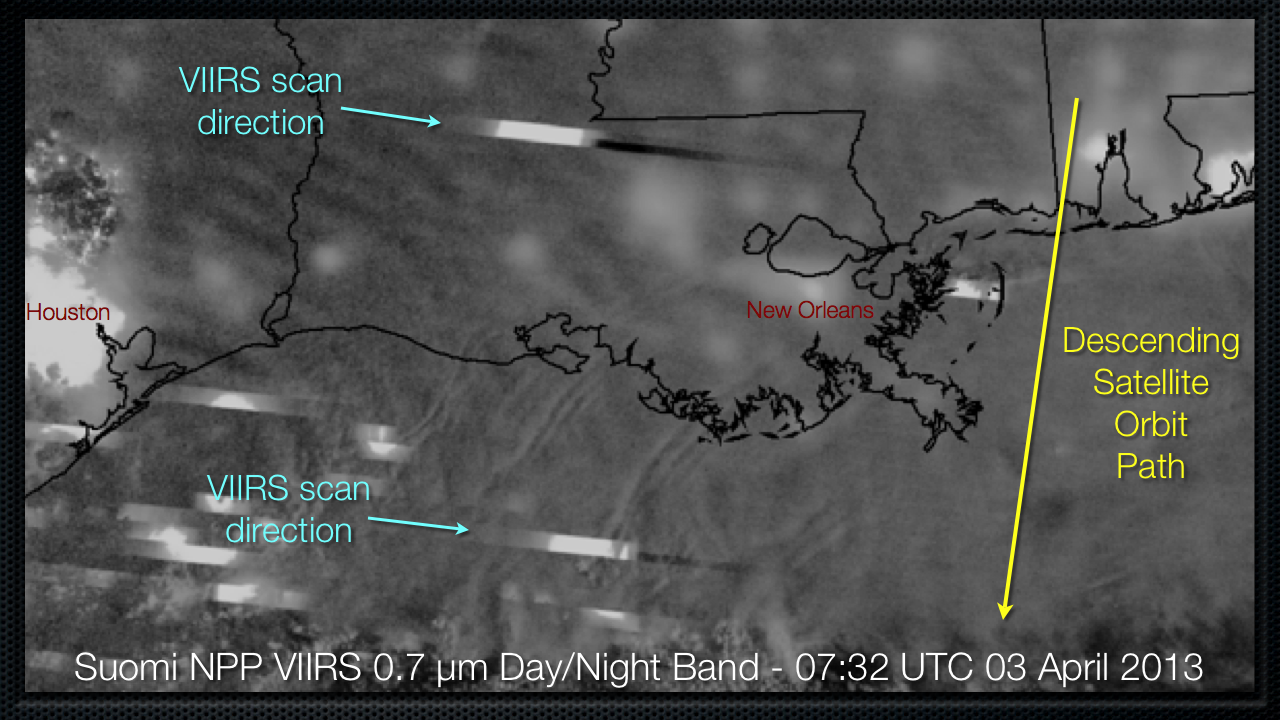
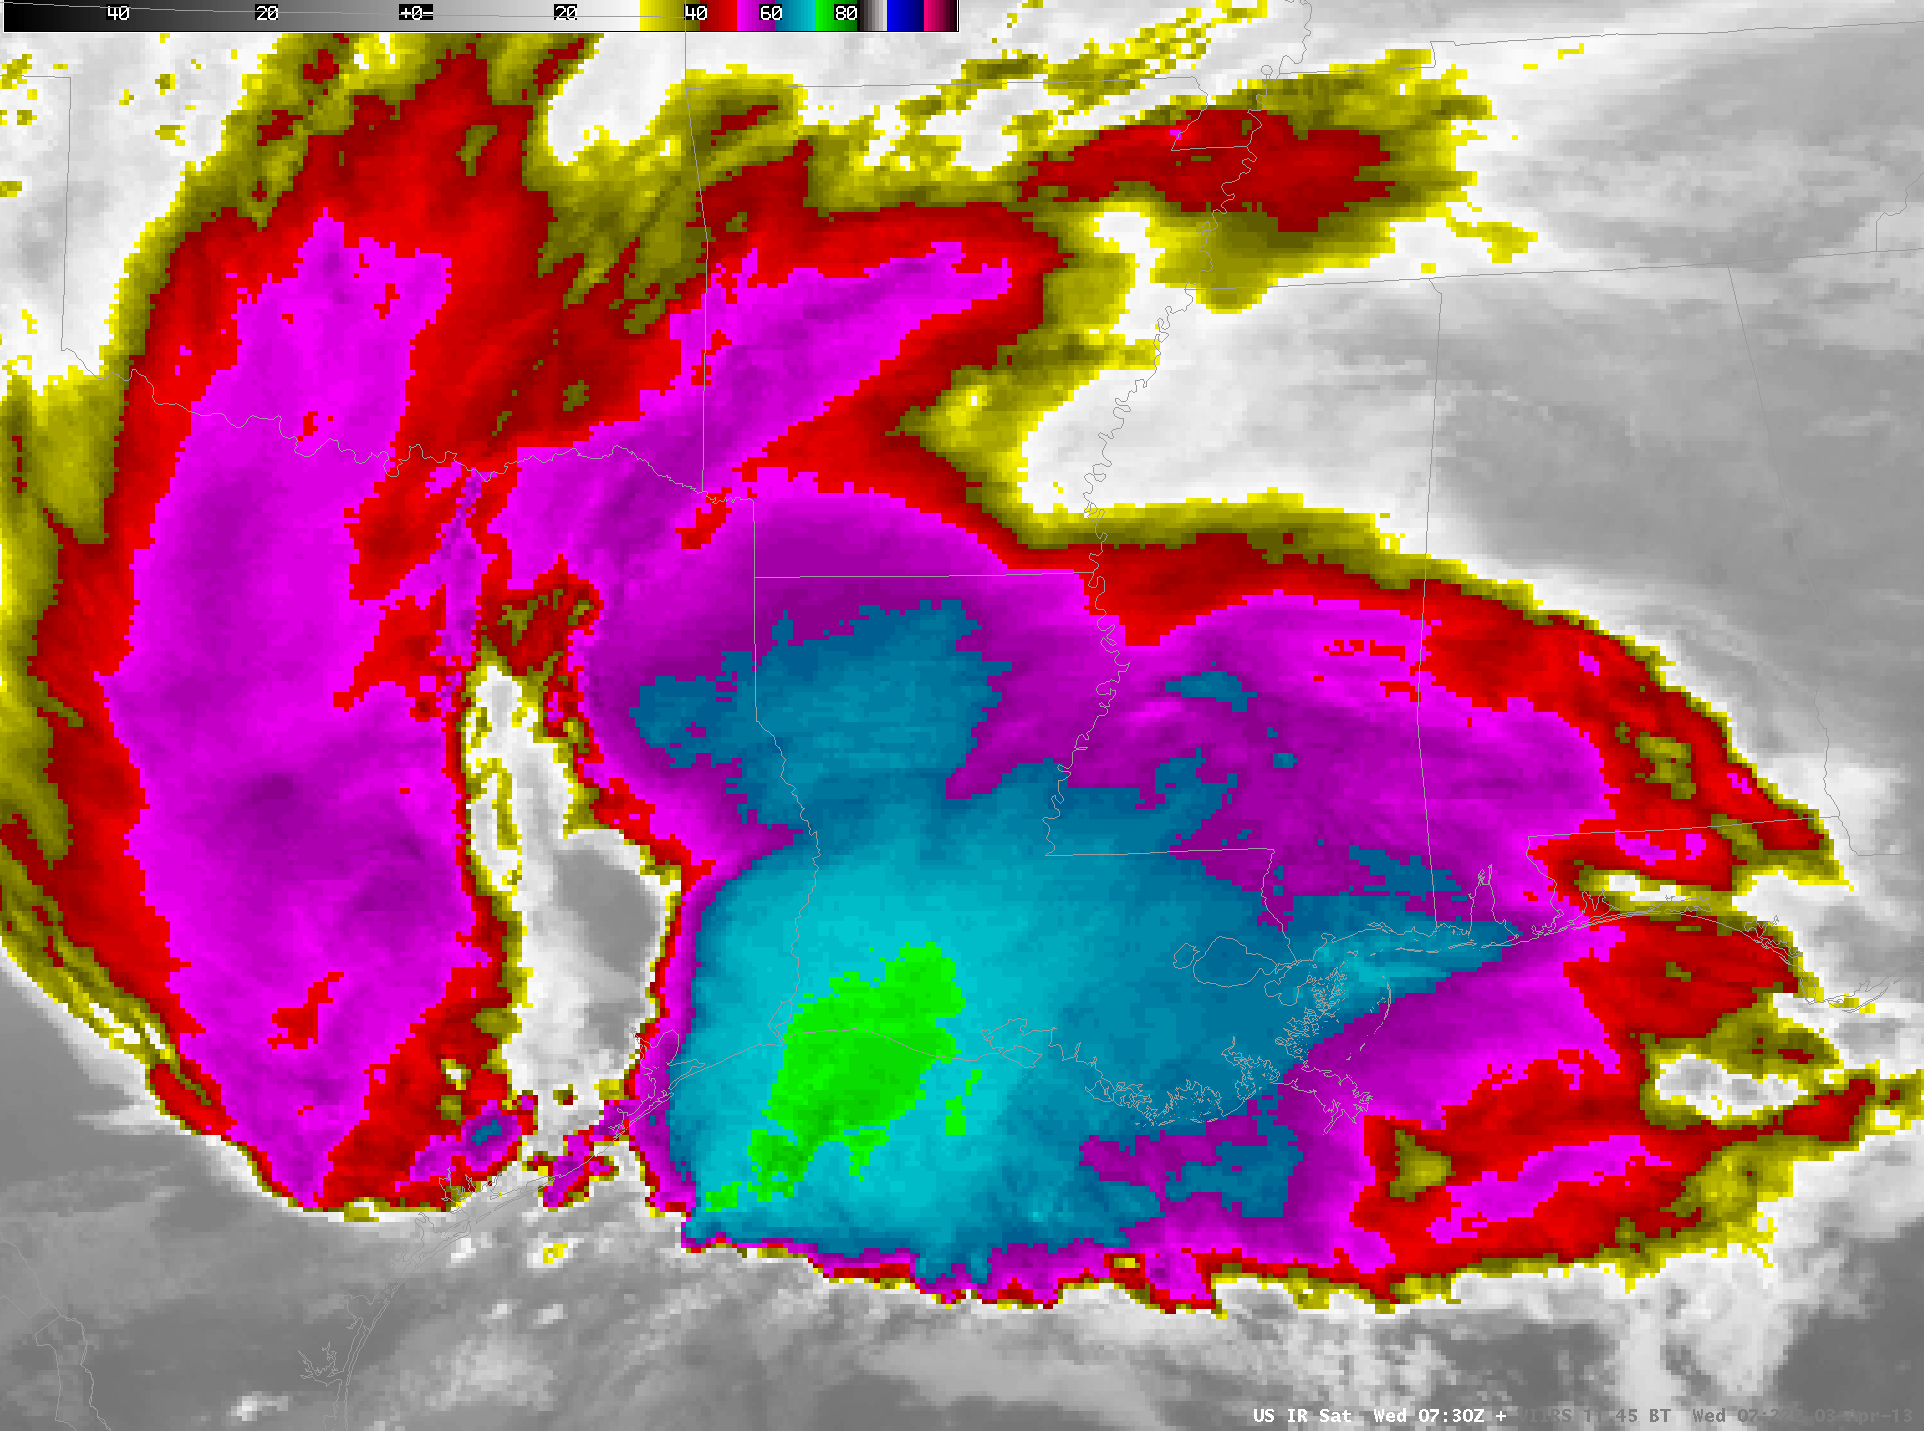
Continuing on the theme of the previous blog post, AWIPS images of Suomi NPP VIIRS Day/Night Band (0.7 µm) and Infrared Window (11.45 µm) data (above) showed another large mesoscale convective system over the eastern Gulf of Mexico at 06:45 UTC or 4:45 AM... Read More

Suomi NPP VIIRS Day/Night Band (0.7 µm) and Infrared Window (11.45 µm) images [click to enlarge]
Continuing on the theme of the
previous blog post, AWIPS images of Suomi NPP VIIRS Day/Night Band (0.7 µm) and Infrared Window (11.45 µm) data
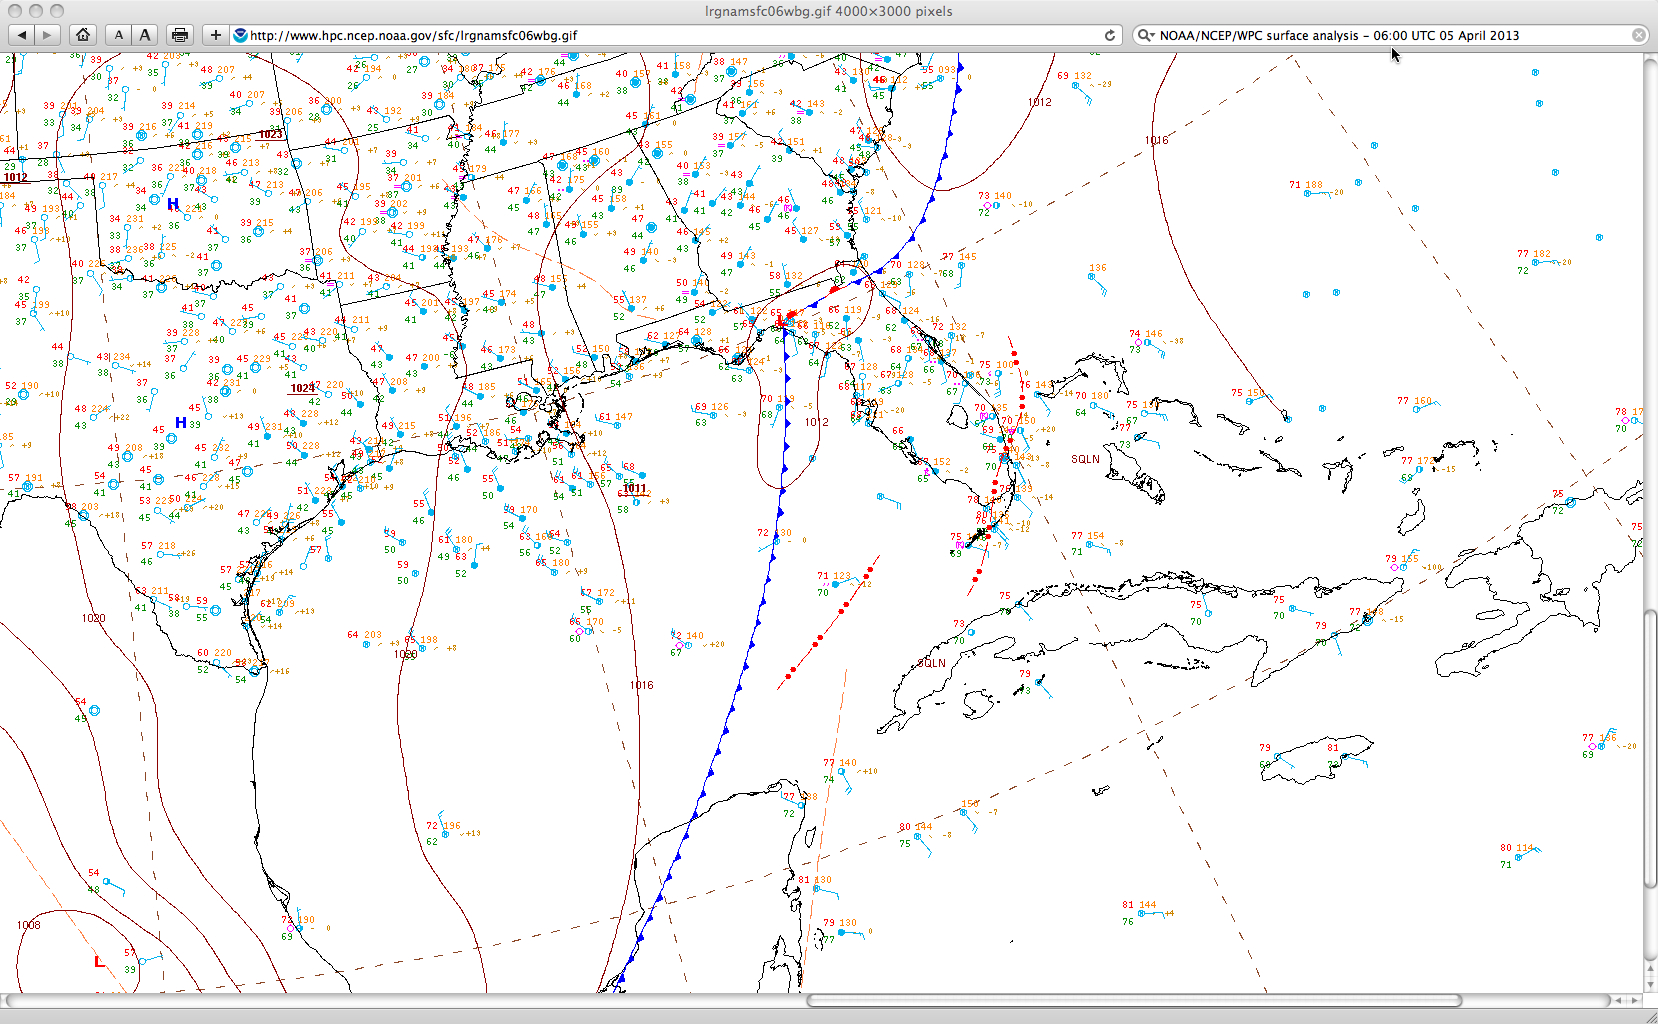
(above) showed another large mesoscale convective system over the eastern Gulf of Mexico at 06:45 UTC or 4:45 AM local time (
06 UTC surface analysis) on
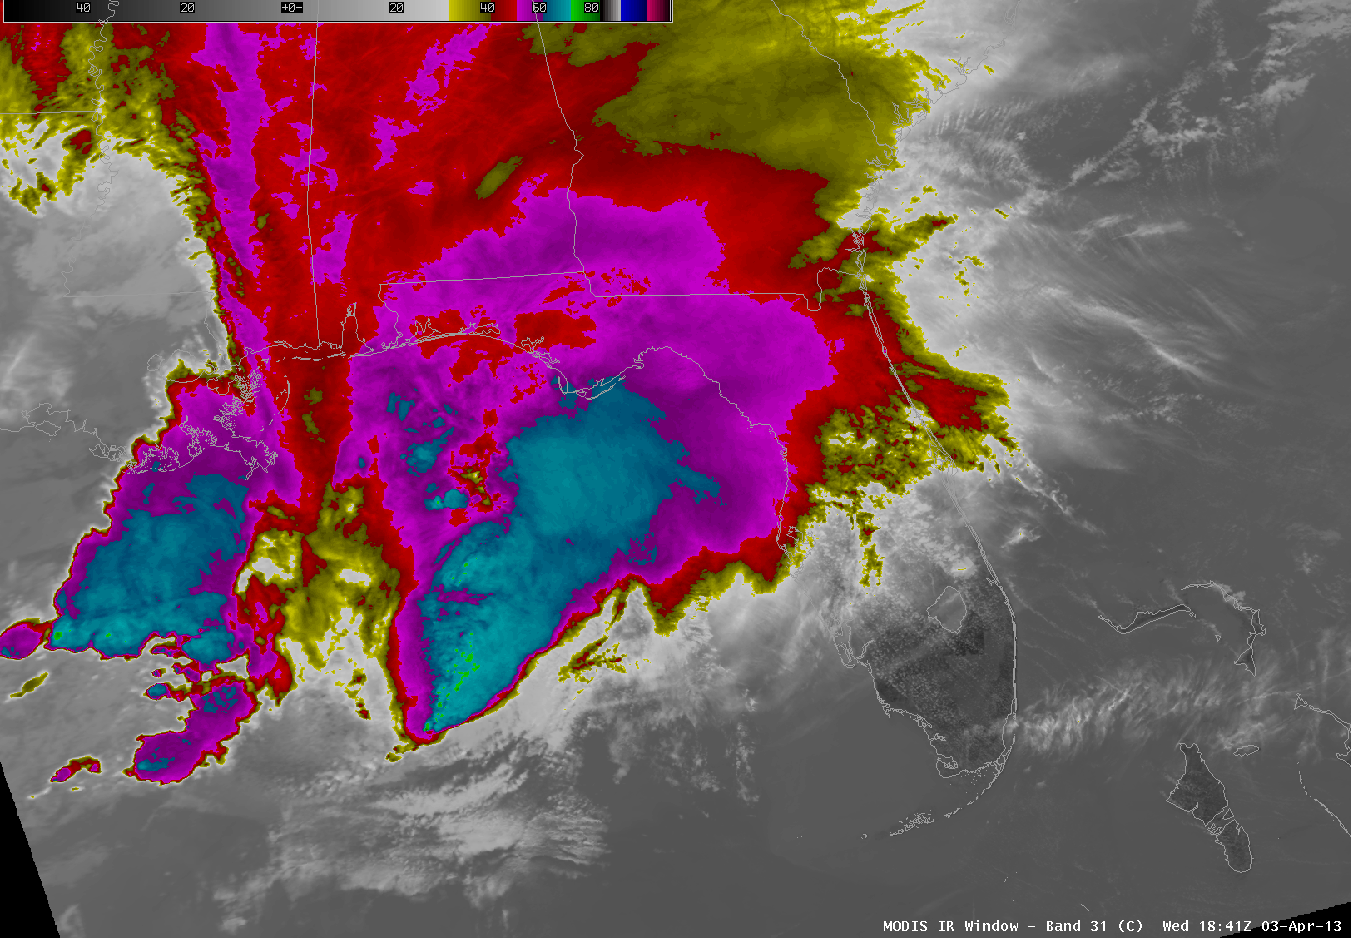
05 April 2013. The Day/Night Band revealed numerous bright streaks denoting cloud tops illuminated by lightning activity — and the coldest cloud-top infrared brightness temperature was -89C
(darker violet color enhancement).
Overlays of conventional lightning data (below) showed that there were 1493 negative and 180 positive cloud-to-ground strikes detected within a 15-minute period across that region.

Suomi NPP VIIRS Day/Night Band (0.7 µm) image with overlays of positive and negative cloud-to-ground lightning strikes [click to enlarge]
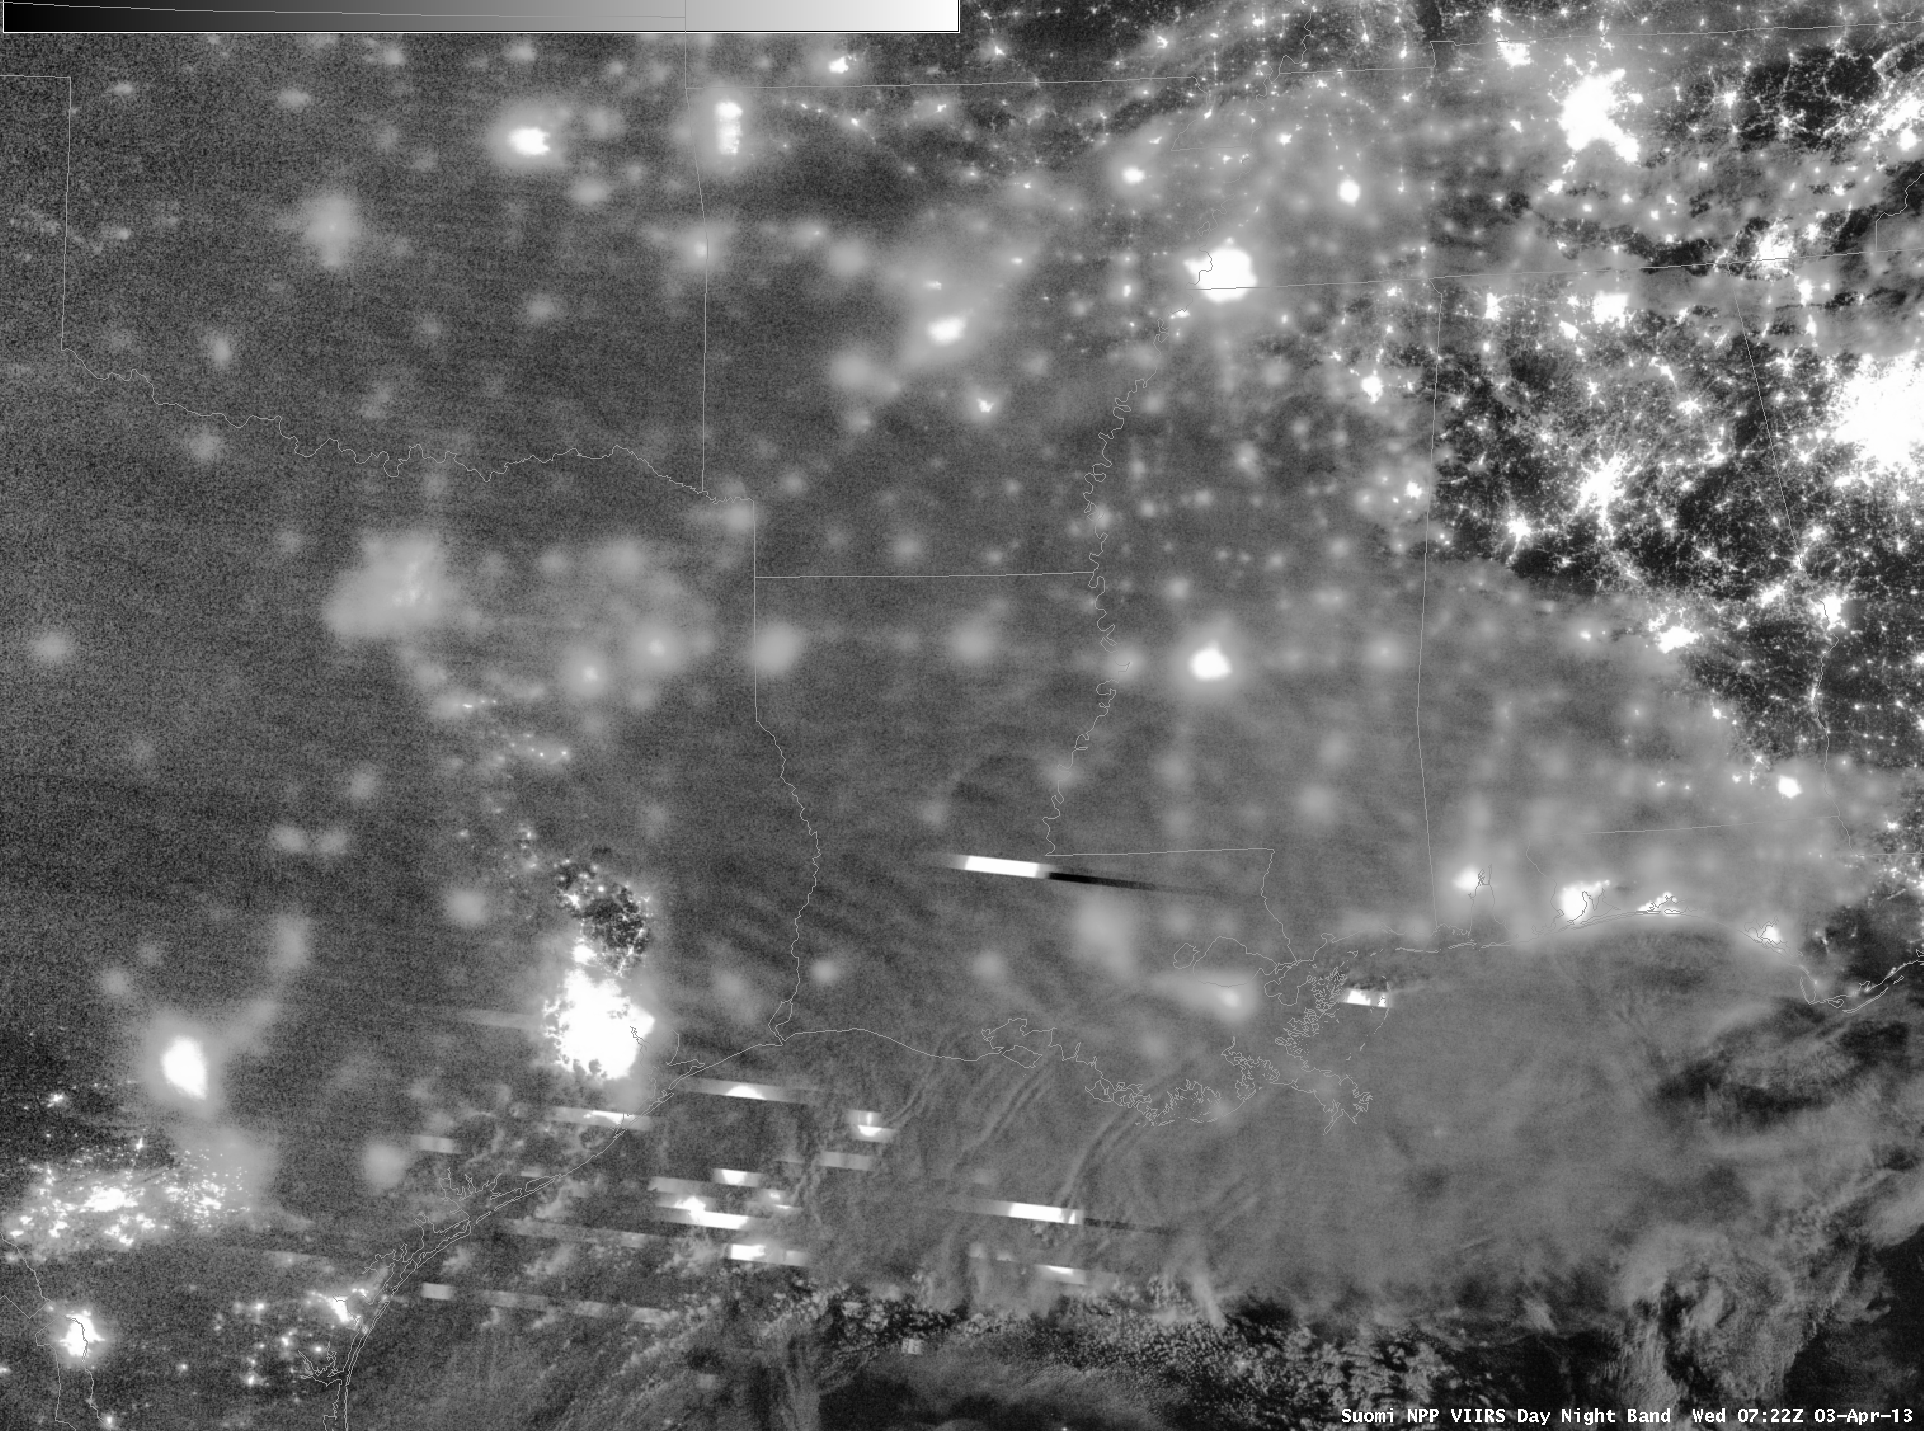
One subtle feature seen on the VIIRS Day/Night Band image was the presence of concentric waves propagating northward through eastward away from the core of the convective complex
(below). These features were “mesospheric airglow waves” — essentially “night glow” emitted from a variety of high-altitude
(80-105 km) gases (primarily the
sodium layer) near the mesopause — that were forced by the intense convective complex in the troposphere. Note that these mesospheric airglow waves do not show up on the corresponding VIIRS Infrared Window image.
")
Suomi NPP VIIRS Day/Night Band (0.7 µm) image (highlighting the appearance of mesospheric airglow waves) [click to enlarge]
The signature of mesospheric airglow waves was also seen on the previous night
(below), again forced by intense convection in the Gulf of Mexico.

Suomi NPP VIIRS Day/Night Band (0.7 µm) and Infrared Window (11.45 µm) images [click to enlarge]
Thanks to Steve Miller (CIRA) for offering an explanation of these wave features, and providing the reference
“Suomi satellite brings to light a unique frontier of nighttime environmental sensing capabilities”
===== 08 April Update =====
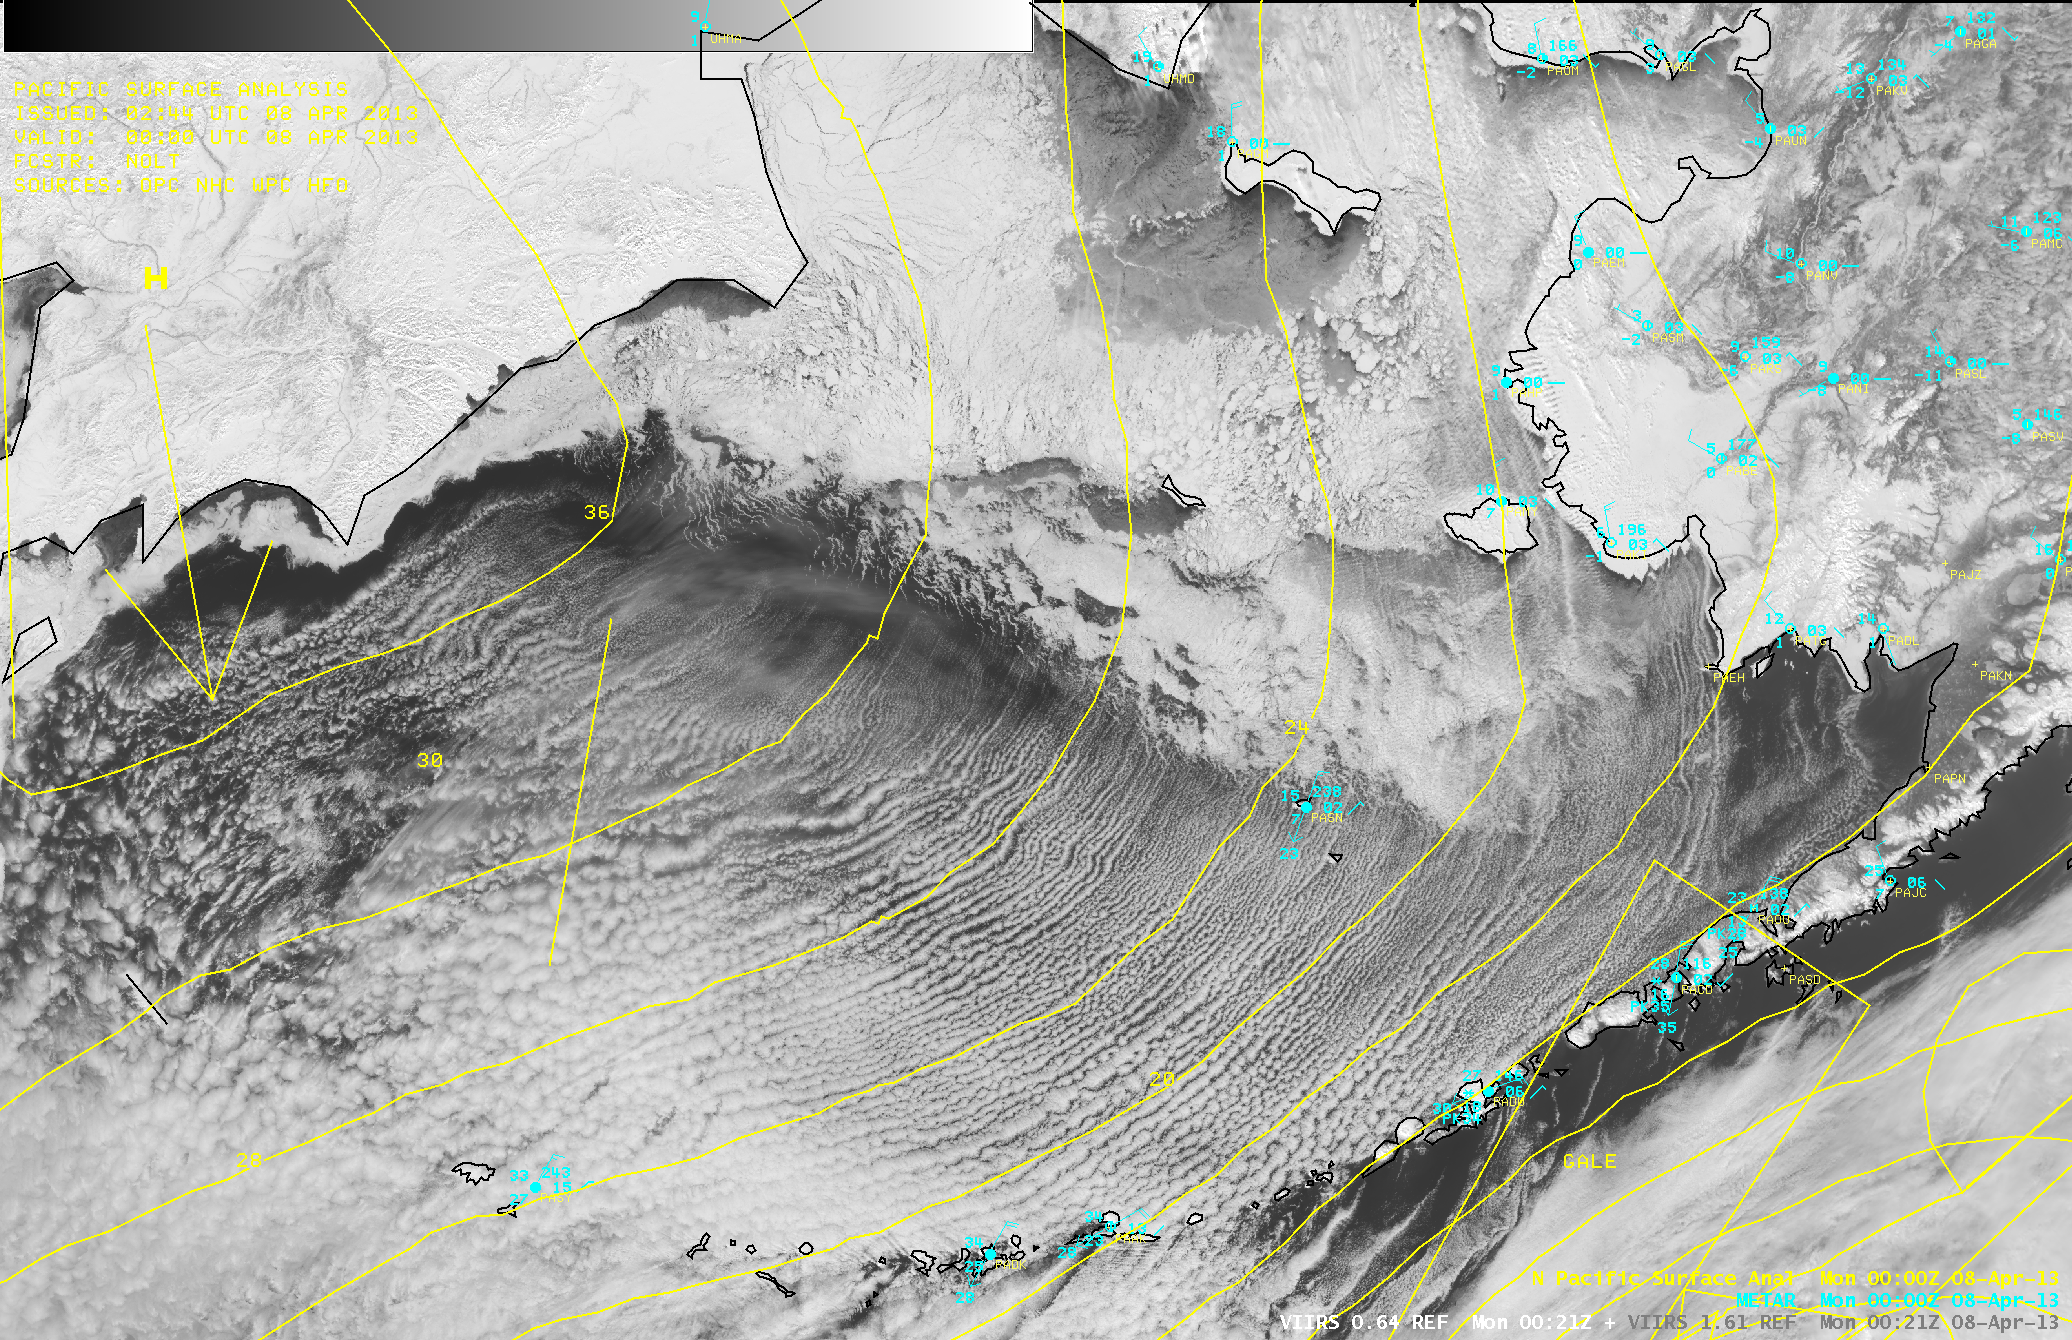
A few days later, yet another example of mesospheric airglow waves was seen in Day/Night Band imagery — but in this case, the waves were forced not by deep tropospheric convection, but by the interaction of strong winds with the rugged topography of the Southwest US. The flow throughout the depth of the troposphere was quite strong as a 120-knot jet upper-tropospheric jet streak was moving southward along the west side of a trough that was deepening over the western US on 08 April 2013. A series of mesospheric airglow waves could be seen traveling southeastward across the Gulf of California and adjacent portions of Baja California and Mexico at 09:10 UTC or 2:10 AM local time (below). Again, note that there was no wave signature apparent on the corresponding VIIRS Infrared Window image.

Suomi NPP VIIRS Day/Night Band (0.7 µm) and Infrared Window (11.45 µm) images [click to enlarge]
During the subsequent daytime hours, GOES-15
(GOES-West) and GOES-13
(GOES-East) Water Vapor (6.5 µm) images
(below) revealed a complex pattern of mountain waves across the region — surface wind gusts were as high as 88 mph in California, 70 mph in Nevada, and 63 mph in Arizona.
 and GOES-13 (right) 6.5 µm water vapor channel images (click image to play animation)")
GOES-15 (left) and GOES-13 (right) Water Vapor (6.5 µm) water vapor images [click image to play animation]
View only this post
Read Less
 image")

 and GOES-13 (right) 6.5 µm water vapor channel images (click image to play animation)")

