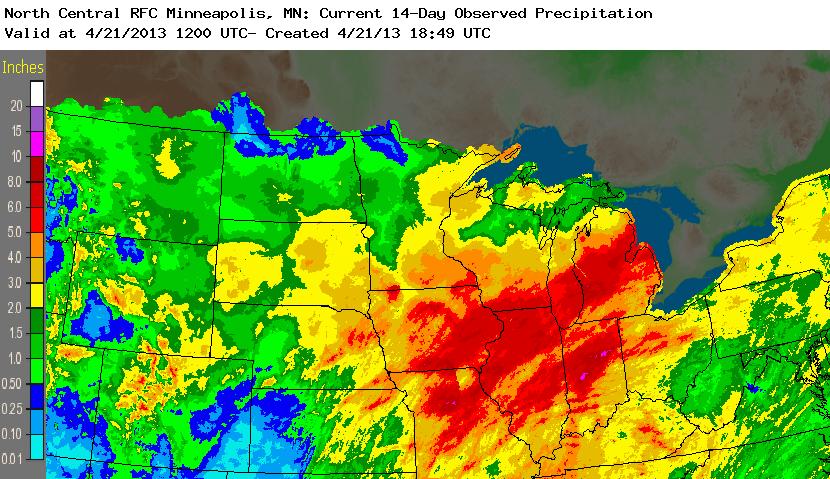
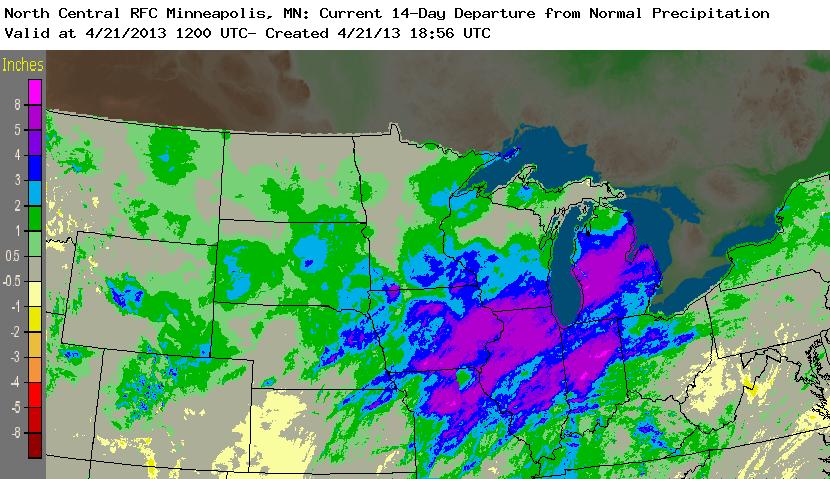
Total observed precipitation during the 07-21 April 2013 period
The middle part of April 2013 brought periods of very heavy rainfall to portions of Illinois and the Upper Midwest region, with many areas receiving 5-7 inches of rainfall. A map of the 14-day total observed precipitation during the 07-21 April period (above) shows the widespread distribution of the heavy rainfall, which was 4-5 inches above normal and 300-400% of normal at many locations for this time of the year. Additional information can be found at the NWS Chicago and NWS Lincoln sites.
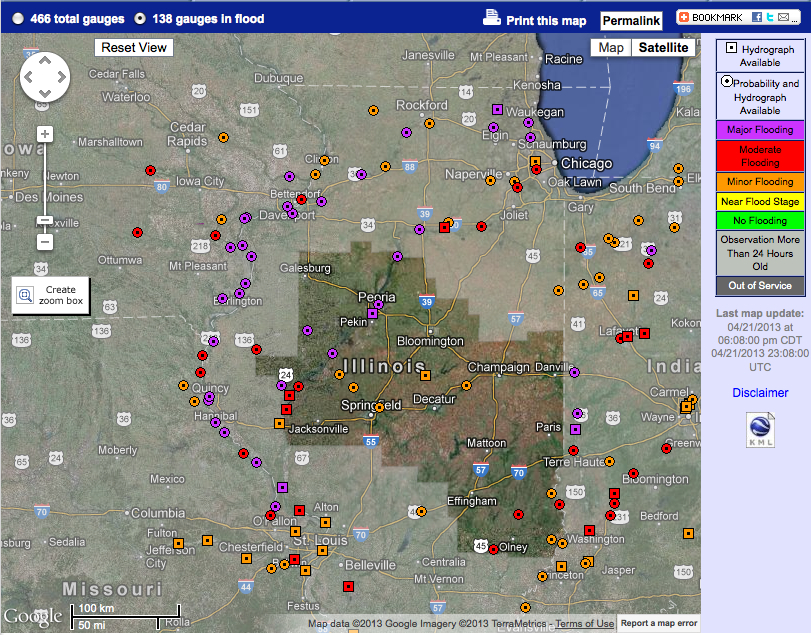
The effect of this heavy rainfall was very apparent in a before (05 April) and after (21 April) comparison of 250-meter resolution MODIS false-color Red/Green/Blue (RGB) images from the SSEC MODIS Today site (below) — obvious changes can be seen in the width of sections of the Illinois River (which runs fron northeast through southwest across the center of the images) and many of its tributaries. 138 river gauges were reporting moderate to major flooding levels on 21 April.
MODIS false-color Red/Green/Blue (RGB) images from 05 April and 21 April 2013
AWIPS image comparisons of the standard 0.64/0.65 µm visible channel with the corresponding 0.86 µm visible channel from the VIIRS and MODIS instruments (below) show that the 0.86 µm imagery can be useful for helping to monitor the areal coverage of significant water inundation following heavy rainfall events such as this. Rivers, lakes, and flooded areas show up as darker features on the 0.86 µm images.
Suomi NPP VIIRS 0.64 µm visible and 0.86 µm visible channel images
MODIS 0.65 µm (Band 1) visible channel and 0.86 µm (Band 2) visible channel images
View only this post Read Less
")

 image (displayed using Google Earth)")

 and 3.9 µm shortwave IR (right) images (click image to play animation)")

