An unusually intense (by early October standards) mid-latitude cyclone produced a variety of weather extremes across the parts of the north-central US during the 04 October to 05 October 2013 period. In the cold sector of... Read More
")
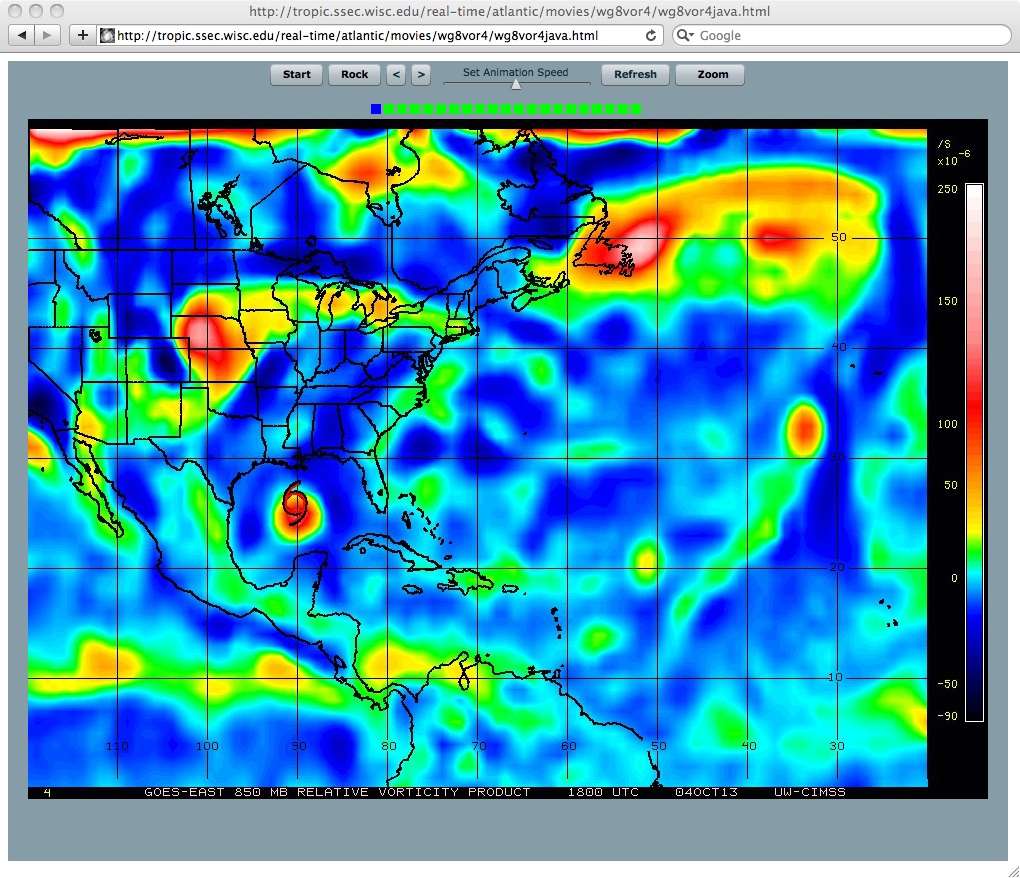
GOES-13 Water Vapor (6.5 µm) images, with hourly plots of surface weather type [click to play animation]
An unusually intense (by early October standards) mid-latitude cyclone produced a variety of weather extremes across the parts of the north-central US during the
04 October to
05 October 2013 period. In the cold sector of the storm system, western South Dakota received record-breaking snowfall and prolonged blizzard conditions, with widespread power outages and livestock losses being two of the major impacts. The early evolution of the storm could be seen on 4-km resolution GOES-13
(GOES-East) Water Vapor (6.5 µm) images
(above). Surface weather symbols
(including precipitation type) are also plotted on the water vapor images. The GOES-13 satellite had been placed into Rapid Scan Operations (RSO) mode during much of this time, providing images as frequently as every 5-10 minutes.
 and GOES-13 (right) 0.63 µm visible channel images (click to play animation)")
GOES-15 (left) and GOES-13 (right) Visible (0.63 µm) images, with hourly plots of surface reports [click to play animation]
In the warm sector of the storm system, severe thunderstorms produced numerous tornadoes and hail as large as 2.75 inches in diameter (
SPC storm reports), primarily across eastern Nebraska into Iowa. A very large tornado produced EF-4 damage in the Wayne, Nebraska area — the development of this storm could be seen on 1-km resolution 0.63 µm visible channel images
(above) and 4-km resolution 10.7 µm IR channel images
(below) from the GOES-15
(GOES-West) and GOES-13
(GOES-East) satellite perspectives. Wayne
(station identifier KLCG) is located in the center of the visible and IR images; note that the hourly plotted weather observations for Wayne disappeared after 22 UTC, due to the fact that the airport weather instruments were damaged by the tornado.
 and GOES-13 (right) 10.7 µm IR channel images (click to play animation)")
GOES-15 (left) and GOES-13 (right) Infrared Window (10.7 µm) images, with hourly plots of surface reports [click to play animation]
GOES-13 0.63 µm visible channel images with overlays of the corresponding University of Wisconsin GOES-13 IR Cloud Top Cooling Rate (CTCR) product (below) indicated that CTCR values exceeded 30 degrees Kelvin per 15 minutes (darker blue color enhancement) at 20:45 UTC as the thunderstorm that produced the Wayne tornado was rapidly developing in northeastern Nebraska.
")
GOES-13 Visible (0.63 µm) visible images + IR Cloud Top Cooling Rate [click to play animation]
===== 07 October Update =====
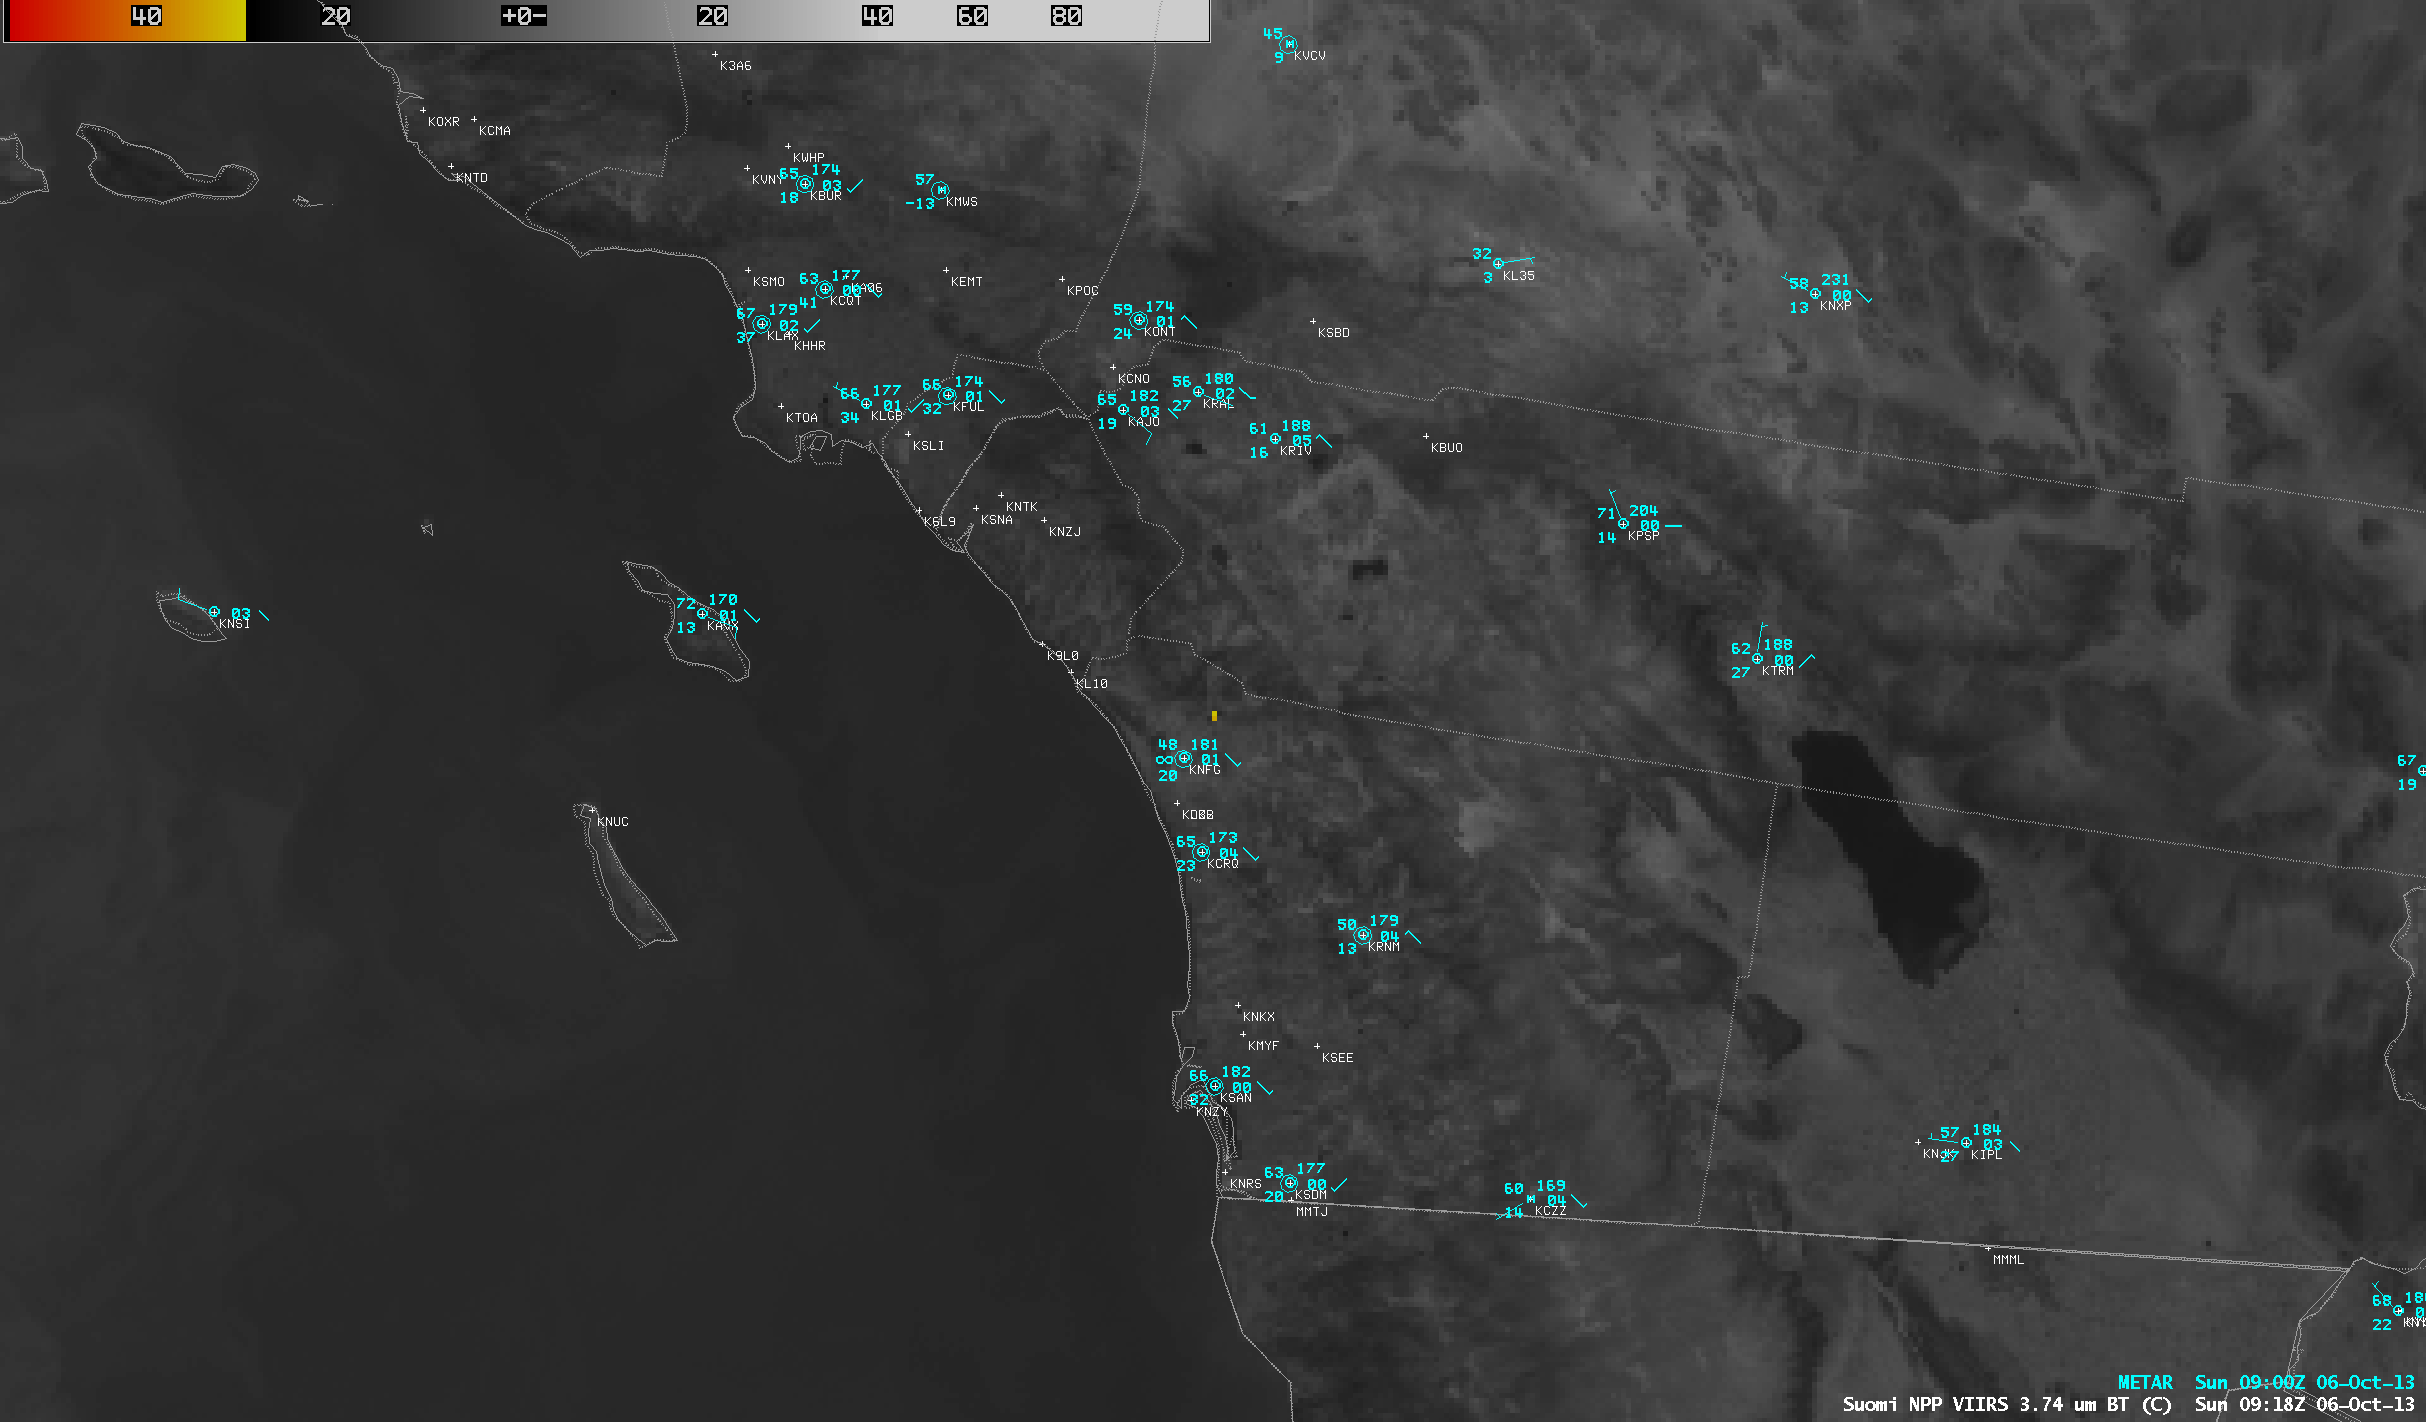
High spatial resolution imagery from Low Earth Orbit (LEO) or “polar-orbiting” satellites can be useful for post-case analysis — with this particular storm, helping to determine the areal coverage of the resulting snowfall, and identifying a tornado damage path.
 image")
Suomi NPP VIIRS 0.64 µm visible channel and false-color Red/Green/Blue (RGB) images [click to enlarge]
Once the large cloud shield associated with the storm system moved eastward, a comparison of 375-meter resolution
(projected onto a 1-km AWIPS grid) Suomi NPP VIIRS 0.64 µm visible channel and false-color Red/Green/Blue (RGB) images from 06 October
(above) showed the widespread area of snow cover
(which appeared as darker shades of red on the RGB image) over the western third of South Dakota as well as adjacent portions of Wyoming, Nebraska, North Dakota, and Montana. Terrain had an important influence in both the amount and the coverage of snowfall — it is especially interesting to note the areas of bare ground
(shades of cyan in the RGB image) immediately downwind (south and southwest) of the Black Hills, where downsloping winds helped keep the precipitation type as rain (
AWIPS-2 animation including topography). Aided by upslope flow, as much as
58 inches of snowfall was reported in the northern Black Hills of South Dakota. Note that much of the Black Hills appear darker on the visible and false-color images, due to the high density of coniferous trees — but there was still significant snow cover on the ground.
In addition, a comparison of before (28 September) and after (07 October) 250-meter resolution MODIS true-color RGB images from the SSEC MODIS Today site (below) revealed the southwest-to-northeast oriented damage path from the large tornado which produced EF-4 damage in the Wayne, Nebraska area (NWS Omaha news story).

MODIS true-color RGB images [click to enlarge]
View only this post
Read Less
")
")
")
")
 and 3.9 µm shortwave IR (right panel) images (click to play animation)")
")
 and GOES-13 (right) 0.63 µm visible channel images (click to play animation)")
 and GOES-13 (right) 10.7 µm IR channel images (click to play animation)")
")
")
")
")

