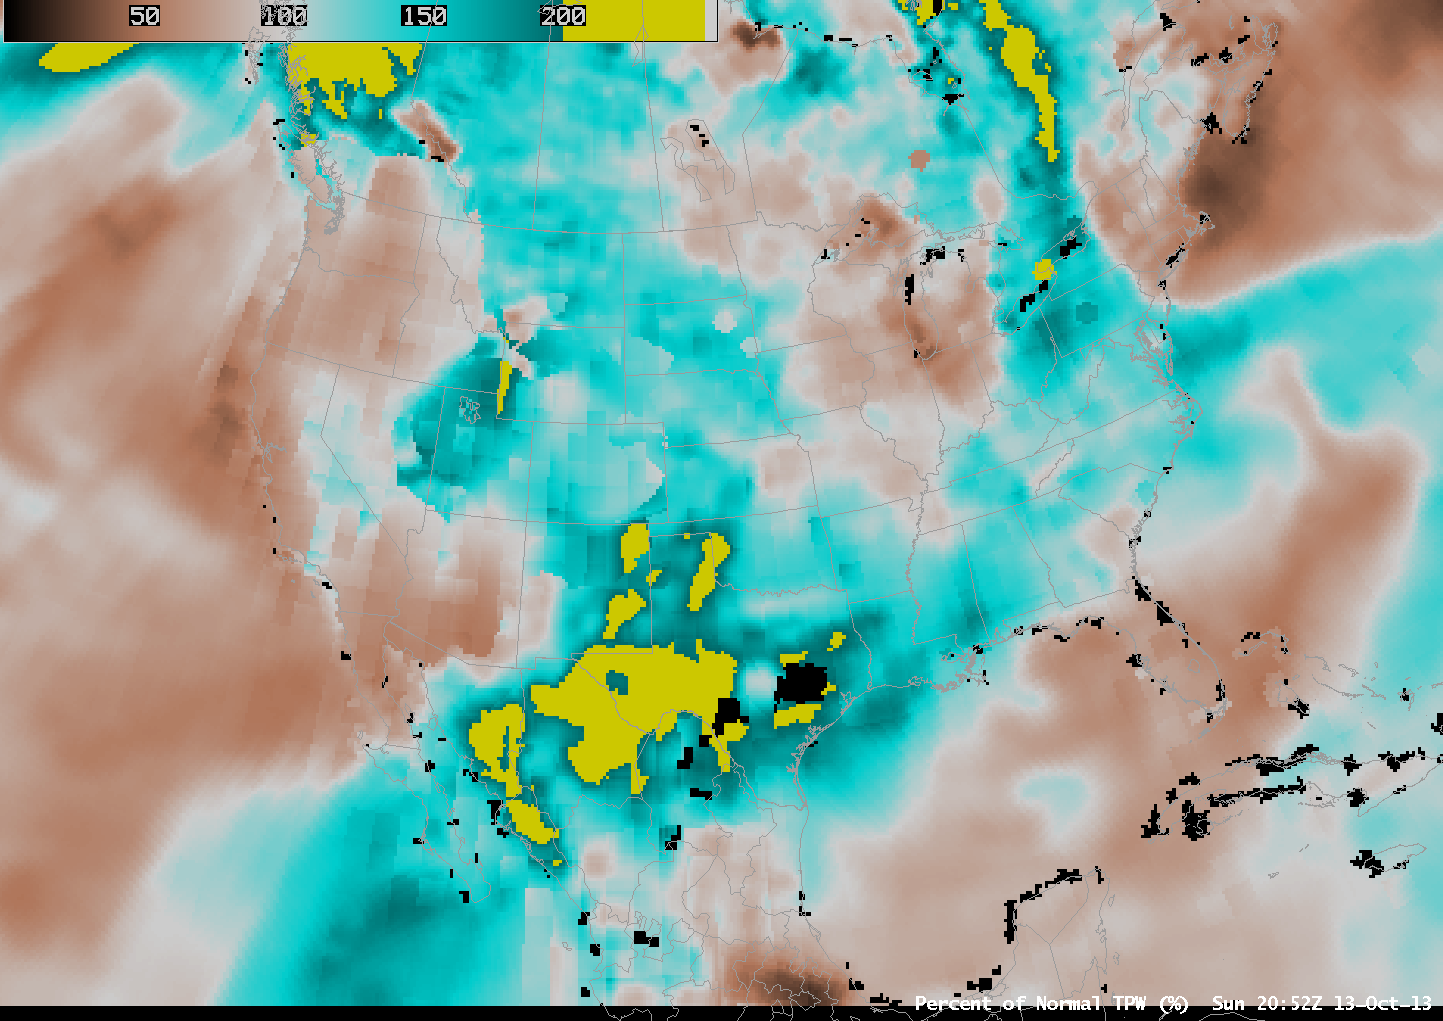
Flooding rains have occurred over south Texas during the past two days, and the animation of GOES water vapor imagery, above, and of MIMIC Total Precipitable Water, below, shows two airstreams moving moisture into that region. The GOES-15/GOES-13 Water Vapor image animation, above, shows upper-level moisture moving in from the... Read More
")
GOES-15/GOES-13 6.5 µm water vapor channel images (click to play animation)
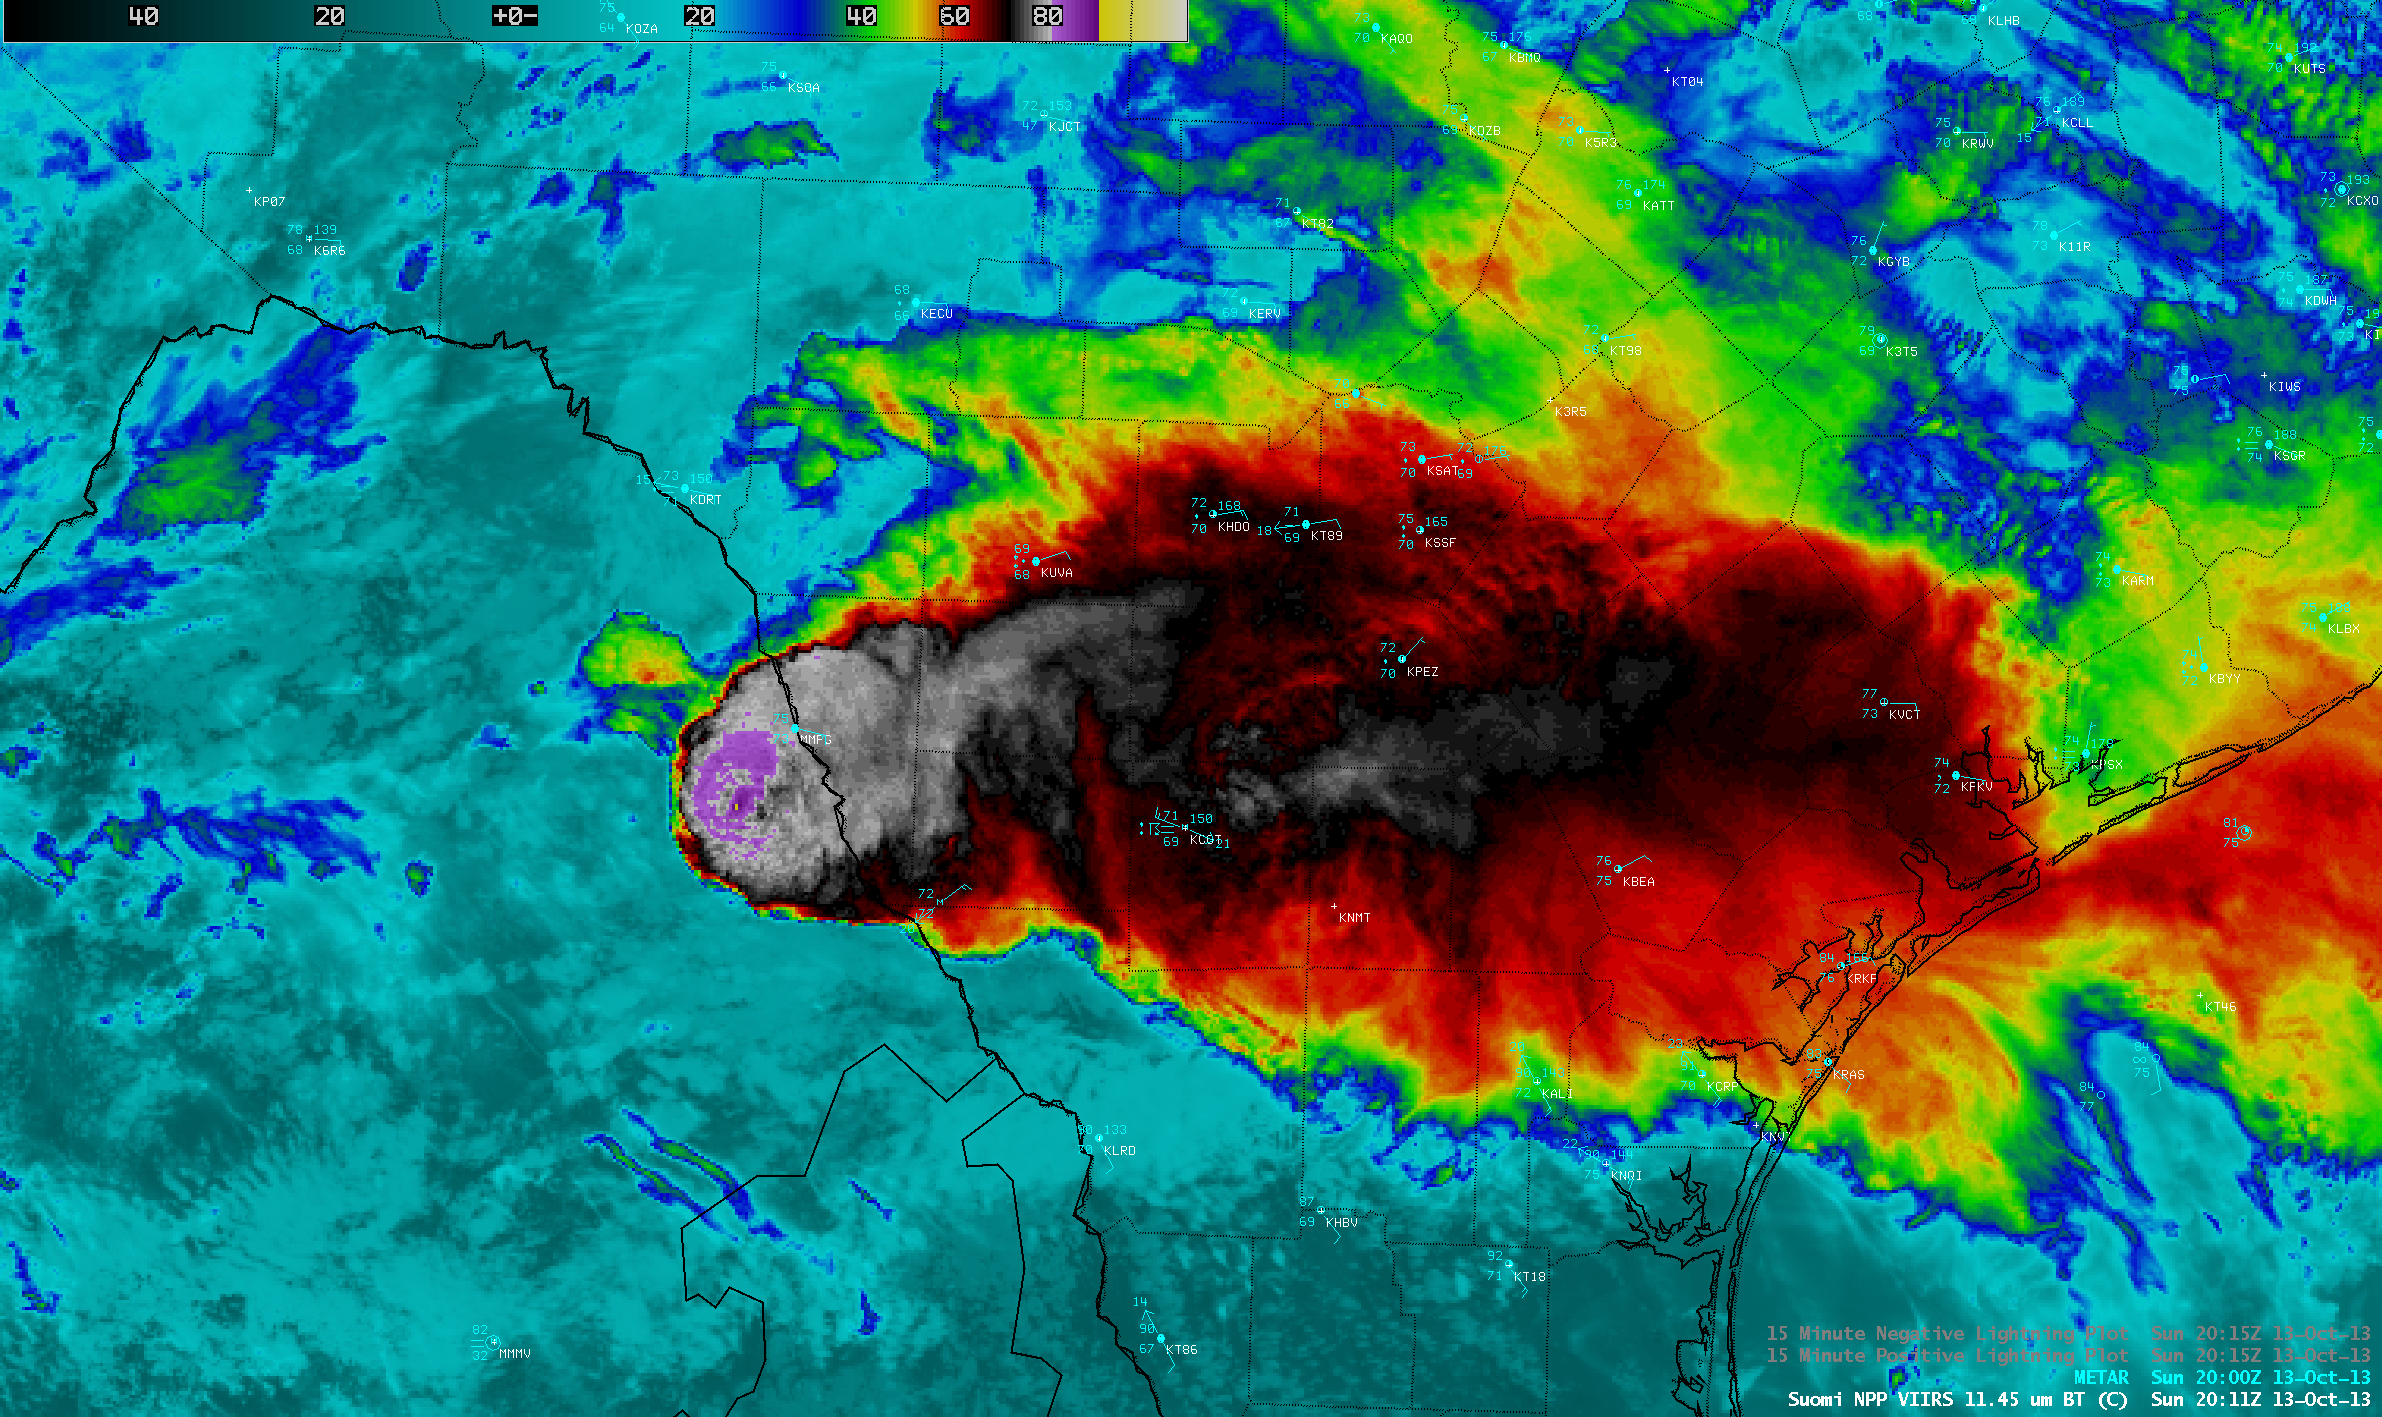
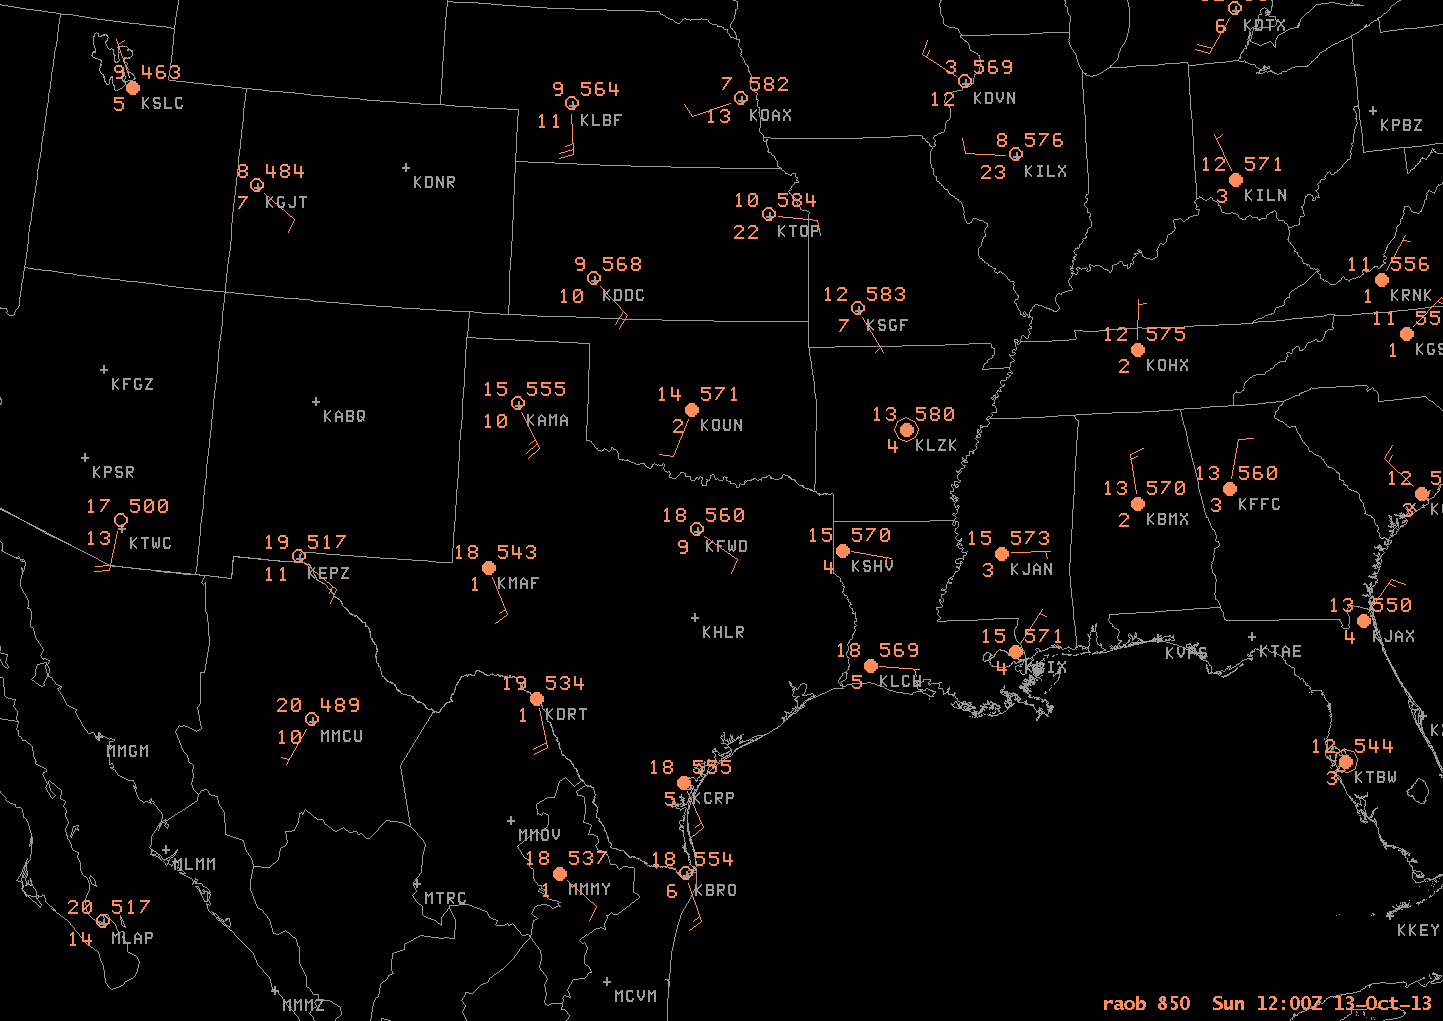
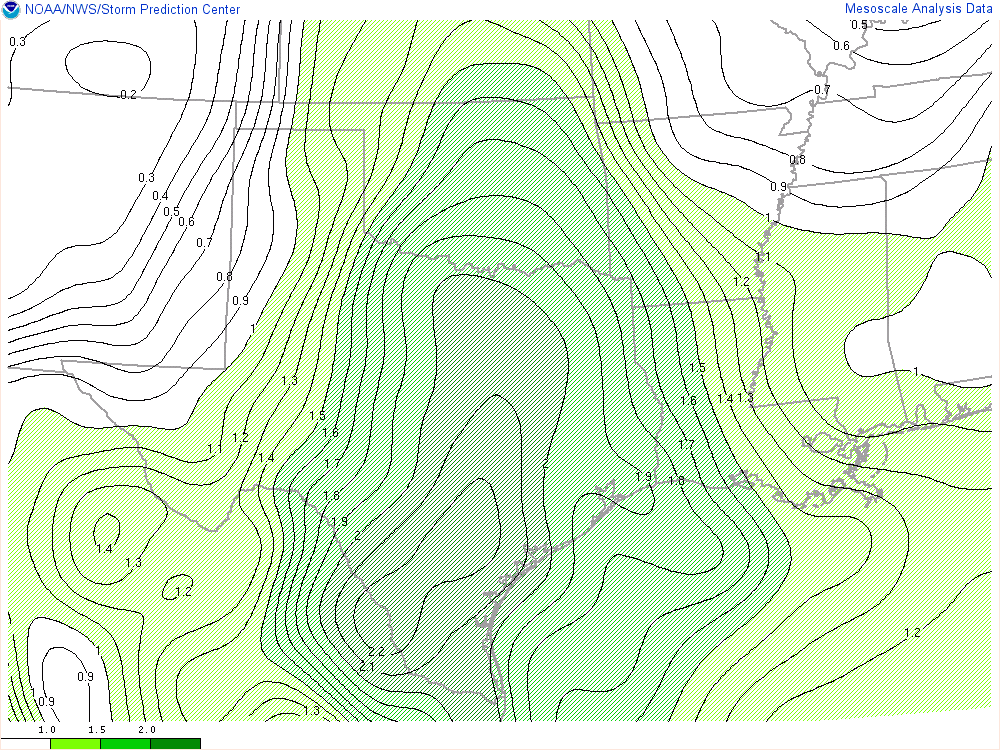
Flooding rains have occurred over south Texas during the past two days, and the animation of GOES water vapor imagery, above, and of MIMIC Total Precipitable Water, below, shows two airstreams moving moisture into that region. The GOES-15/GOES-13 Water Vapor image animation, above, shows upper-level moisture moving in from the tropical Pacific south of Mexico (much of it likely outflow from Tropical Storm Octave). MIMIC Total Precipitable Water animation (available from this site), below, shows a concomitant lower-level moisture source, the Gulf of Mexico. Plots at 925 mb, and 850 mb, show moist, easterly flow around a High centered over the mid-Mississippi valley. As a result, total precipitable water values exceeded 200% of normal over a wide region. (Blended Total Precipitable Water products are available here). The high values of Total Precipitable Water persist into the day on 14 October. (Link, analysis from SPC).
")
MIMIC Total Precipitable Water (click to play animation)
")
VIIRS 11.45 µm IR image (click to enlarge)
A Suomi-NPP VIIRS 11.45 µm IR image from late in the day on 13 October (above) showed strong convection near Laredo, TX, with very cold cloud tops (brightness temperature values over Mexico are as cold as -92º C!). Applying a different color enhancement, a comparison of this 1-km resolution VIIRS IR image at 20:11 UTC with the corresponding 4-km resolution GOES-13 10.7 µm IR image (below) highlights two advantages of polar orbiter imagery over geostationary imagery: (1) with the higher spatial resolution, the magnitude of the coldest overshooting cloud tops can be assessed: the -92º C minimum cloud-top IR brightness temperature on the VIIRS image was 14º C colder than the -78º C value seen on the GOES-13 image, and (2) with the minimal parallax error of polar orbiter imagery, the exact location of such cloud-top features can be more accurately determined.

Suomi NPP VIIRS 11.45 µm IR and GOES-13 10.7 µm IR channel images
The result of the strong convection near 2100 UTC, and from other convection apparent in the water vapor animation at top, was a broad region of heavy rains, (obtained from this site) shown below. Some of these rains fell over regions of Texas in drought (as shown here), so where damage was minimal, the heavy rains could be considered beneficial.
")
24-hour precipitation over Texas valid 1200 UTC 14 October from this site (click to enlarge)
View only this post
Read Less
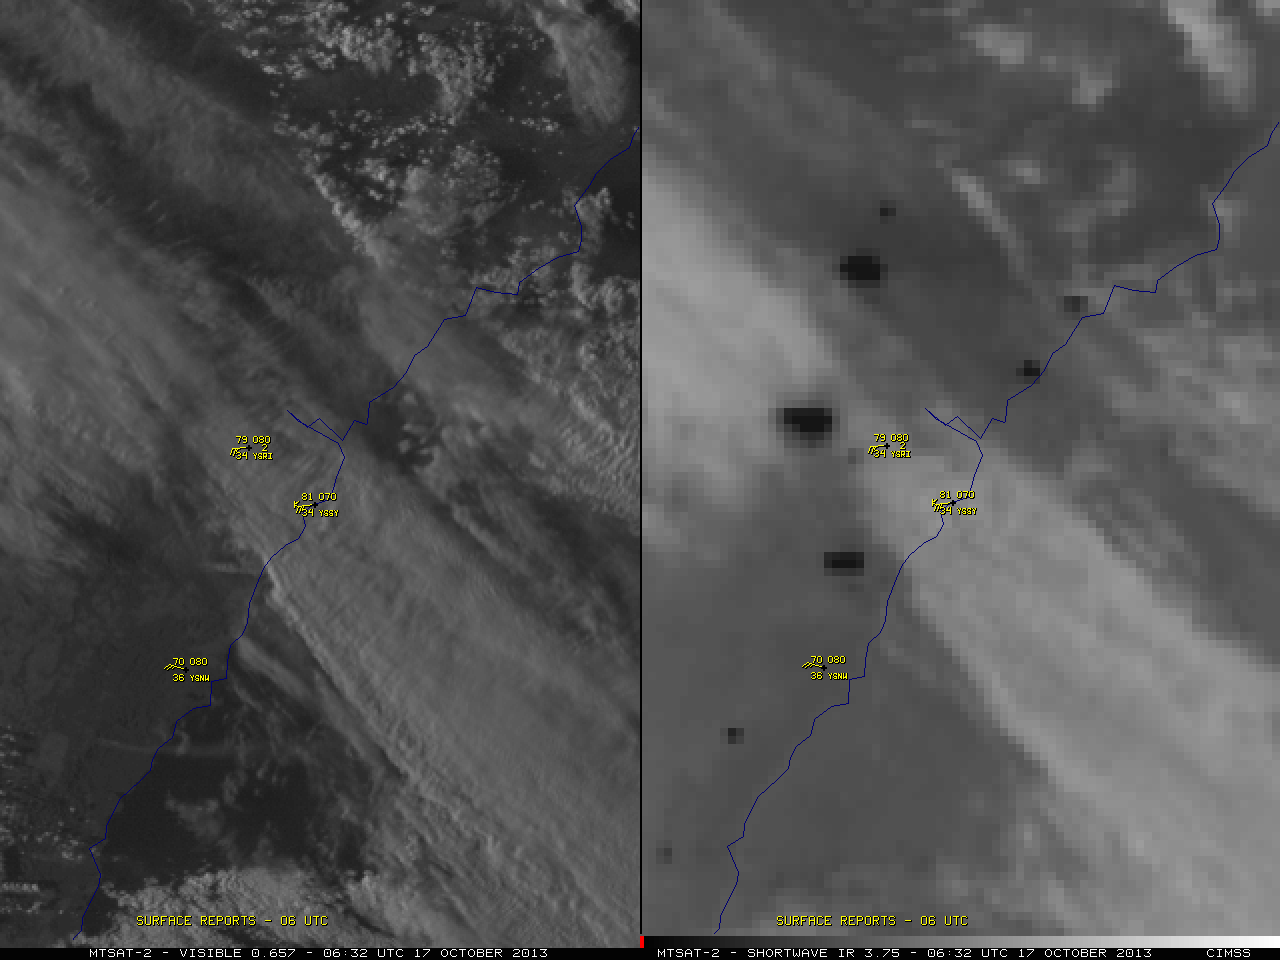
 and shortwave IR channel (right) images (click to play animation)")


")
")
")
")
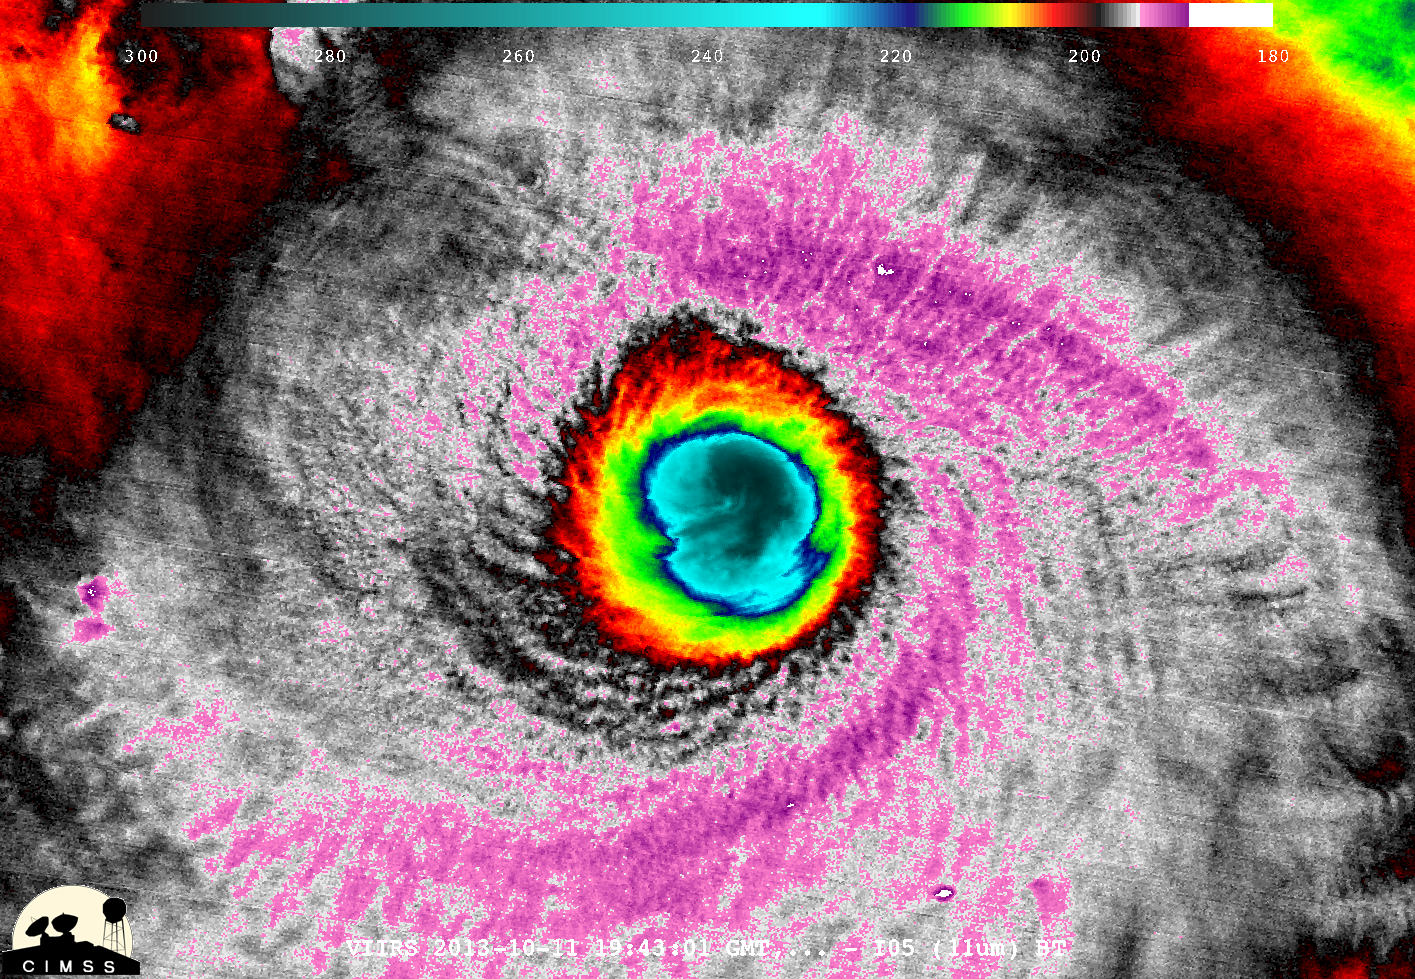

 intensity estimate plot")
")


