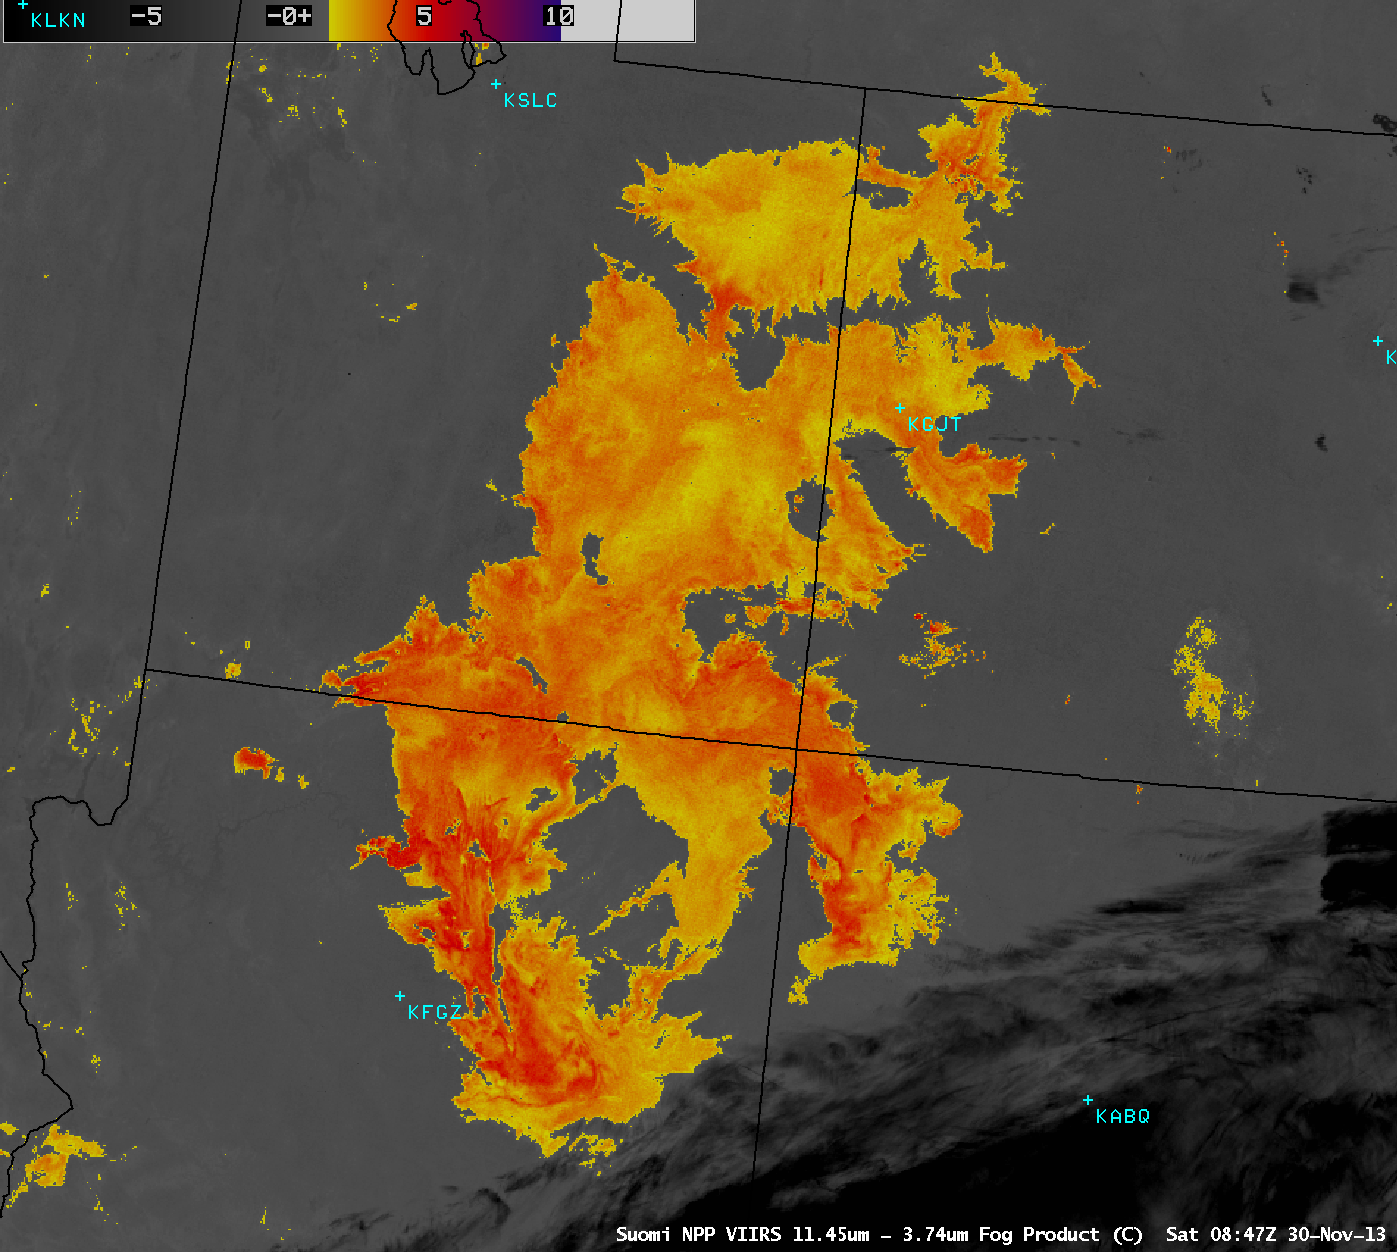
A night-time AWIPS image of the Suomi NPP VIIRS IR brightness temperature difference (BTD) “fog/stratus product” at 08:47 UTC or 1:47 AM local time (above) displayed an expansive area of fog and stratus cloud across much of the central and southern Rocky Mountains region on Read More
")
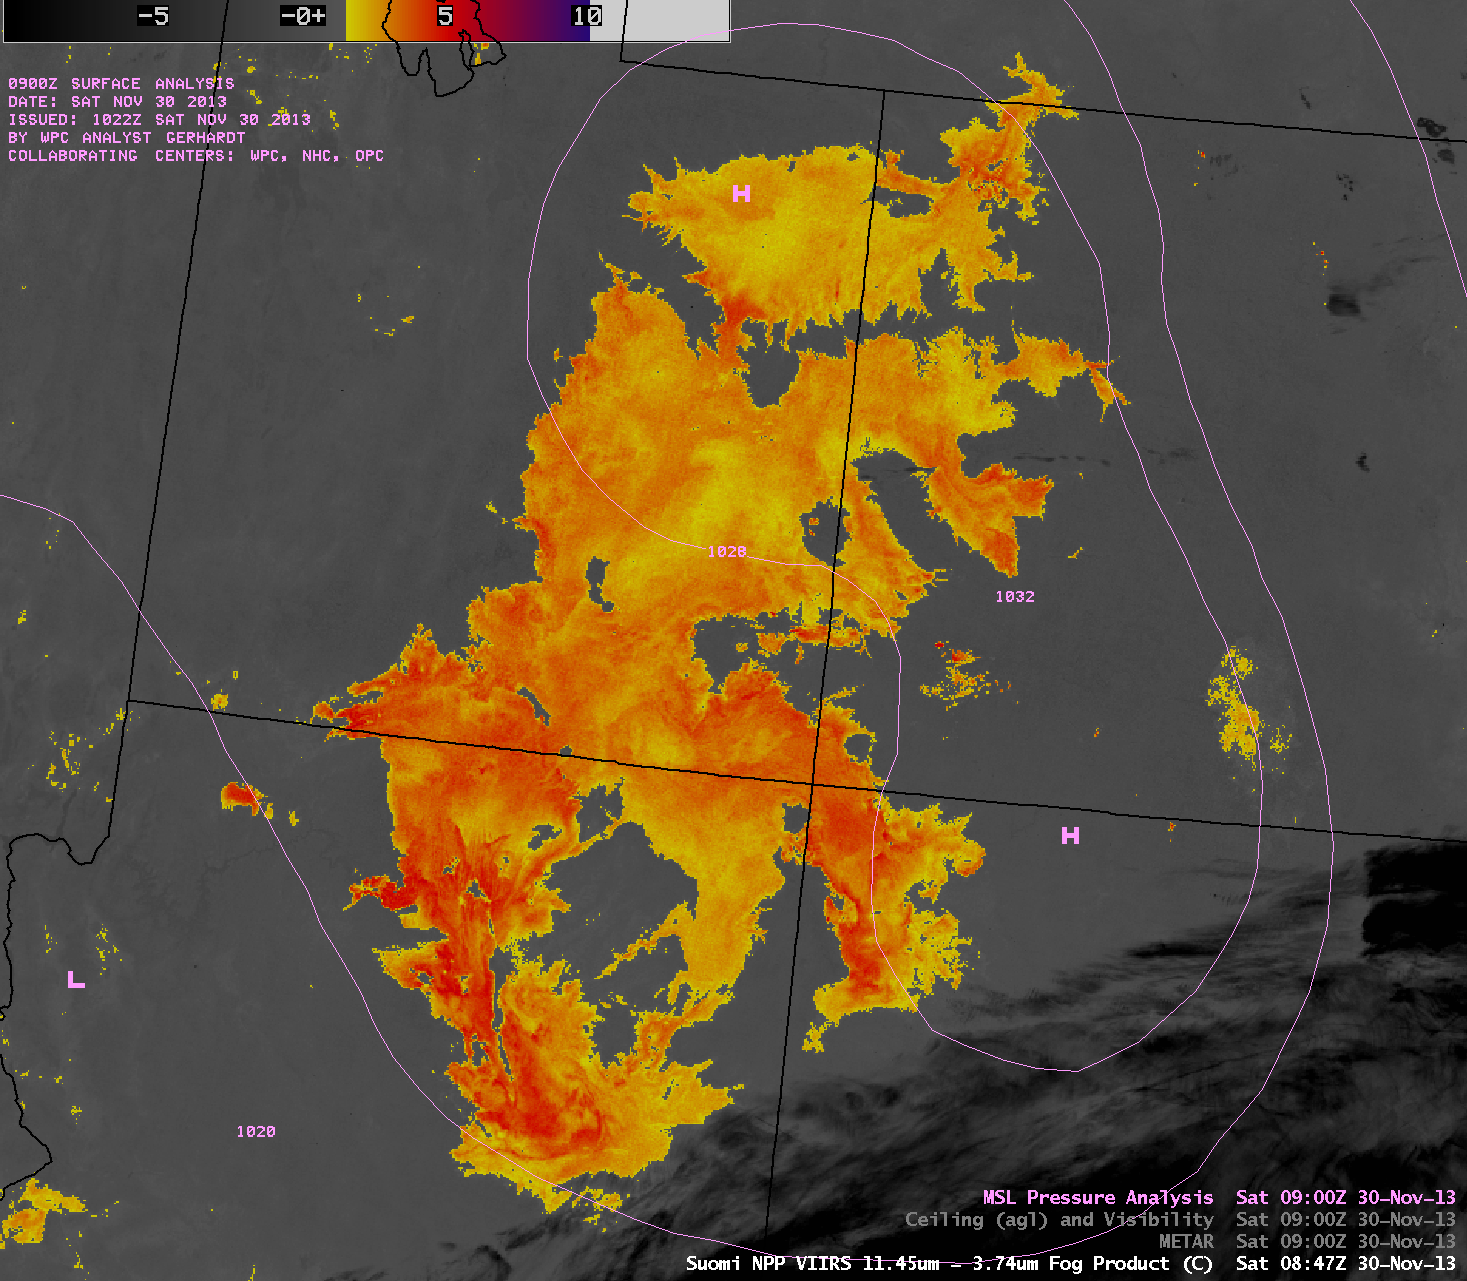
Suomi NPP VIIRS IR brightness temperature difference “fog/stratus product” (with overlays of METAR surface reports and ceilings/visibilities)
A night-time AWIPS image of the Suomi NPP VIIRS IR brightness temperature difference (BTD) “fog/stratus product” at 08:47 UTC or 1:47 AM local time (above) displayed an expansive area of fog and stratus cloud across much of the central and southern Rocky Mountains region on 30 November 2013. Overlays of the hourly METAR surface reports and plots of cloud ceilings and visibilities showed that the BTD “fog/stratus product” had no skill in determining whether there was fog or stratus cloud at any given location — and there was a lack of surface reports beneath large portions of the fog/stratus feature (especially across southwestern Utah).
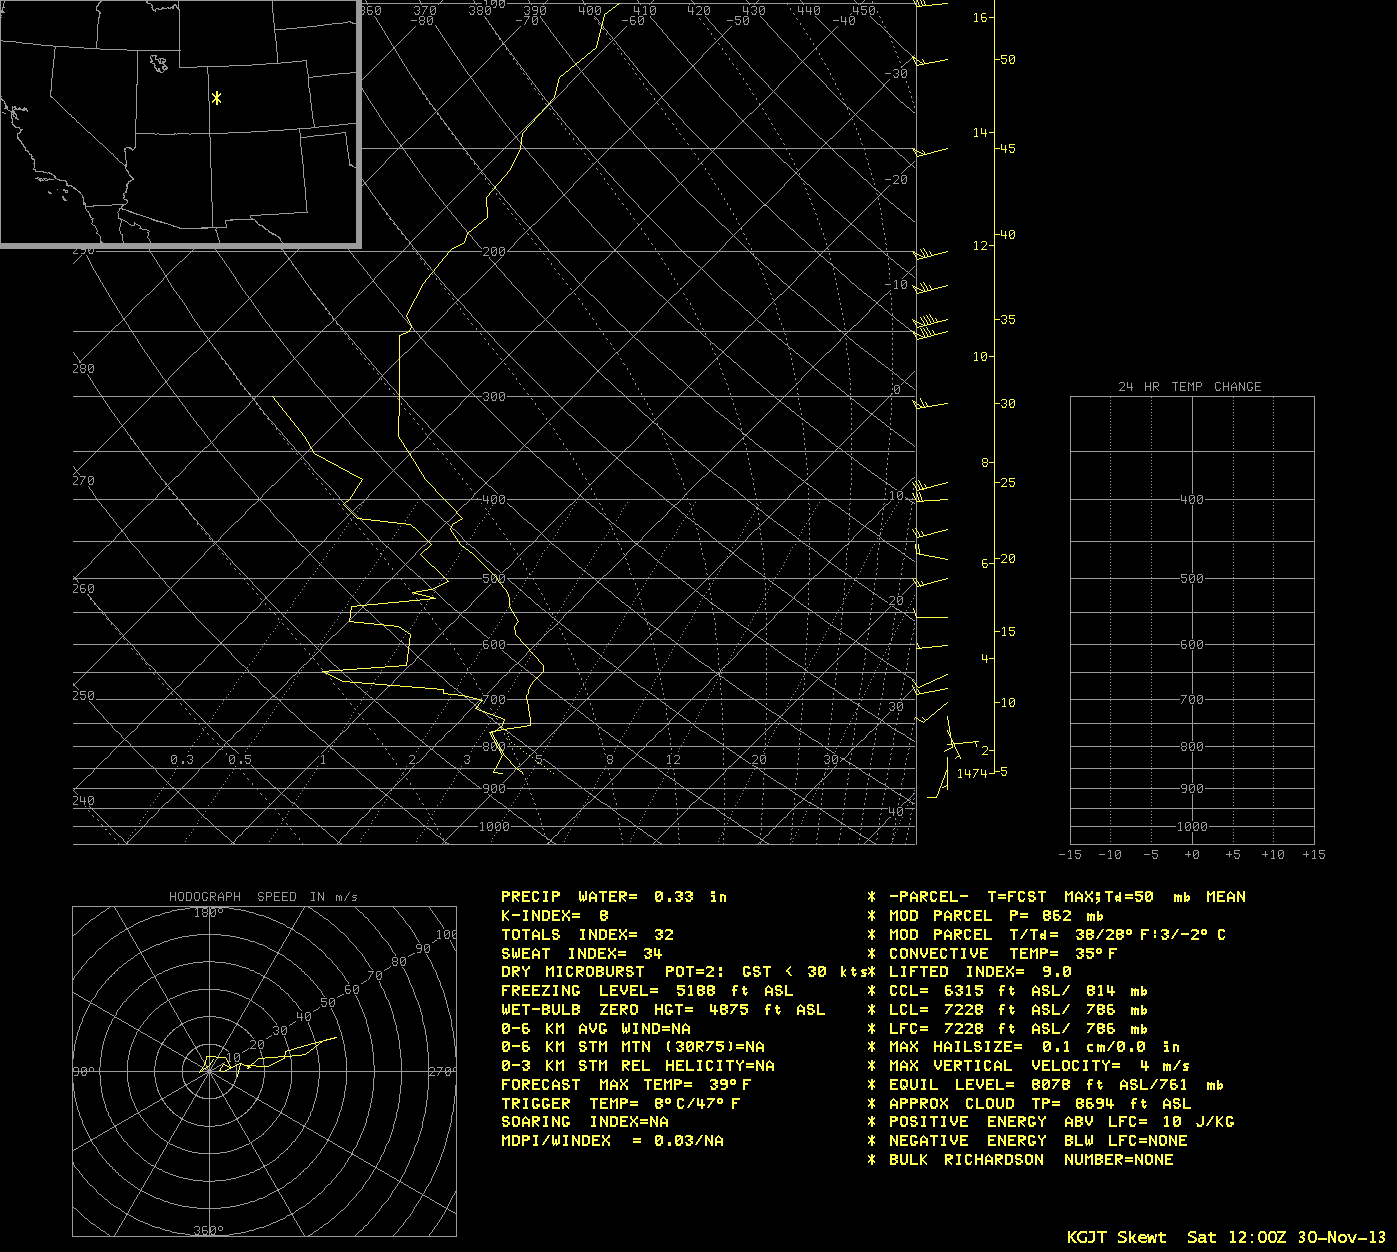
Of the 3 rawinsonde sites in that area, Grand Junction, Colorado (KGJT) was the only one that remained covered by the fog/stratus deck; their sounding profile at 12 UTC showed a very strong temperature inversion whose base was around 7943 feet (2422 meters) above the surface. With a quasi-stationary ridge of high pressure over the region, this strong capping temperature inversion helped to hold the fog in place for several days.
A comparison of the 375-meter resolution (projected onto a 1-km AWIPS grid) VIIRS BTD fog/stratus product with the corresponding 4-km resolution GOES-15 image (below) demonstrated the advantage of higher spatial resolution in helping to diagnose the locations of edges and small-scale variations in coverage of the large fog/stratus feature.

Suomi NPP VIIRS vs GOES-15 IR brightness temperature difference “fog/stratus product”
Products designed to provide qualitative information on fog and low stratus clouds have been developed for use on the future GOES-R ABI data; applying these GOES-R algorithms to current GOES-15 imagery offered some insight as to the low cloud thickness, as well as the probabilities of Marginal Visual Flight Rules (MVFR), Instrument Flight Rules (IFR), or Low Instrument Flight Rules (LIFR) conditions (below). Again, data-sparse regions such as southwestern Utah could benefit from the use of such products for aviation forecasting purposes. See the GOES-R Fog Product Examples blog for additional examples of these types of “data fusion” products.
During the subsequent daytime hours, McIDAS images of 1-km resolution GOES-15 0.63 µm visible channel data (below; click to play animation) showed that although the large area of fog/stratus persisted into the late afternoon hours, there was still a surprising amount of variability to the exact location of the edges of the features (which was likely driven by differential terrain heating and local wind circulations). Something to note in the visible imagery: fog in the eastern portion of the Grand Canyon in northern Arizona, which is apparently quite rare (photos)
")
GOES-15 0.63 µm visible channel images (click to play animation)
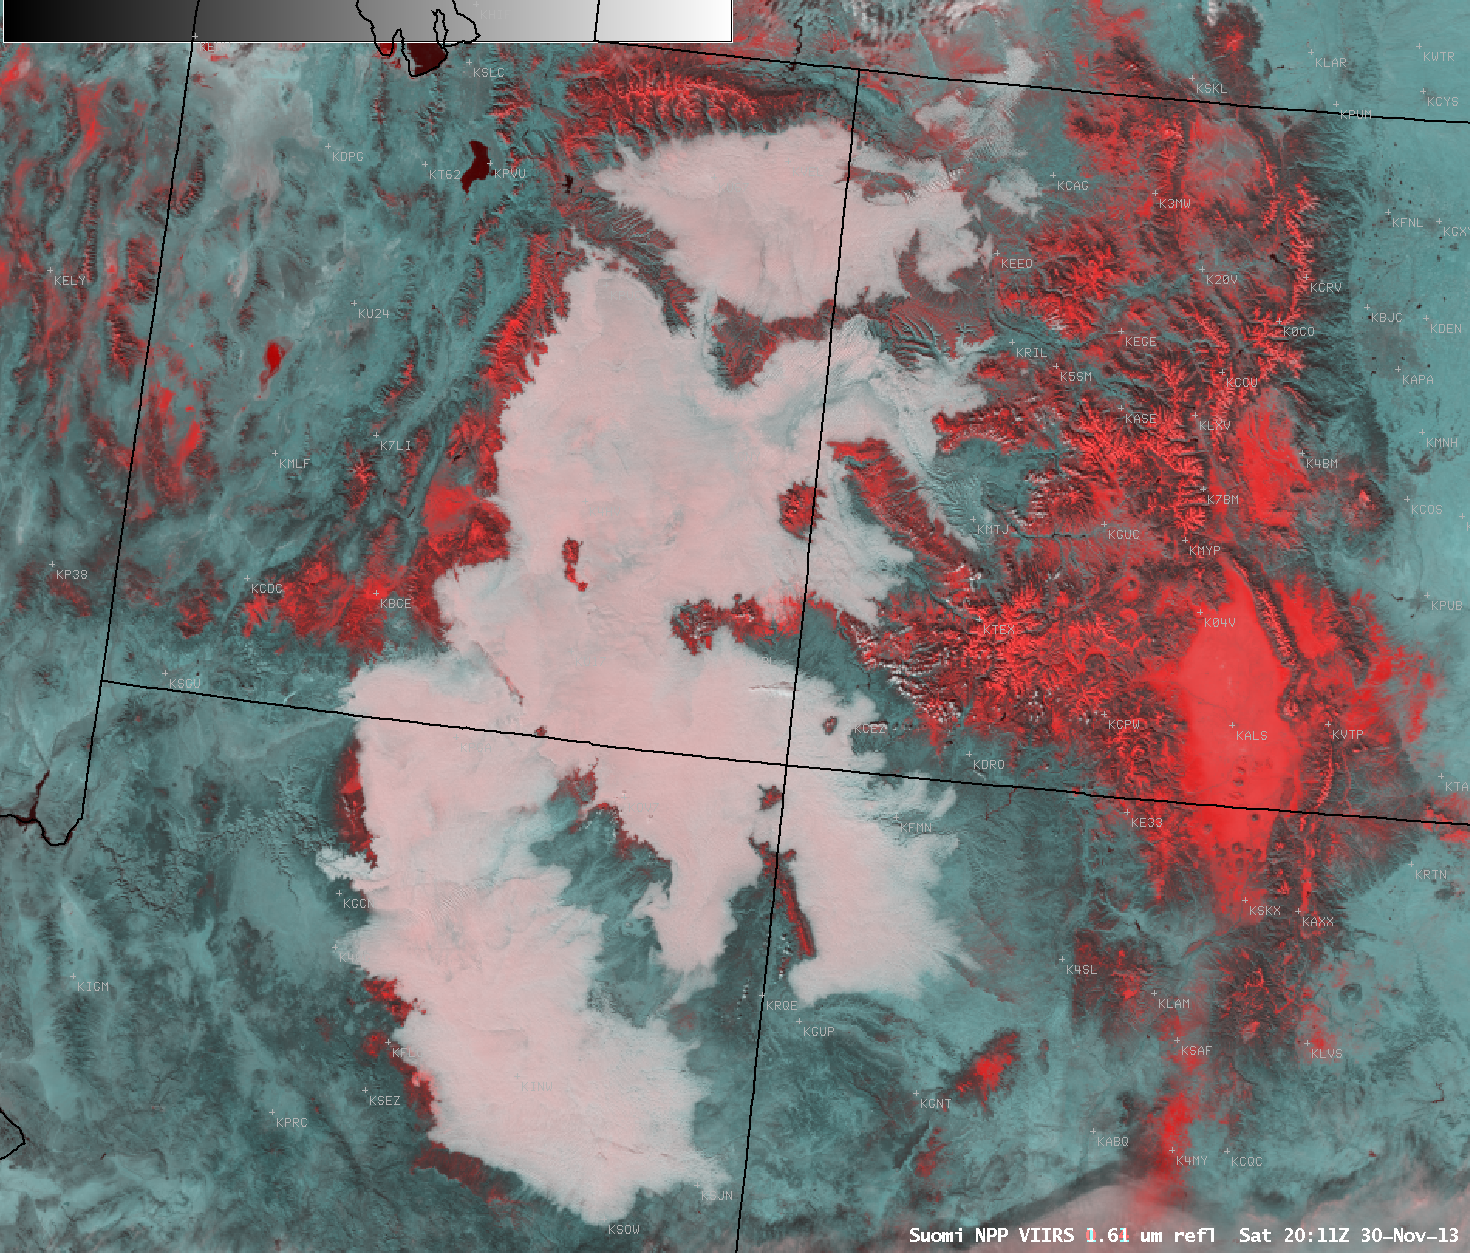
A comparison of the 20:11 UTC (1:11 PM local time) Suomi NPP VIIRS 0.64 µm visible channel image with the corresponding false-color Cloud-vs-snow discrimination Red/Green/Blue (RGB) image (below) helped to differentiate between the areas of snow cover (which appeared as varying shades of red on the RGB image) and the supercooled water droplet fog and stratus cloud features (which appeared as varying shades of white). Again, note the westward protrusion of fog located just to the north of Grand Canyon National Park (station identifier KGCN).

Suomi NPP VIIRS 0.64 µm visible channel and false-color Cloud-vs-snow discimination RGB image
There were not many pilot reports availble to offer information on the height of the tops of the stratus clouds – however, one report placed the cloud tops at 8000 feet above ground level over far northwestern New Mexico at 19:08 UTC (below).

Suomi NPP VIIRS 0.64 µm visible channel image with pilot report of cloud top height
An image of the 1-km resolution POES AVHRR Cloud Top Height product at 21:00 UTC or 2:00 PM local time (below) indicated that the tops of the stratus clouds were generally in the 3-4 km range (green to yellow color enhancement).

POES AVHRR Cloud Top Height product
===== 01 December Update =====
On the following day, an AWIPS-2 image comparison of the afternoon Suomi NPP VIIRS 0.64 um visible channel data with the corresponding Cloud-vs-snow discrimination RGB product (below) again showed how entrenched the fog/stratus still was across that region at 19:54 UTC or 12:54 PM local time.

Suomi NPP VIIRS 0.64 um visible image and Cloud-vs-snow discrimination RGB image
View only this post
Read Less
")
")
")
")
")
")
")
")

")
")
")
