A late-season tornadic outbreak occurred on Sunday November 17th over the Upper Midwest. The animation above shows MODIS Imagery — visible and 11 µm just as the severe weather was erupting over Illinois. Two different sets of severe weather reports are overlain: those... Read More
 and Infrared (11 µm) imagery from 1634 UTC 17 November overlain with hourly severe reports from 1700 and 1800 UTC (click to enlarge)")
MODIS Visible (0.68 µm) and Infrared (11 µm) imagery from 1634 UTC 17 November overlain with hourly severe reports from 1700 and 1800 UTC (click to enlarge)
A late-season tornadic outbreak occurred on Sunday November 17th over the Upper Midwest. The animation above shows MODIS Imagery — visible and 11 µm just as the severe weather was erupting over Illinois. Two different sets of severe weather reports are overlain: those within an hour of the image, and those an hour after the image. The convection over central Illinois has just started to produce severe weather, and it intensified after the imagery (as seen by the blossoming in areal coverage of severe weather reports).
 imagery 17 November, times as indicated (click image to animate)")
GOES-13 Enhanced Infrared (10.8 µm) imagery 17 November, times as indicated (click image to animate)
An animation of GOES-13 10.7 µm imagery (in RSO mode during the day), above, (also available here, on YouTube) shows the storms. The storm tops were not particularly cold (unsurprising given the date), but severe weather signatures (enhanced Vs, for example), can be discerned. Storm reports from SPC suggest that the strongest tornado, in Washington (in Tazewell County), was on the ground at 1700 UTC. The 1655, 1702 and 1710 UTC images shows a strong cell, but not one with particularly cold tops. An animation of these 3 images is shown below. The storm is relatively small compared to GOES-13 resolution. Note also that the storm appears to be north of Tazewell County because of parallax errors.
 imagery 17 November, times as indicated (click image to animate) Washington is in far northern Tazewell County, which County is outlined in White")
GOES-13 Enhanced Infrared (10.8 µm) imagery 17 November, times as indicated (click image to animate) Washington is in far northern Tazewell County, which County is outlined in White
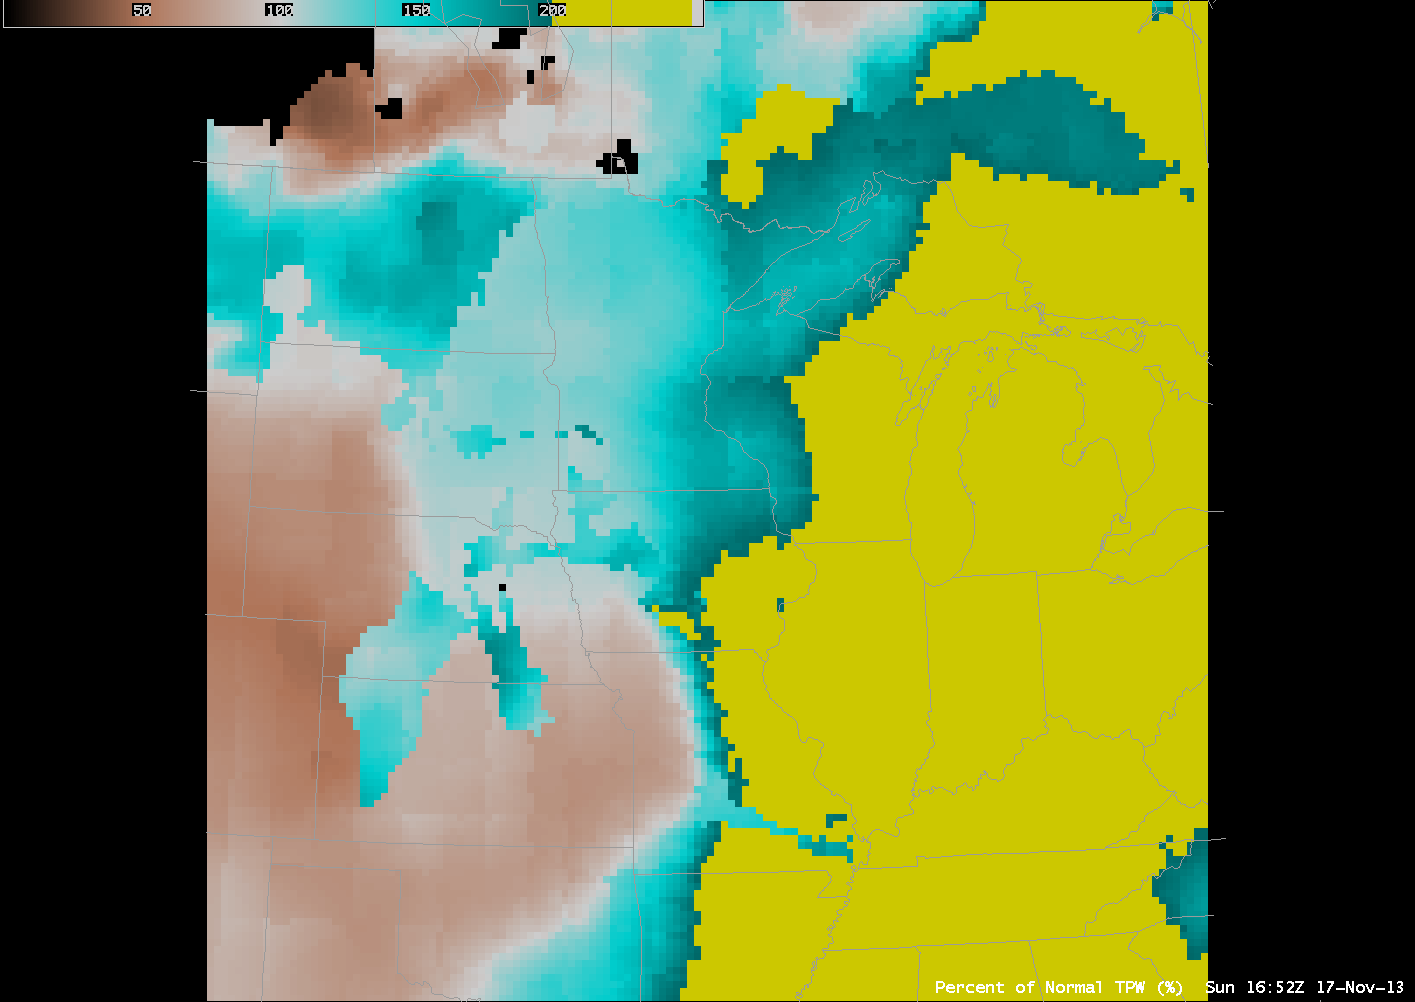
The large-scale environment was unusually moist and unstable for November. Total Precipitable Water exceeded 200% of normal over much of the upper midwest (link), and an animation of GOES-13 Sounder imagery of DPI Lifted Index (link) showed instability, albeit in between holes in the cloud (the extensive cloud shields suggest that solar heating played little role in this outbreak). The 1700 UTC GOES DPI Lifted Index image is below. Lifted Indices below -5 are common throughout Illinois. (GOES-13 Sounder data continues to have missing data points, as noted here and here)
")
GOES-13 Sounder DPI Values of Lifted Index, 1700 UTC on 17 November (click image to enlarge)
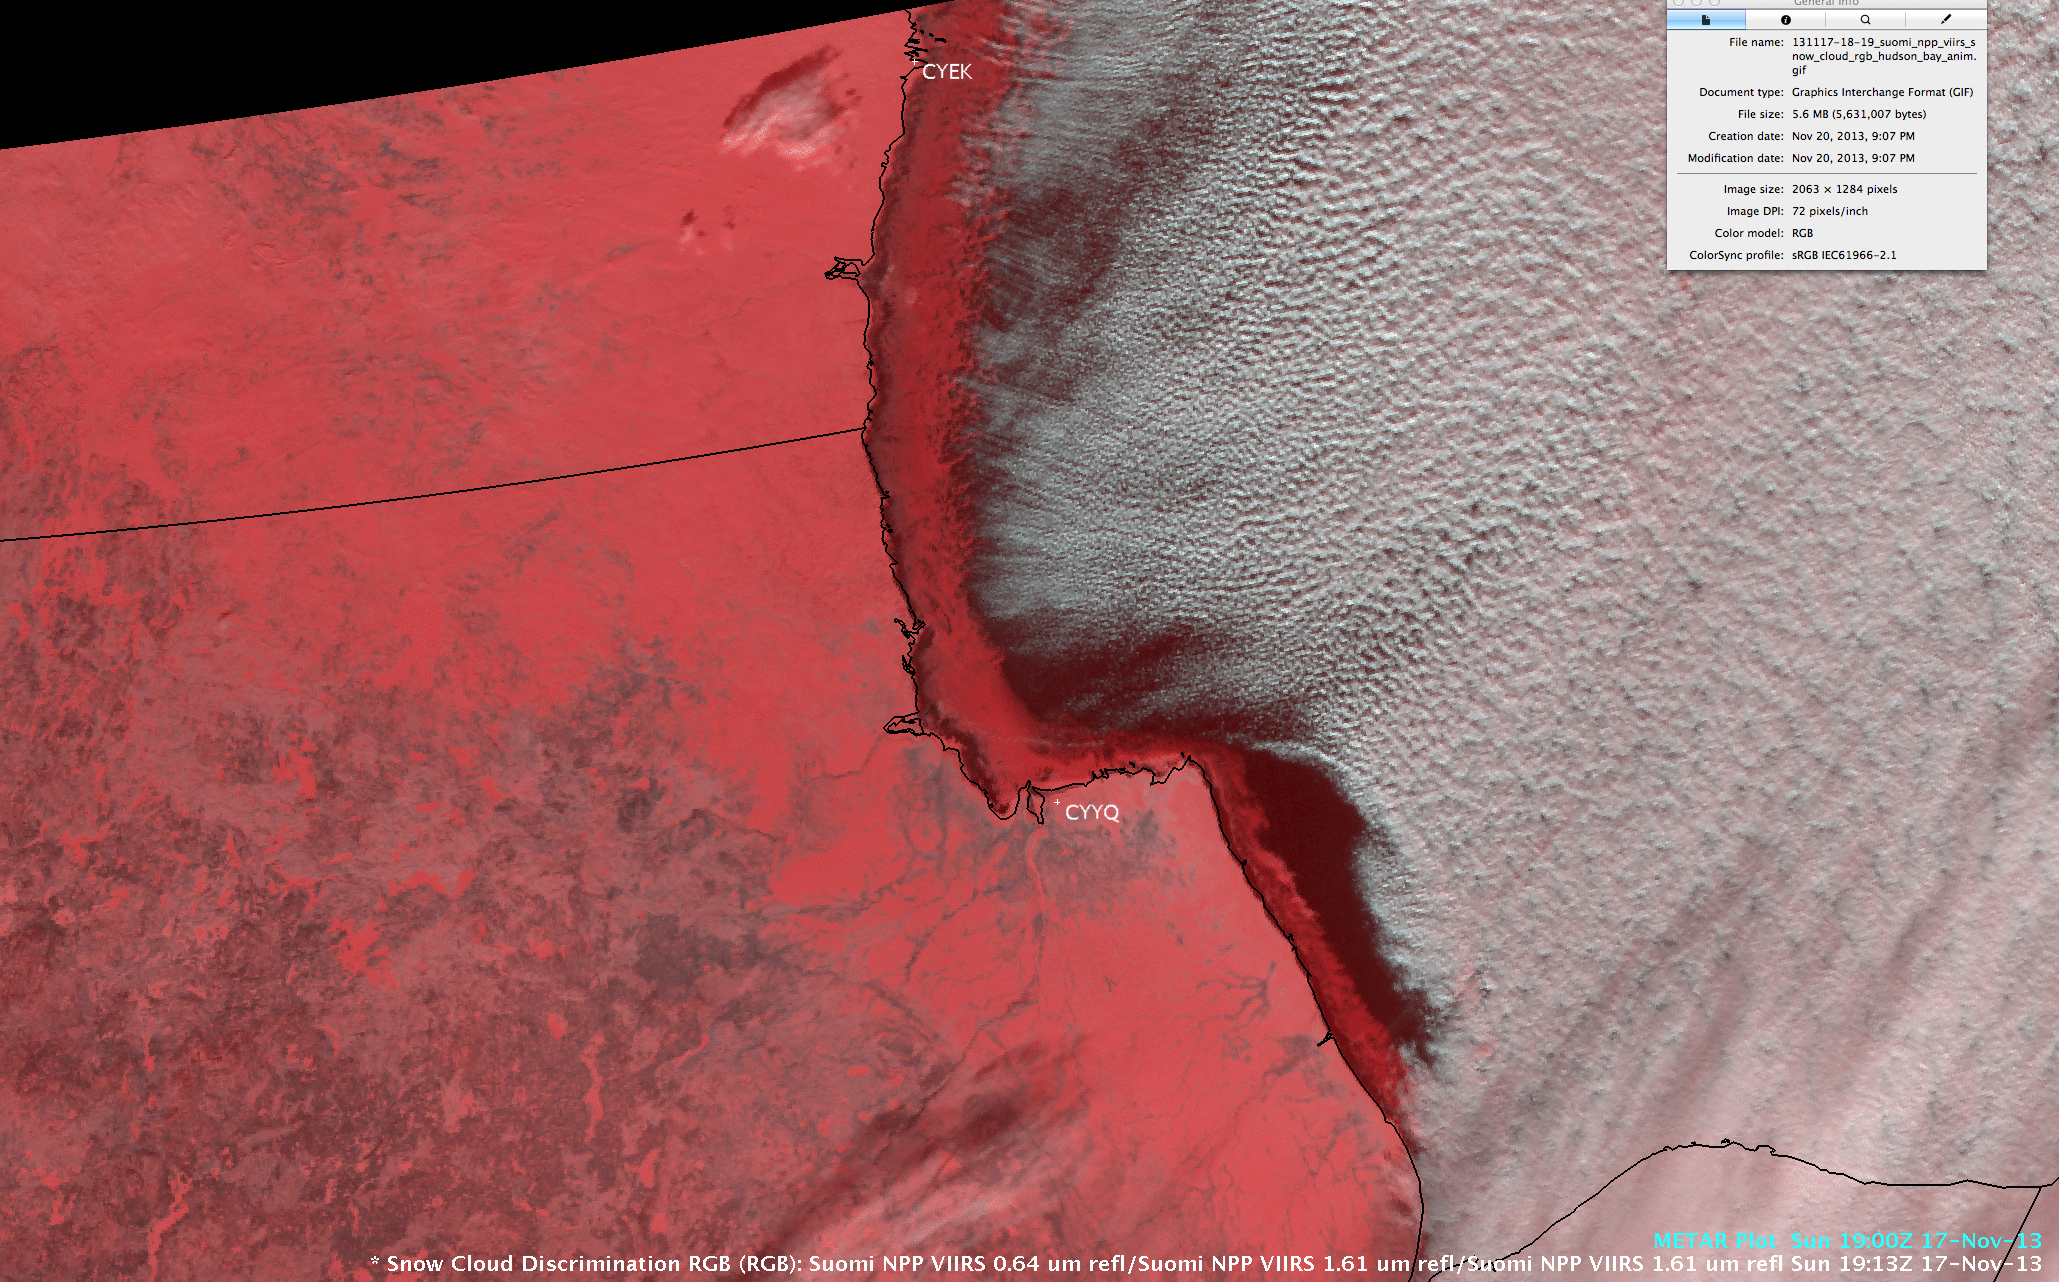
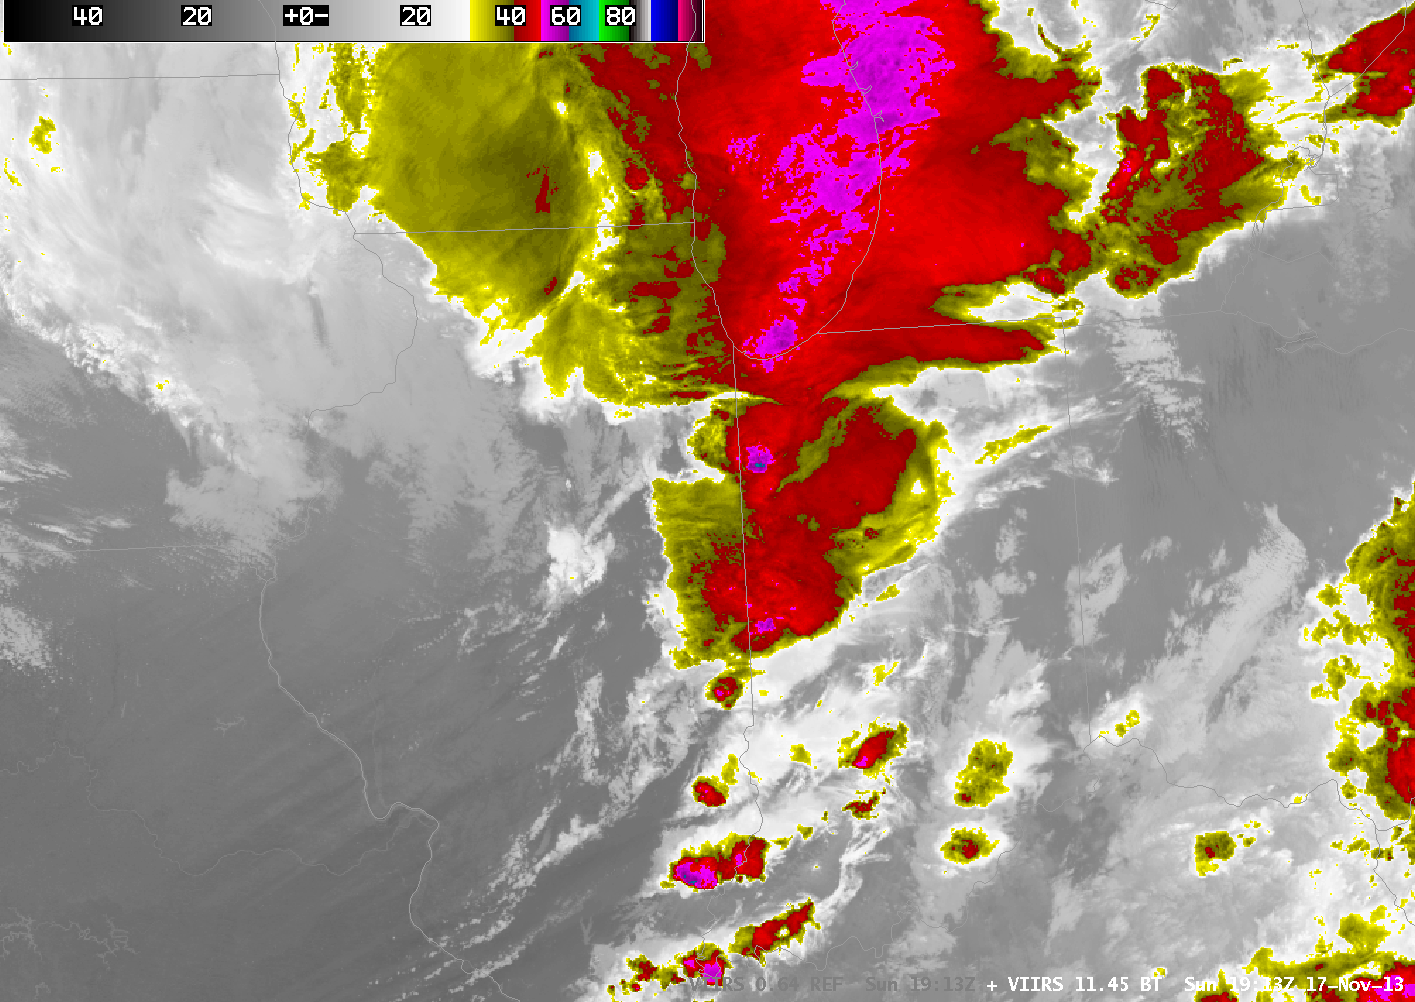
Suomi/NPP also viewed the storms, but after they had moved east of Illinois. A toggle between VIIRS Visible, 11.35 µm and 1.61 µm imagery, below, shows isolated supercells pushing through the cirrus shield.
, Infrared (11.45 µm) and 1.61 µm imagery from 1913 UTC 17 November (click to enlarge)")
Suomi/NPP Visible (0.65 µm), Infrared (11.45 µm) and 1.61 µm imagery from 1913 UTC 17 November (click to enlarge)
View only this post
Read Less
")
")
")
")
")


")
 imagery 17 November, times as indicated (click image to animate)")
 imagery 17 November, times as indicated (click image to animate) Washington is in far northern Tazewell County, which County is outlined in White")
