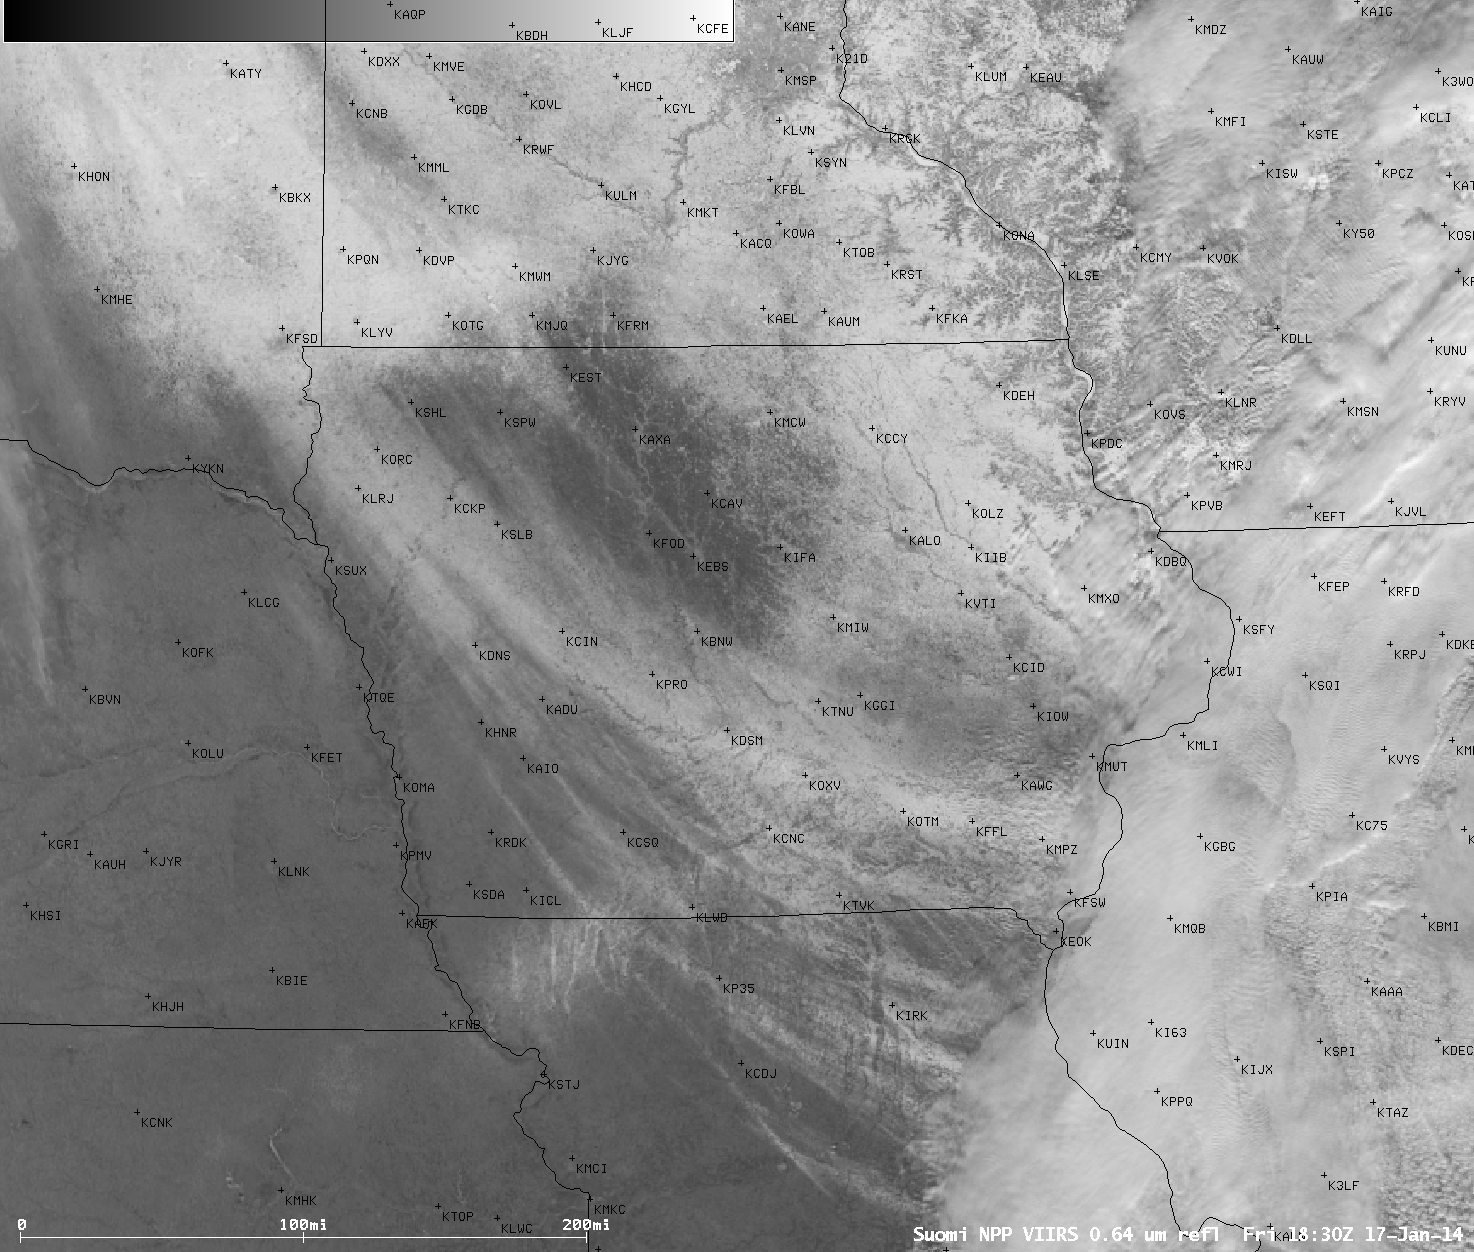

Suomi NPP VIIRS 0.64 µm visible channel and False-color RGB images
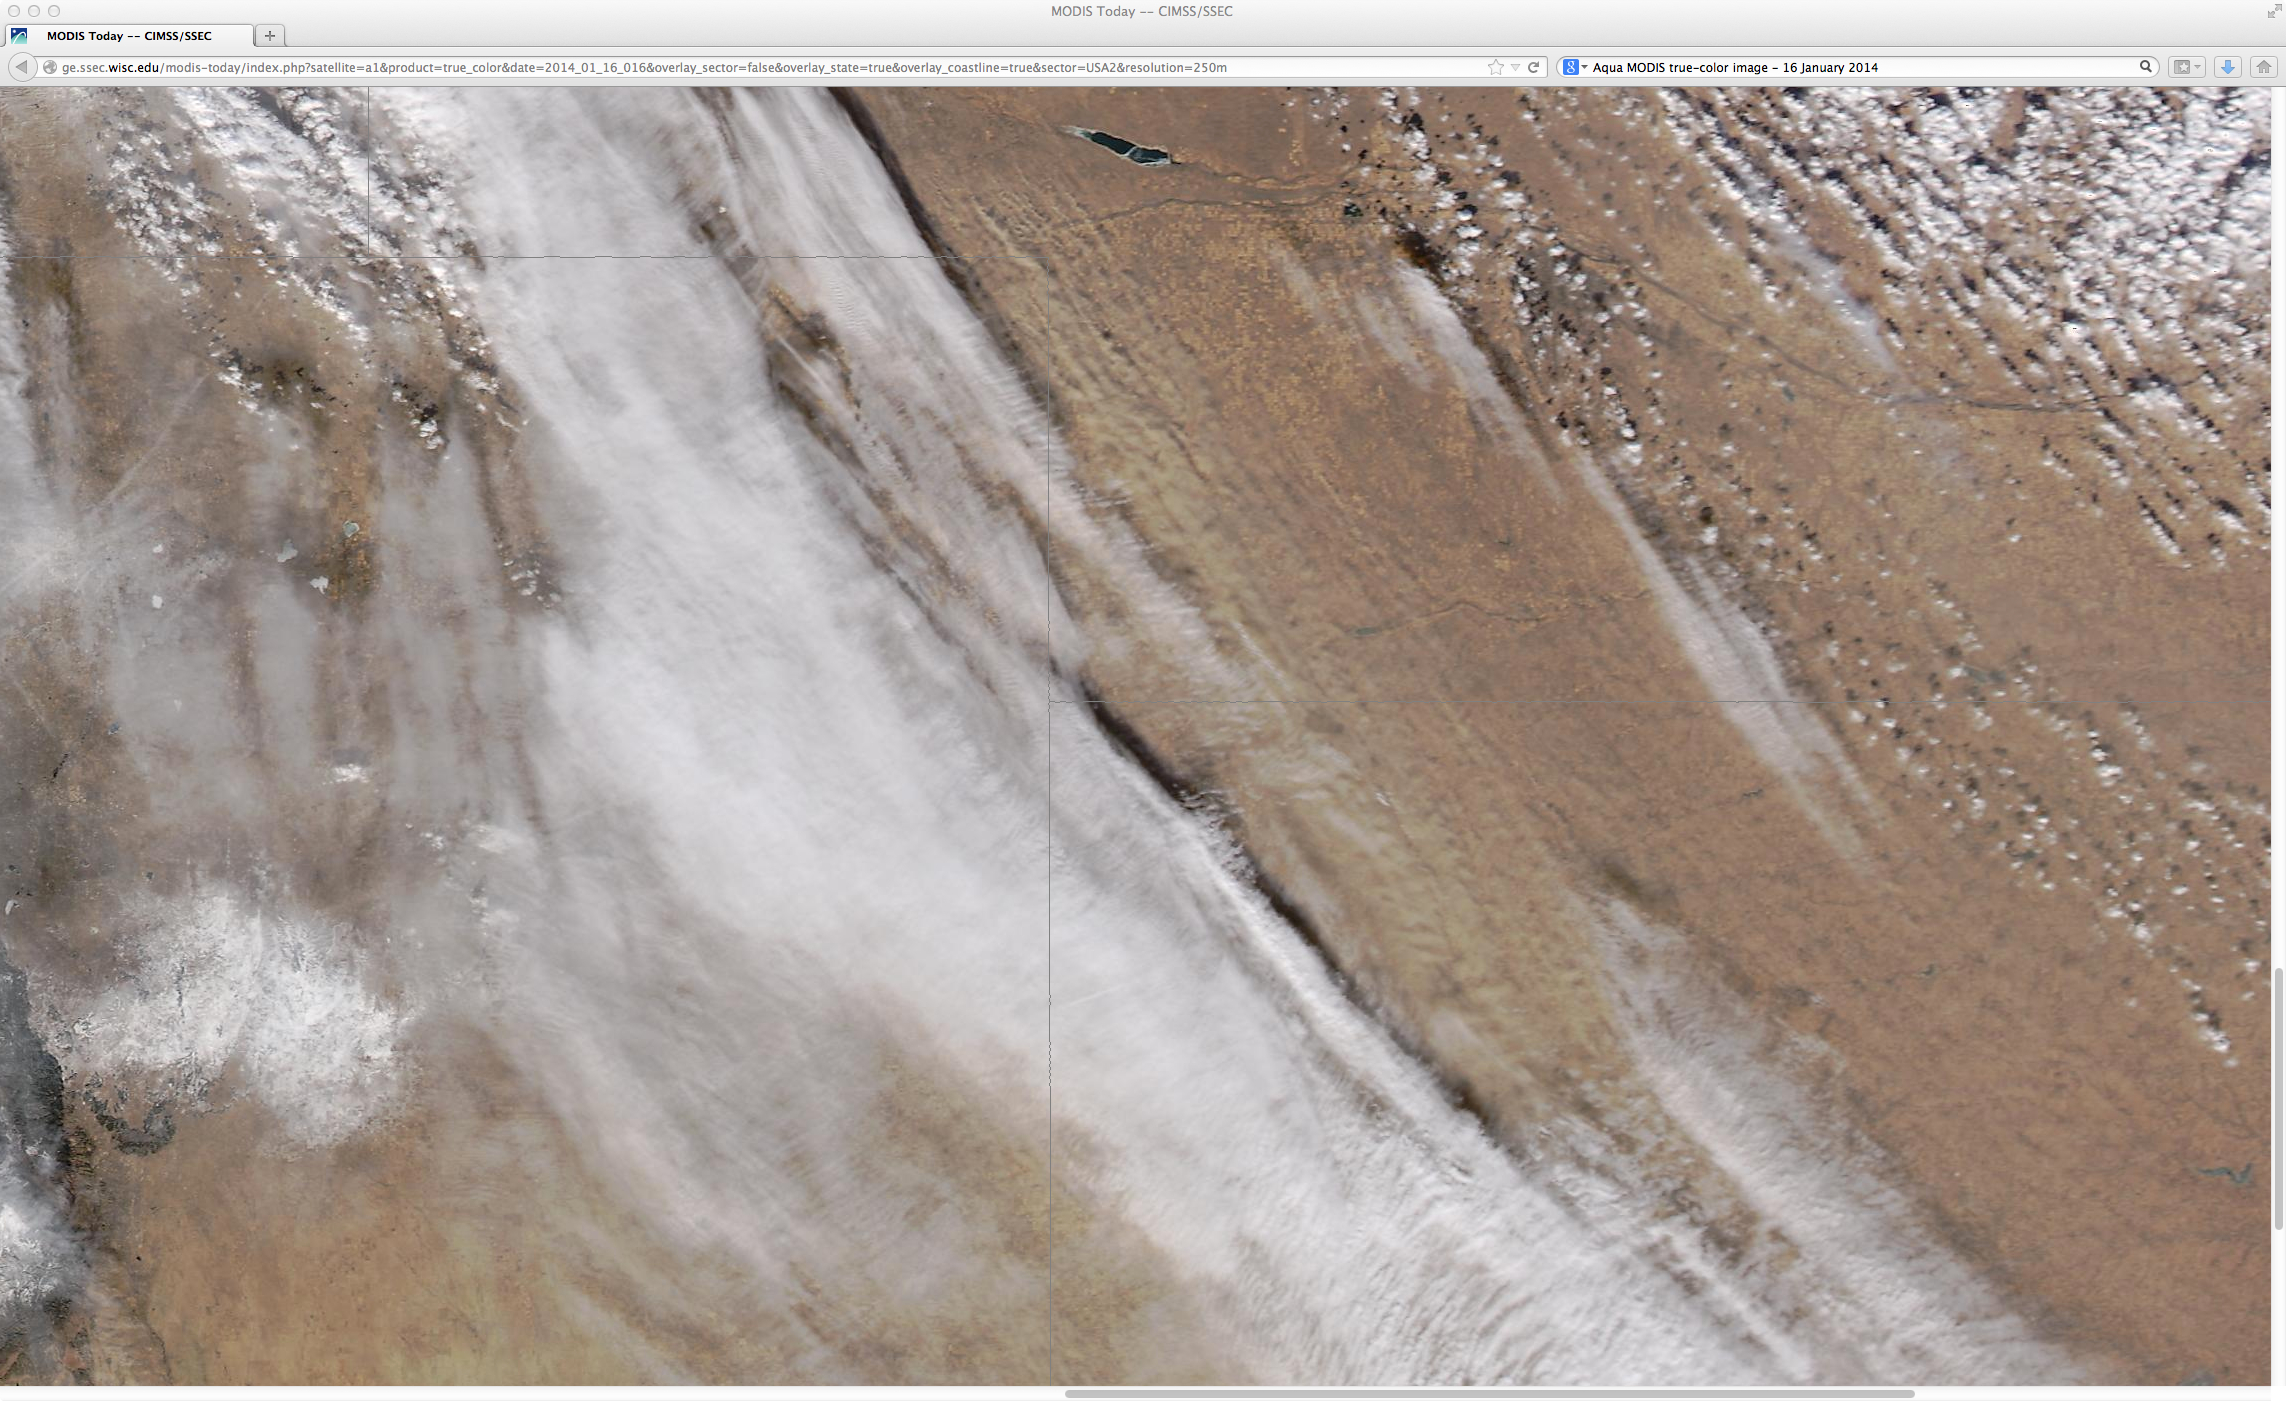
A comparison of AWIPS images of Suomi NPP VIIRS 0.64 µm visible channel data with the corresponding false-color “snow-vs-cloud discrimination” Red/Green/Blue (RGB) product (above) revealed numerous northwest-to-southeast oriented mesoscale bands of snow on the ground (varying shades of red on the RGB image) across much of Iowa extending into northern Missouri at 18:30 UTC or 12:30 PM local time on 17 January 2014. Some of these bands of snow cover appeared to be only about 10 miles wide!
The disturbance that created these snow bands moved across the region on the previous day (16 January) — GOES-13 0.63 µm visible channel images (below; click image to play animation) showed the development of a feature that resembled a “mesoscale squall line” which propagated southeastward across Iowa during the daylight hours. Surface METAR observations showed the strong winds (gusting to over 50 mph at a few sites) which created blizzard conditions as the fresh snowfall was easily lofted from the ground. Note that there was even one negative cloud-to-ground lightning strike noted just west of Des Moines (station identifier KDSM) at 21:45 UTC or 3:45 PM local time, indicating the presence of convective elements within the squall line which led to enhanced snowfall rates — in fact, the maximum snowfall reported from this fast-moving system was 3.1 inches at Des Moines (where surface visibility was reduced to 1/16 mile with thundersnow).
![GOES-13 0.63 µm visible channel images, with surface reports and cloud-to-ground lightning strikes [click to play animation]](https://cimss.ssec.wisc.edu/satellite-blog/wp-content/uploads/sites/5/2014/01/140116_g13_vis_kdmx_tssn_anim.gif "GOES-13 0.63 µm visible channel images, with surface reports and cloud-to-ground lightning strikes [click to play animation]")
GOES-13 0.63 µm visible channel images, with surface reports and cloud-to-ground lightning strikes [click to play animation]
View only this post Read Less
![GOES-13 6.5 µm water vapor channel images [click to play animation]](https://cimss.ssec.wisc.edu/satellite-blog/wp-content/uploads/sites/5/2014/01/140116_g13_wv_eastern_US_anim.gif "GOES-13 6.5 µm water vapor channel images [click to play animation]")


![MTSAT-2 0.68 µm visible channel (left) and 3.75 µm shortwave IR (right) images [click to play animation]](https://cimss.ssec.wisc.edu/satellite-blog/wp-content/uploads/sites/5/2014/01/140115-16_mtsat_vis_swir_australia_grampions_fire_anim.gif "MTSAT-2 0.68 µm visible channel (left) and 3.75 µm shortwave IR (right) images [click to play animation]")
![MTSAT-2 10.8 µm longwave IR images [click to play animation]](https://cimss.ssec.wisc.edu/satellite-blog/wp-content/uploads/sites/5/2014/01/140115-16_mtsat_ir_australia_grampions_fire_anim.gif "MTSAT-2 10.8 µm longwave IR images [click to play animation]")
![MTSAT-2 0.68 µm visible channel images [click to play animation]](https://cimss.ssec.wisc.edu/satellite-blog/wp-content/uploads/sites/5/2014/01/140115-16_mtsat_visible_se_australia_realearth_anim.gif "MTSAT-2 0.68 µm visible channel images [click to play animation]")
")

")
