GOES-13 has been placed into Super Rapid Scan Operations (SRSO) mode today to support the OWLeS program over the eastern Great Lakes, providing periods of 1-minute interval imagery each hour. The extraordinary cold air over the eastern United States is producing heavy lake-effect snows over downwind of Lakes Erie (above)... Read More
![GOES-13 0.63 µm visible imagery [click to play animation]](https://cimss.ssec.wisc.edu/satellite-blog/wp-content/uploads/sites/5/2014/01/GOES13_SRSO_7Jan2014_20.gif "GOES-13 0.63 µm visible imagery [click to play animation]")
GOES-13 0.63 µm visible imagery [click to play animation]
GOES-13 has been placed into Super Rapid Scan Operations (SRSO) mode today to support the
OWLeS program over the eastern Great Lakes, providing periods of 1-minute interval imagery each hour. The extraordinary cold air over the eastern United States is producing heavy lake-effect snows over downwind of Lakes Erie (above) and Ontario (below).
Storm total snowfall amounts were as high as 60 inches;Â for additional information on this event, see the
Wasatch Weather Weenies and
Jim LaDue view blogs.
![GOES-13 0.63 µm visible imagery [click to play animation]](https://cimss.ssec.wisc.edu/satellite-blog/wp-content/uploads/sites/5/2014/01/GOES13_SRSO_ONTARIO_7Jan2014_35.gif "GOES-13 0.63 µm visible imagery [click to play animation]")
GOES-13 0.63 µm visible imagery [click to play animation]
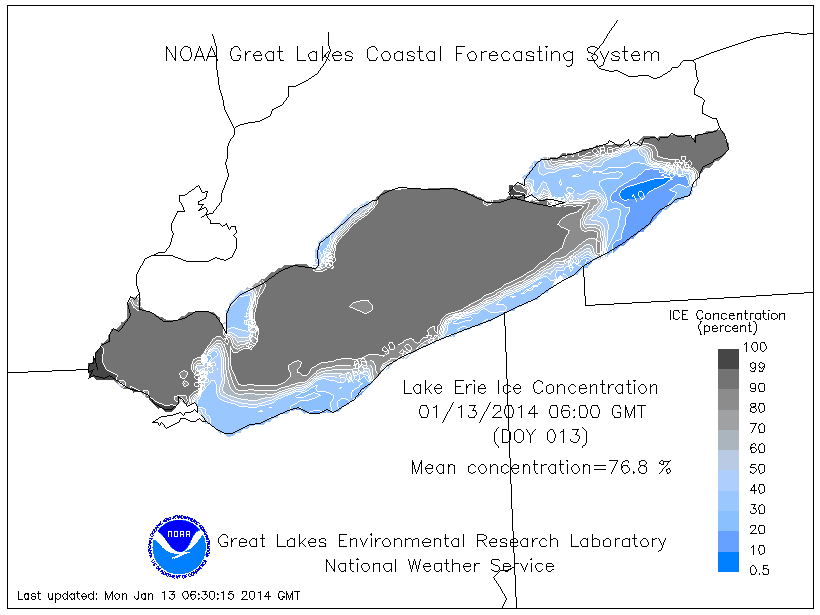
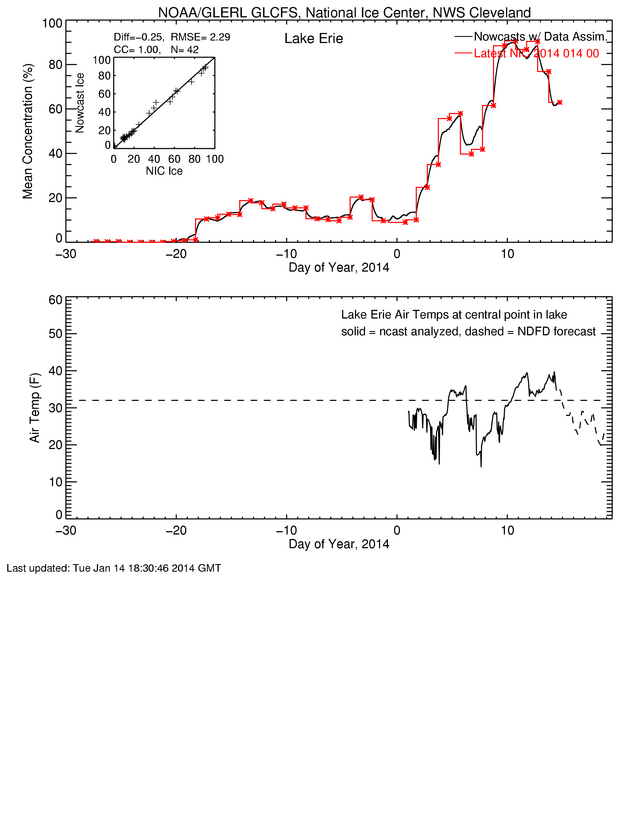
In a faster animation of GOES-13 SRSO visible images covering Lake Erie
(below; click image to play animation; also available as an MP4 file), the motion of ice in the western portion of the lake could be seen; the formation and intensification of organized lake-effect snow bands occured over the ice-free open waters in the central and eastern parts of Lake Erie.
")
GOES-13 0.63 µm visible channel images [click to play animation]
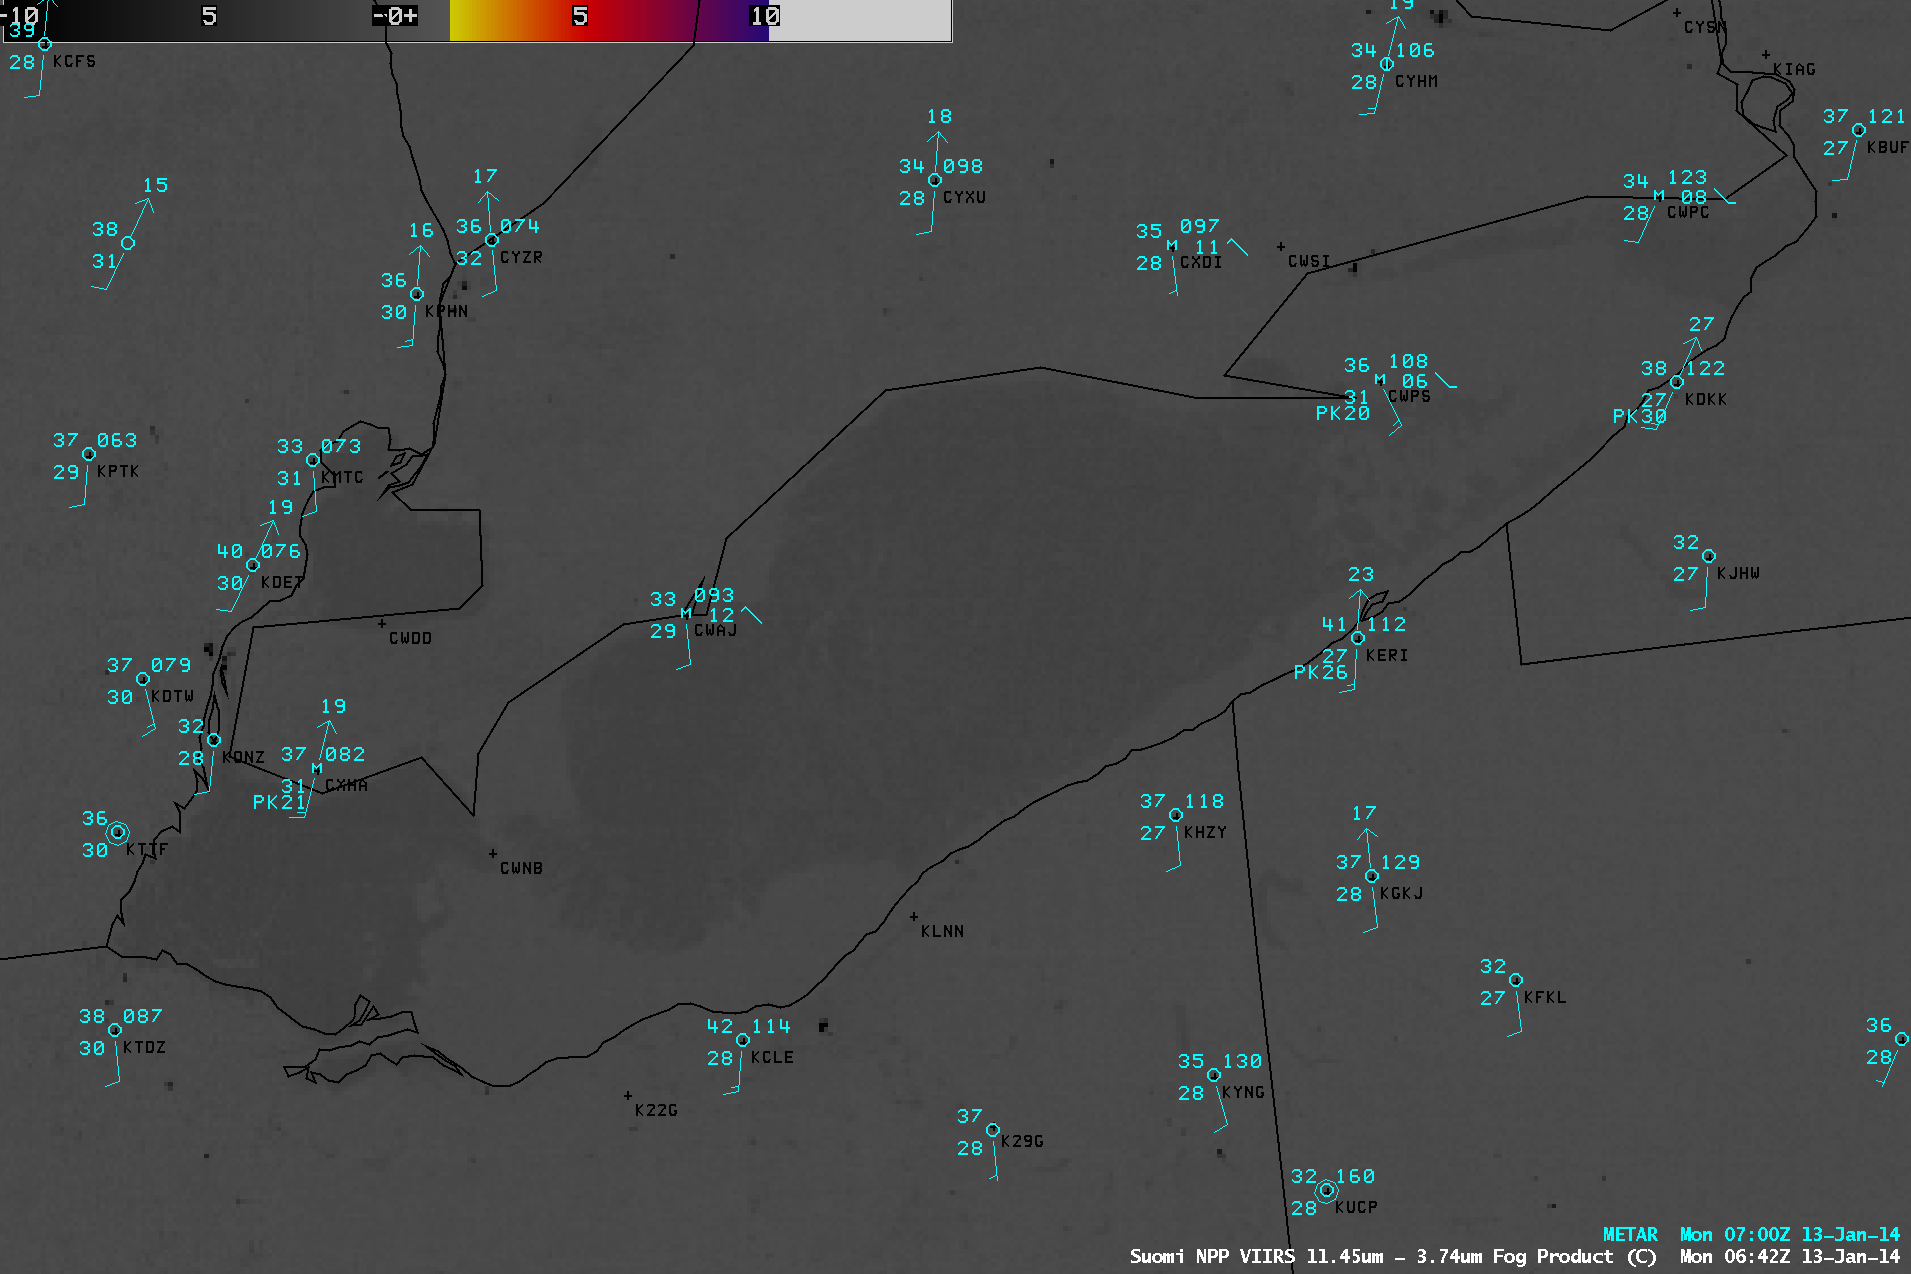
To supplement the GOES-13 SRSO images, a comparison of AWIPS images of Terra MODIS 0.65 µm visible channel and 11.0 µm IR channel data
(below) showed the well-defined lake-effect snow (LES) bands streaming off of Lake Erie and Lake Ontario at 15:28 UTC
(10:28 AM local time). At this time, surface visibility was restricted to 1/16 mile with heavy snow at Buffalo, New York (KBUF); other notable peak wind gusts included 46 knots at Waterton, New York (KART), 49 knots at Point Petre, Ontario (CQWP), and 50 knots at Long Point (CWPS) and Port Colborne (CWPC) Ontario. Metop ASCAT surface scatterometer winds were as high as 62 knots over Lake Erie and 46 knots over Lake Ontario. The coldest cloud-top IR brightness temperatures were -39º C immediately downwind of Lake Ontario, and -35º C immediately downwind of Lake Erie.

Terra MODIS 0.65 µm visible channel and 11.0 µm IR channel images
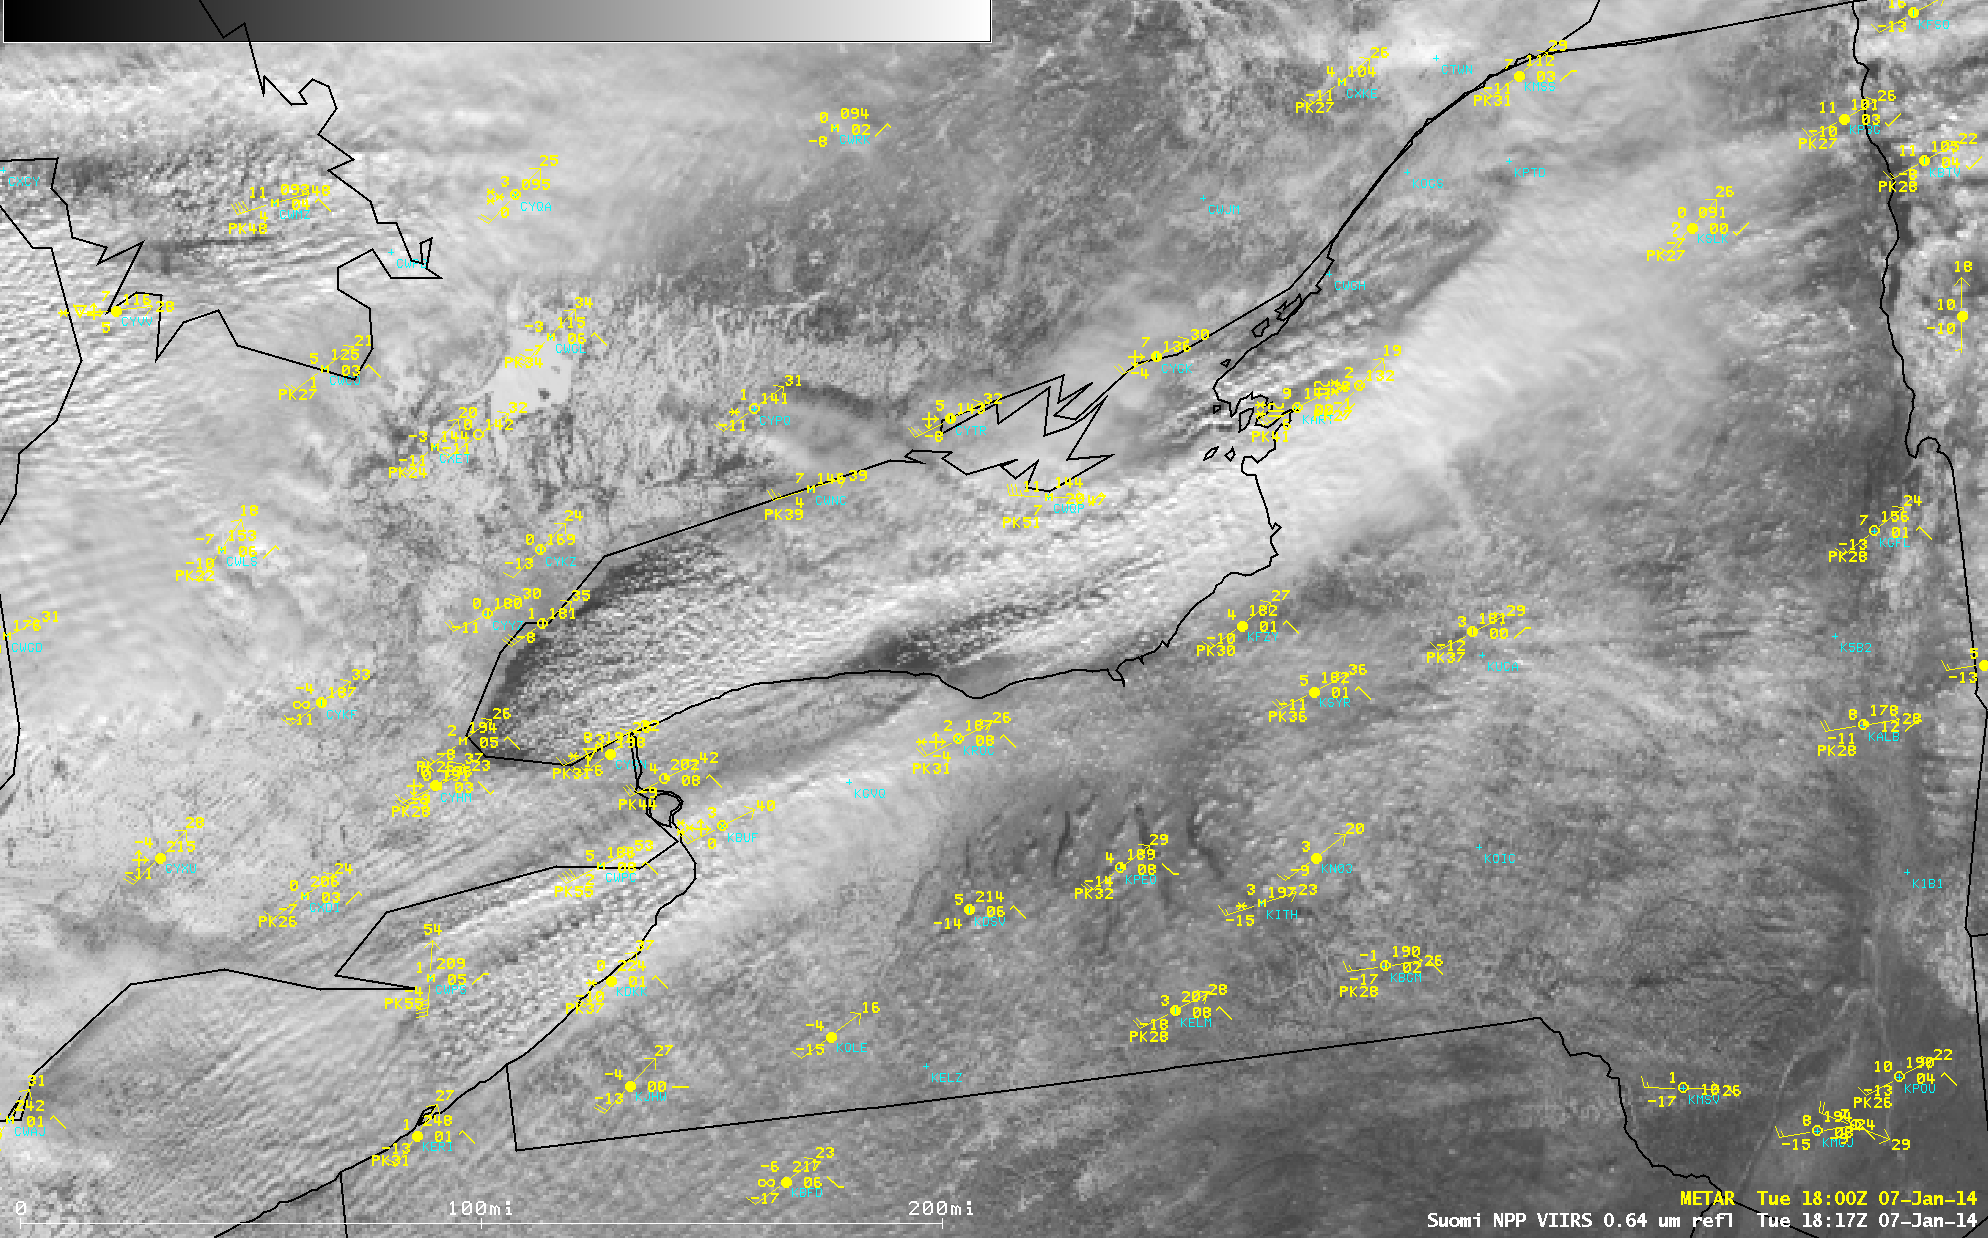
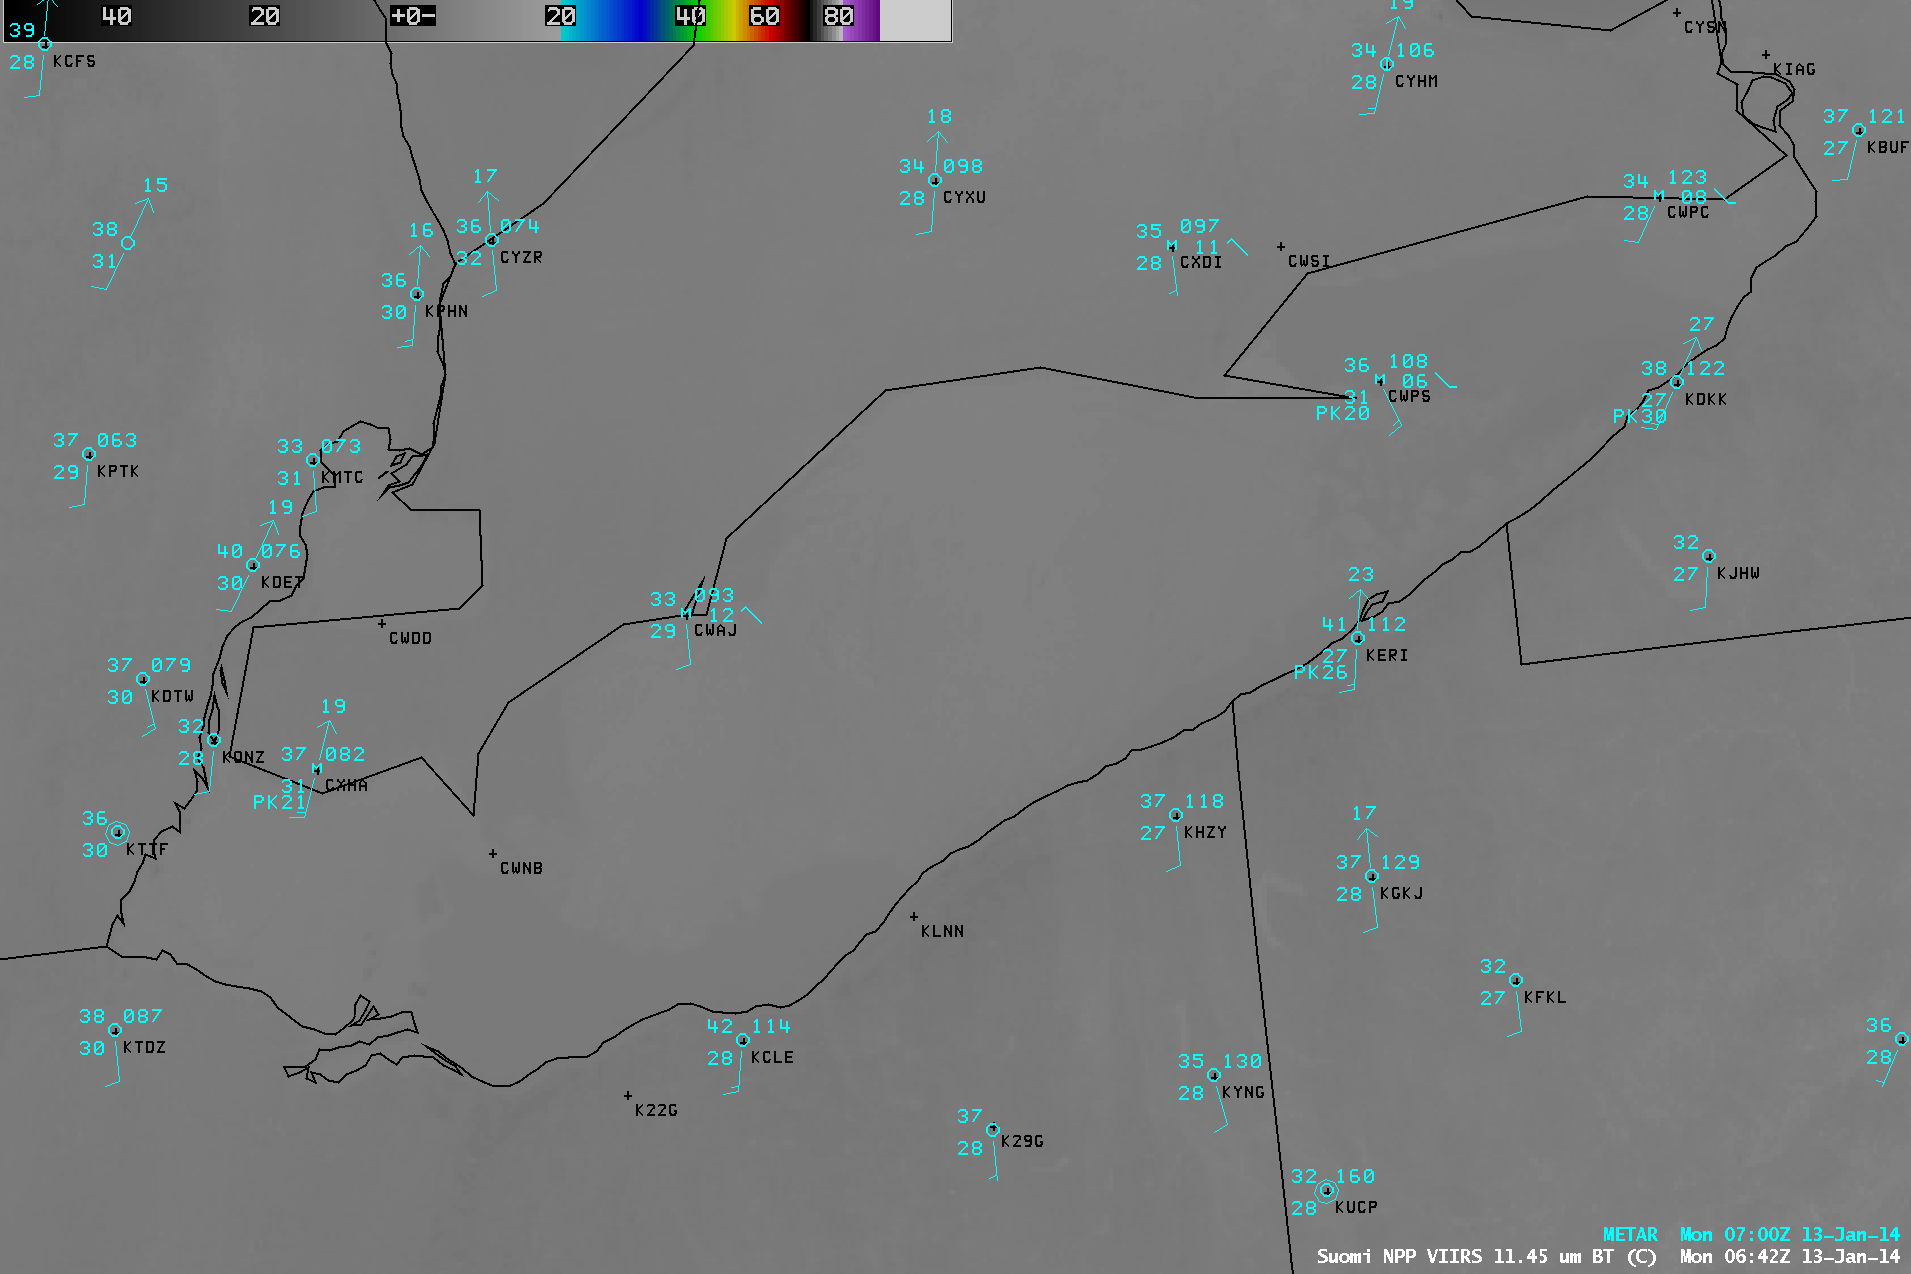
About 3 hours later (at 18:17 UTC or 1:17 PM local time), a similar comparison of Suomi NPP VIIRS 0.64 µm visible channel and 11.45 µm IR channel images (below) showed the 2 LES bands as they continued to organize and intensify. Surface visibility had dropped to 0 miles with heavy snow and blowing snow (and a peak wind gust of 41 knots) at Buffalo (KBUF). Other notable peak wind gusts included 41 knots at Watertown (KART) and 42 knots at Fort Drum (KGTB) in New York, 51 knots at Point Petre (CQWP), and 55 knots at Long Point (CWPS) and Port Colborne (CWPC) in Ontario. The Lake Ontario LES band had extended farther inland, with Saranac Lake, New York (KSLK) reporting visibility reduced to 1 mile with snow. Cloud-top IR brightness temperatures remained about the same: -39º C downwind of Lake Ontario, and -34º C immediately downwind of Lake Erie.

Suomi NPP VIIRS 0.64 µm visible channel and 11.45 µm IR channel images
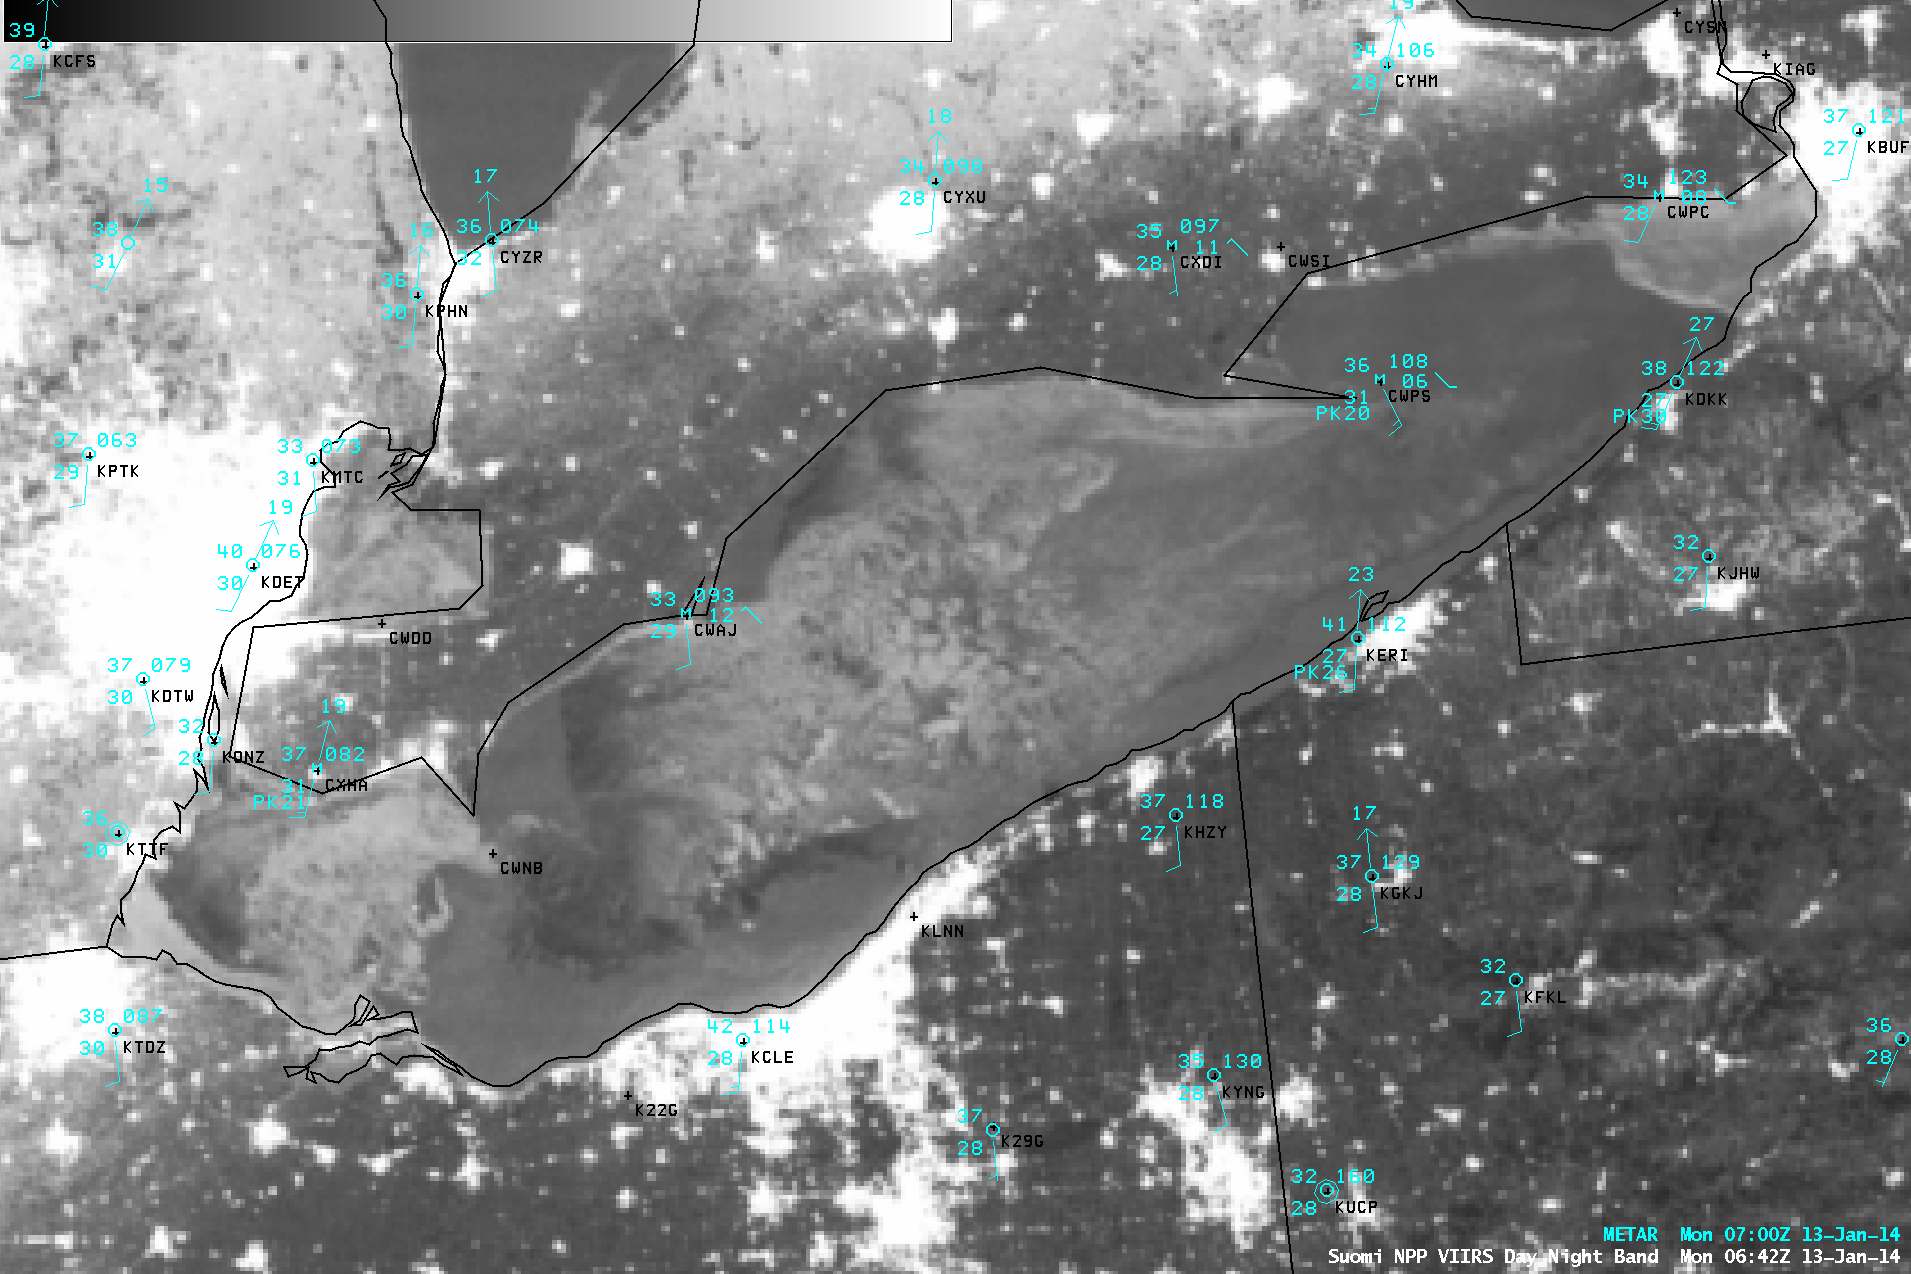
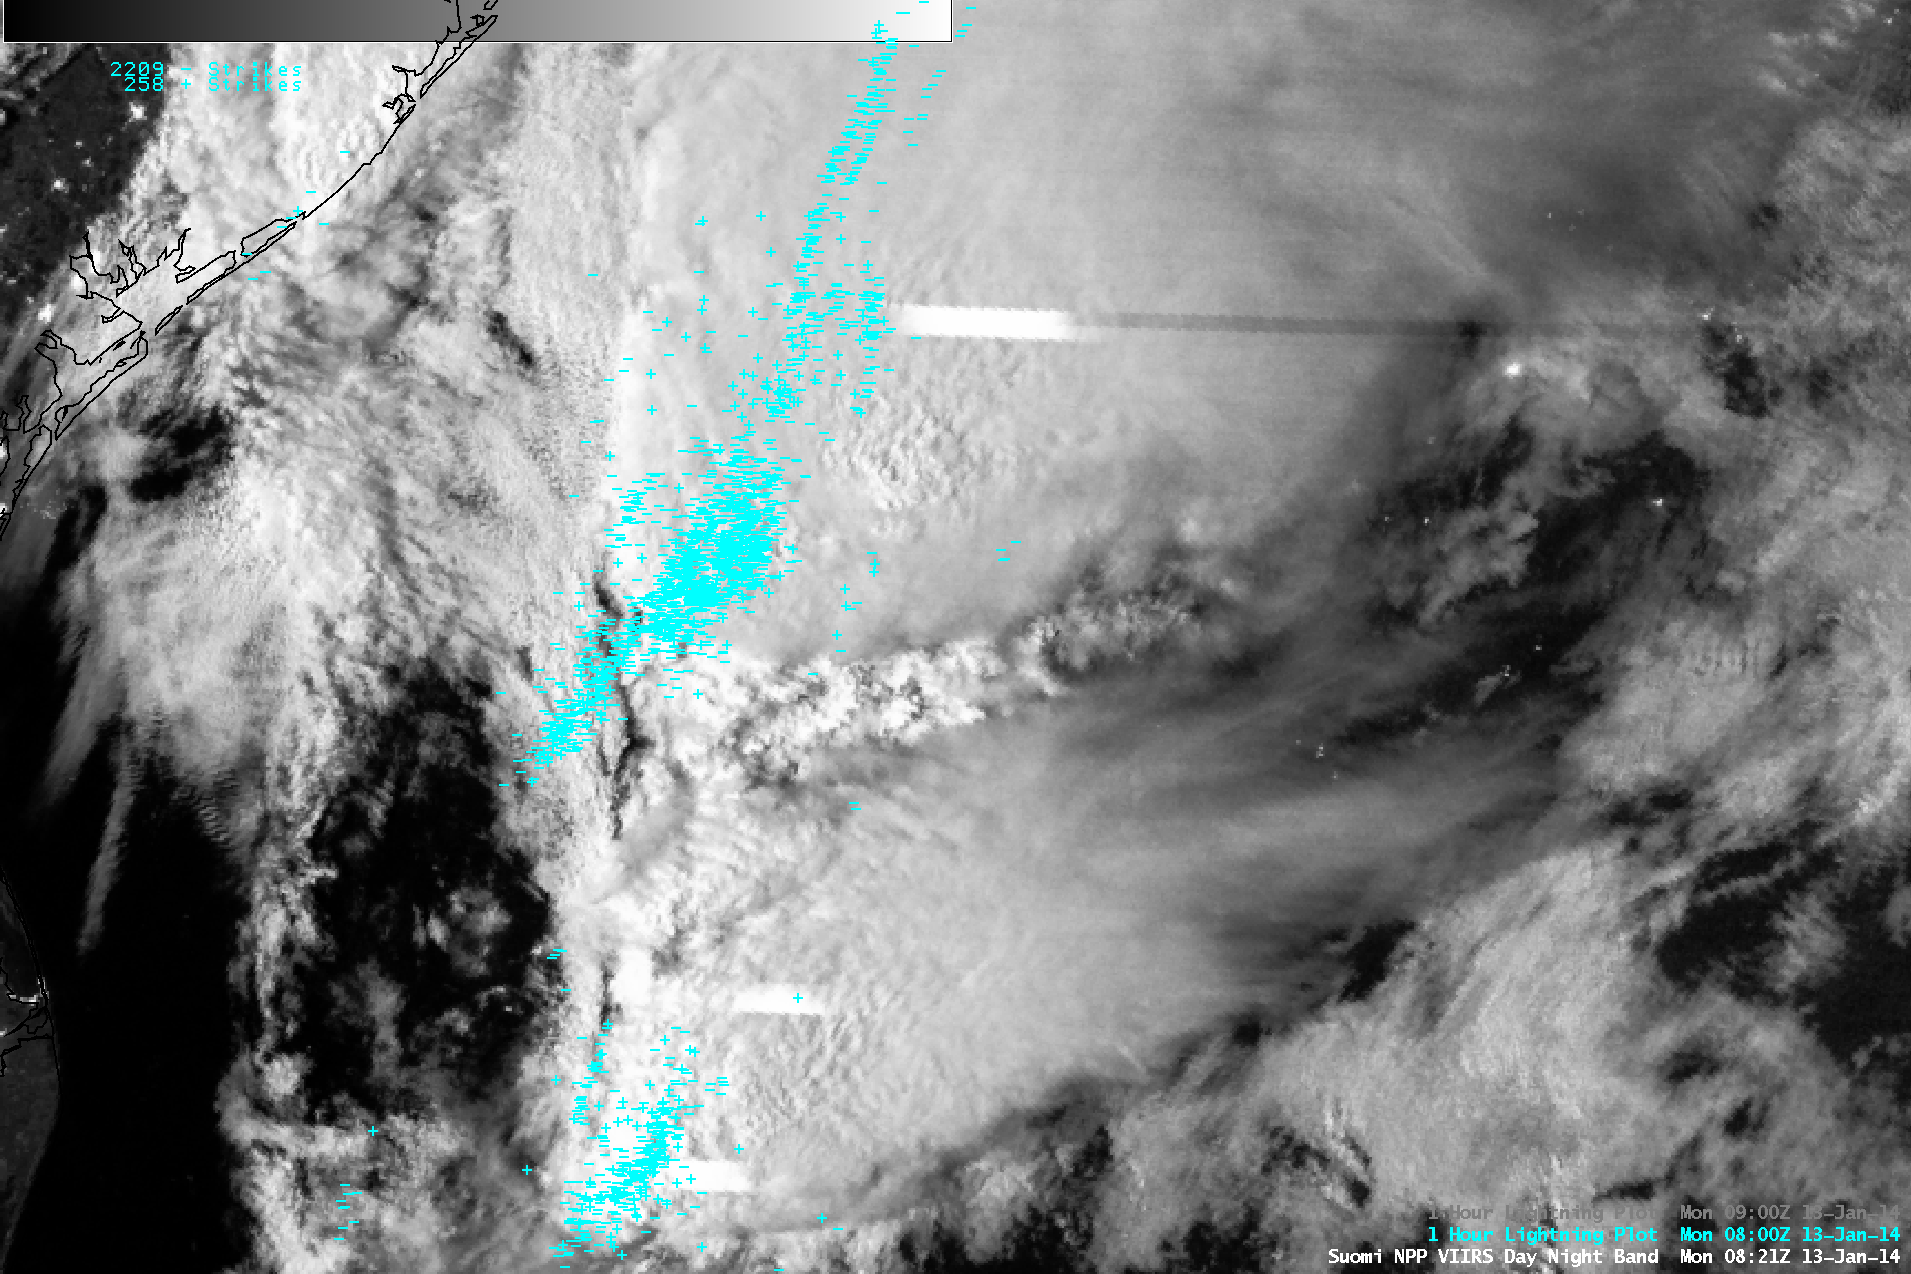
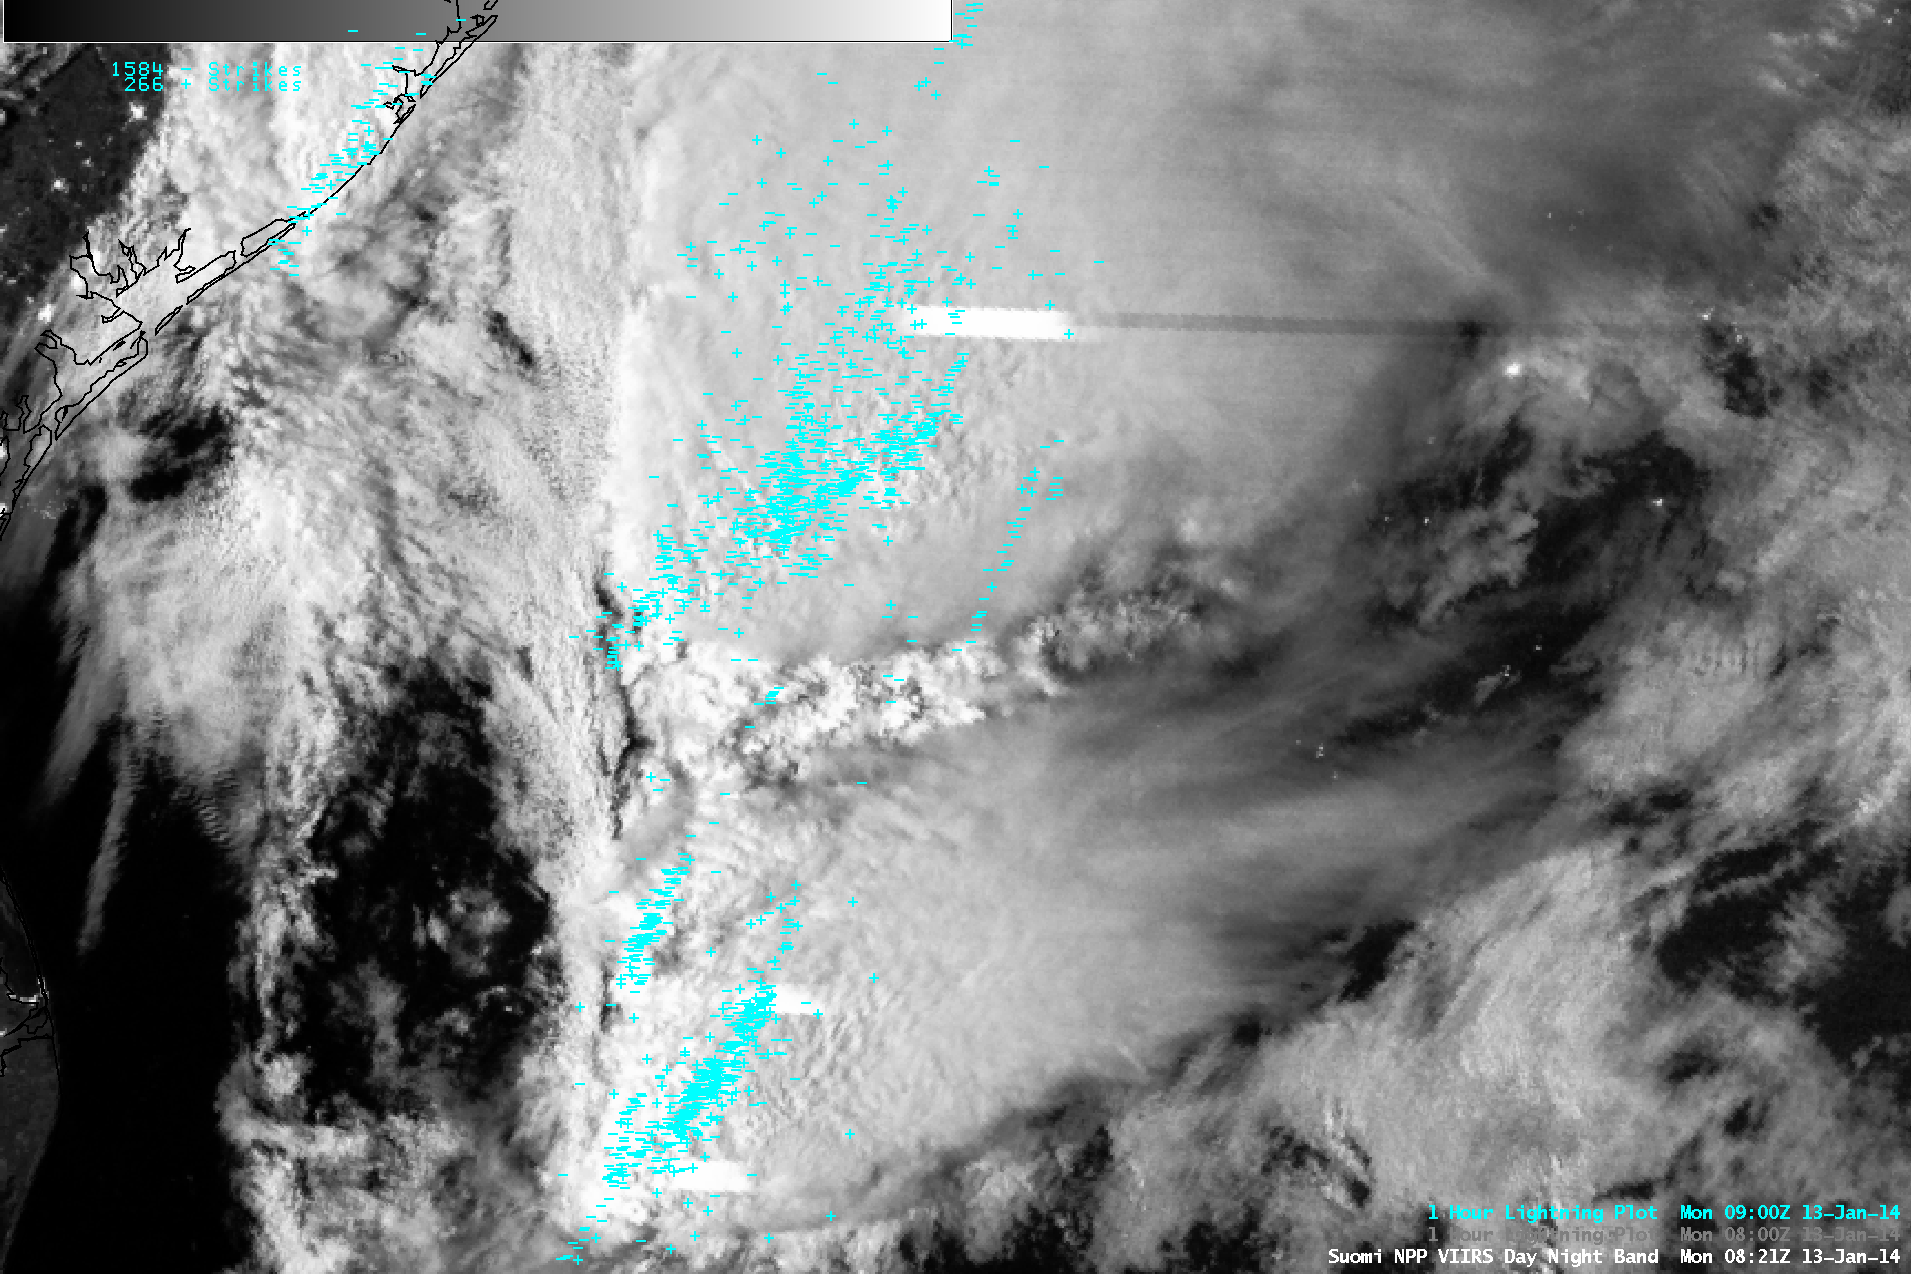
It is interesting to point out that there were a few cloud-to-ground lightning strikes downwind of Lake Ontario during the preceeding night-time hours; 1-hour lightning strikes are overlaid on a comparison of Suomi NPP VIIRS 0.7 µm Day/Night Band and 11.45 µm IR images at 06:54 UTC or 1:54 AM local time (below). In addition, note the small packet of gravity waves seen propagating southward (away from the area of lightning strikes) on the IR image. Isolated cloud-to-ground lightning strikes continued in this area until the early morning hours, as seen in an animation of GOES-13 IR images.
")
Suomi NPP VIIRS 0.7 µm Day/Night Band and 11.45 µm IR channel image (with 1-hour lightning data)
While not related to the OWLeS field experiment, it was interesting to examine GOES-13 SRSO visible channel images farther to the west over Lake Superior (below; click image to play animation; also available as an MP4 file), which displayed the following: (1) widespead multiple LES bands over much of the lake, which produced as much as 12 inches of snowfall near Deer Park (snowfall reports | Google maps), (2) a curious “solitary standing wave” feature that was oriented roughly parallel to the coastline of the eastern Upper Peninsula of Michigan east of Munising (station identifier KP53), and (3) packets of terrain-induced gravity waves both upwind and downwind of Isle Royale in the northwestern part of the lake (in addition to patches of lake ice both northwest and northeast of the island).
")
GOES-13 0.63 µm visible channel images [click to play animation]
View only this post
Read Less


 plot for Cyclone Ian")
")
")

![GOES-13 0.63 µm visible imagery [click to play animation]](https://cimss.ssec.wisc.edu/satellite-blog/wp-content/uploads/sites/5/2014/01/GOES13_SRSO_Erie_7Jan2014loop.gif "GOES-13 0.63 µm visible imagery [click to play animation]")
![GOES-13 0.63 µm visible imagery [click to play animation]](https://cimss.ssec.wisc.edu/satellite-blog/wp-content/uploads/sites/5/2014/01/GOES13_SRSO_ONTARIO_7Jan2014loop.gif "GOES-13 0.63 µm visible imagery [click to play animation]")
")
")
")

