")
GOES-15 6.5 µm water vapor channel images (click to play animation)
McIDAS images of 4-km resolution GOES-15 6.5 µm water vapor channel data (above; click image to play animation; also available as an MP4 animation) showed the development of a strong and rapidly-occluding storm off the coast of California during the 27 February – 28 February 2014 period.
An AWIPS image of 17:30 UTC GOES-15 water vapor channel data with overlays of 17:28 UTC Metop ASCAT surface scatterometer winds and the 18:00 UTC tropical surface analysis (below) showed satellite-sensed surface winds as strong as 51 knots in the southwestern quadrant of the storm.

GOES-15 6.5 µm water vapor channel image with ASCAT surface scatterometer winds and surface analysis
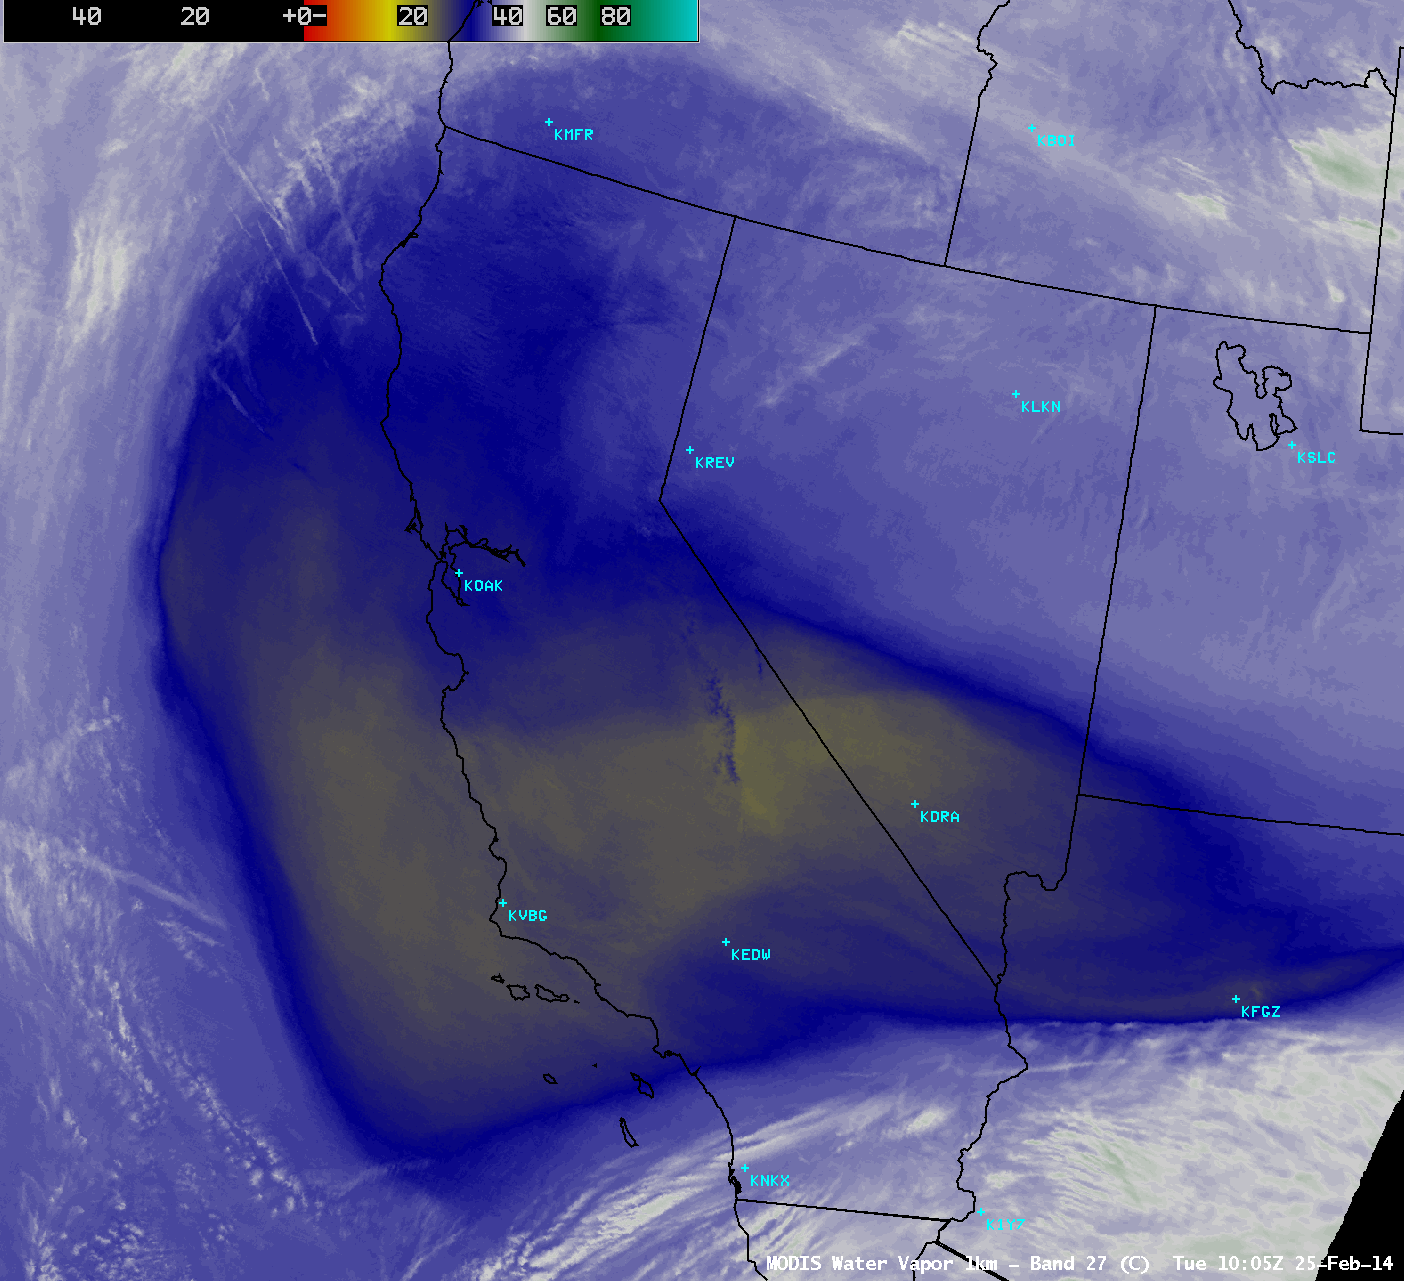
Greater detail in the storm structure could be seen in 1-km resolution MODIS 6.7 µm water vapor channel images at 10:32 UTC and 21:40 UTC (below).

MODIS 6.7 µm water vapor channel images
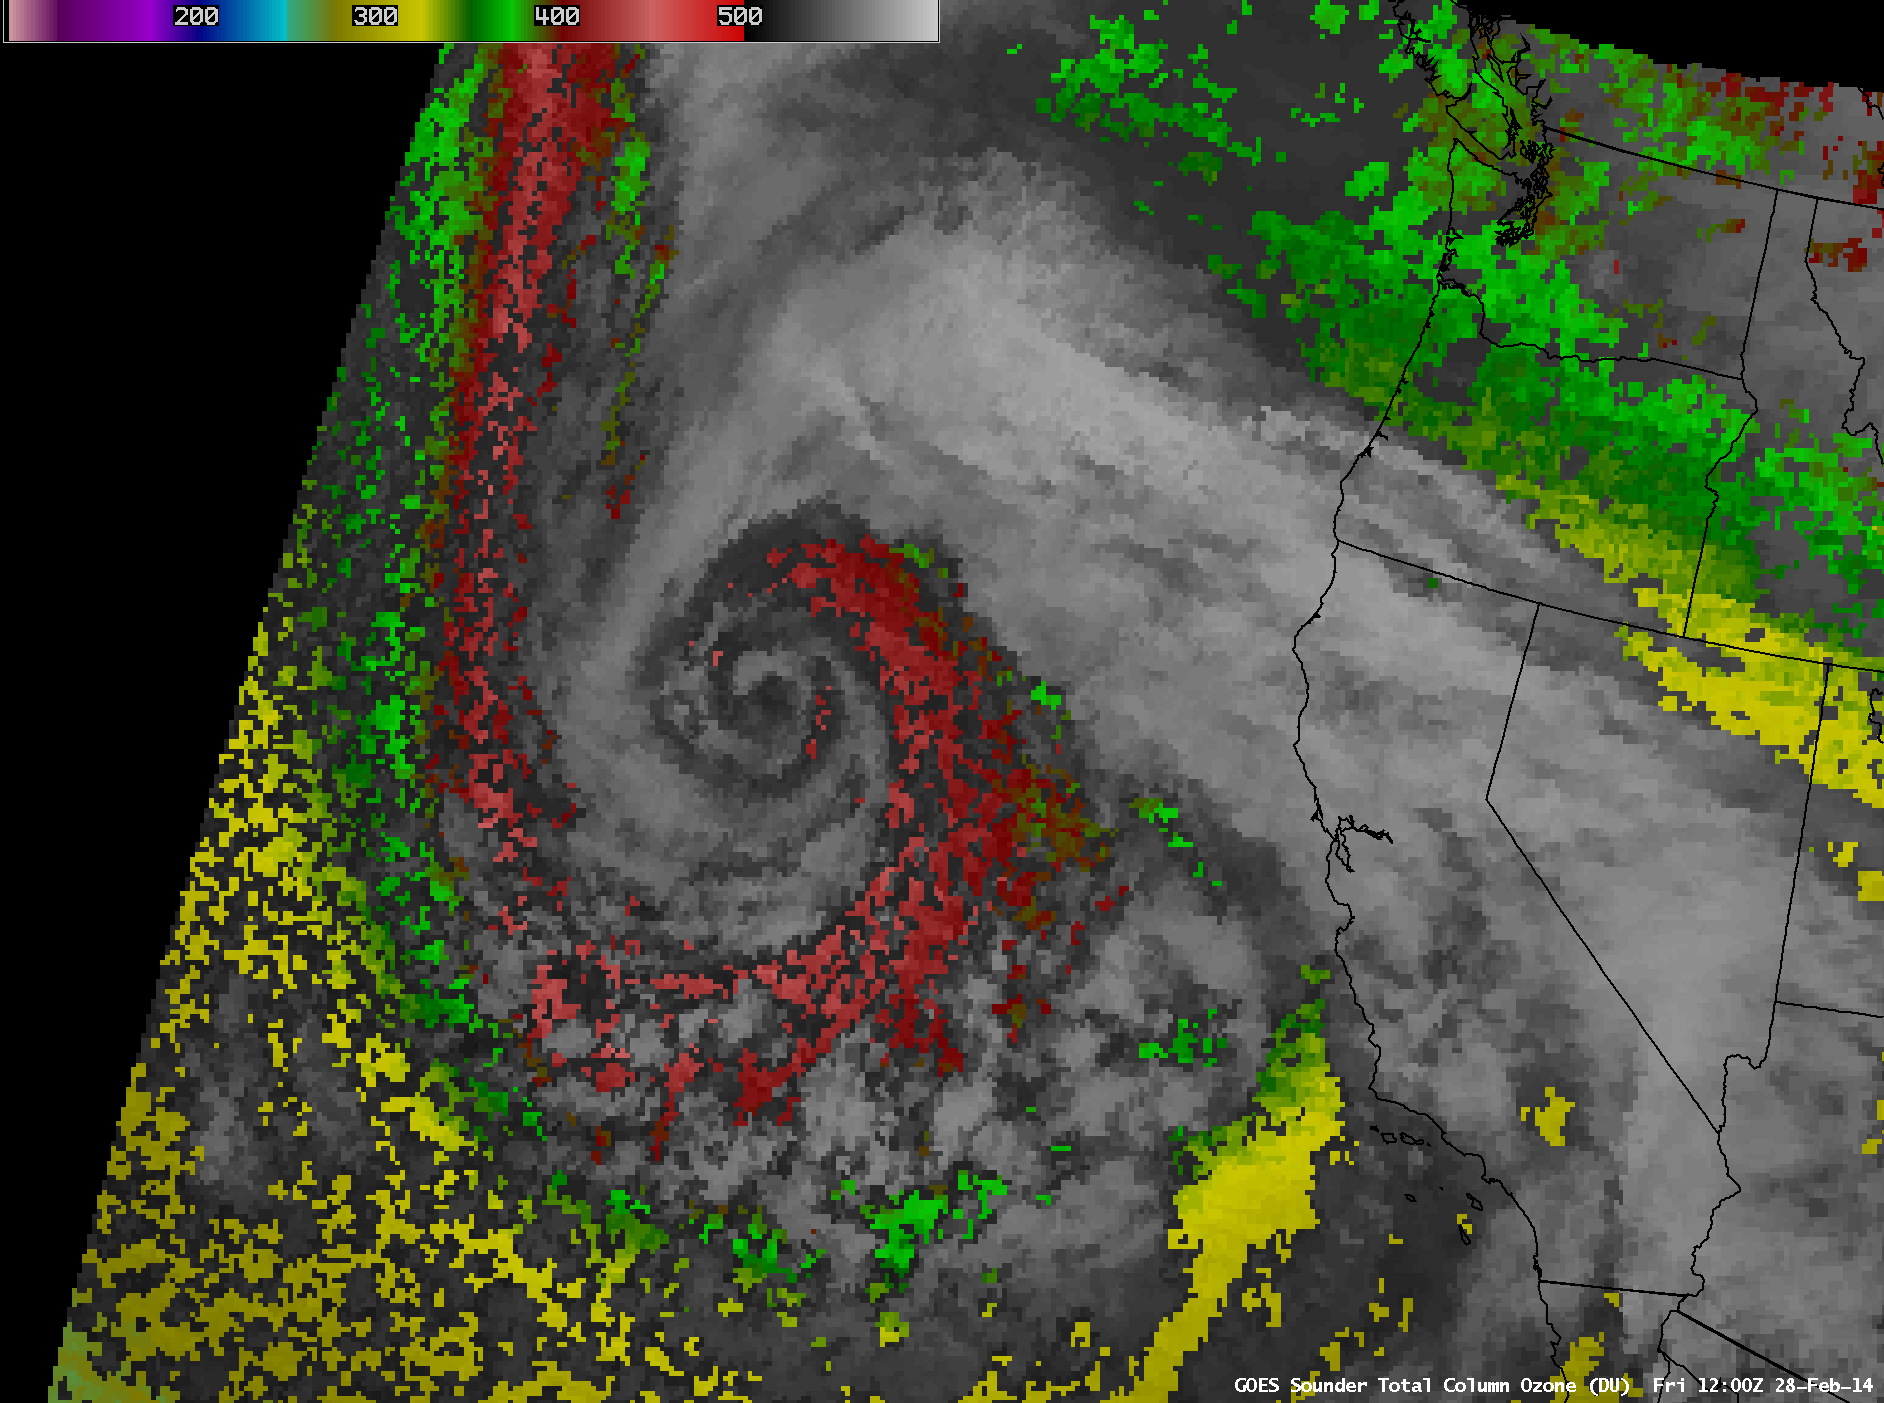
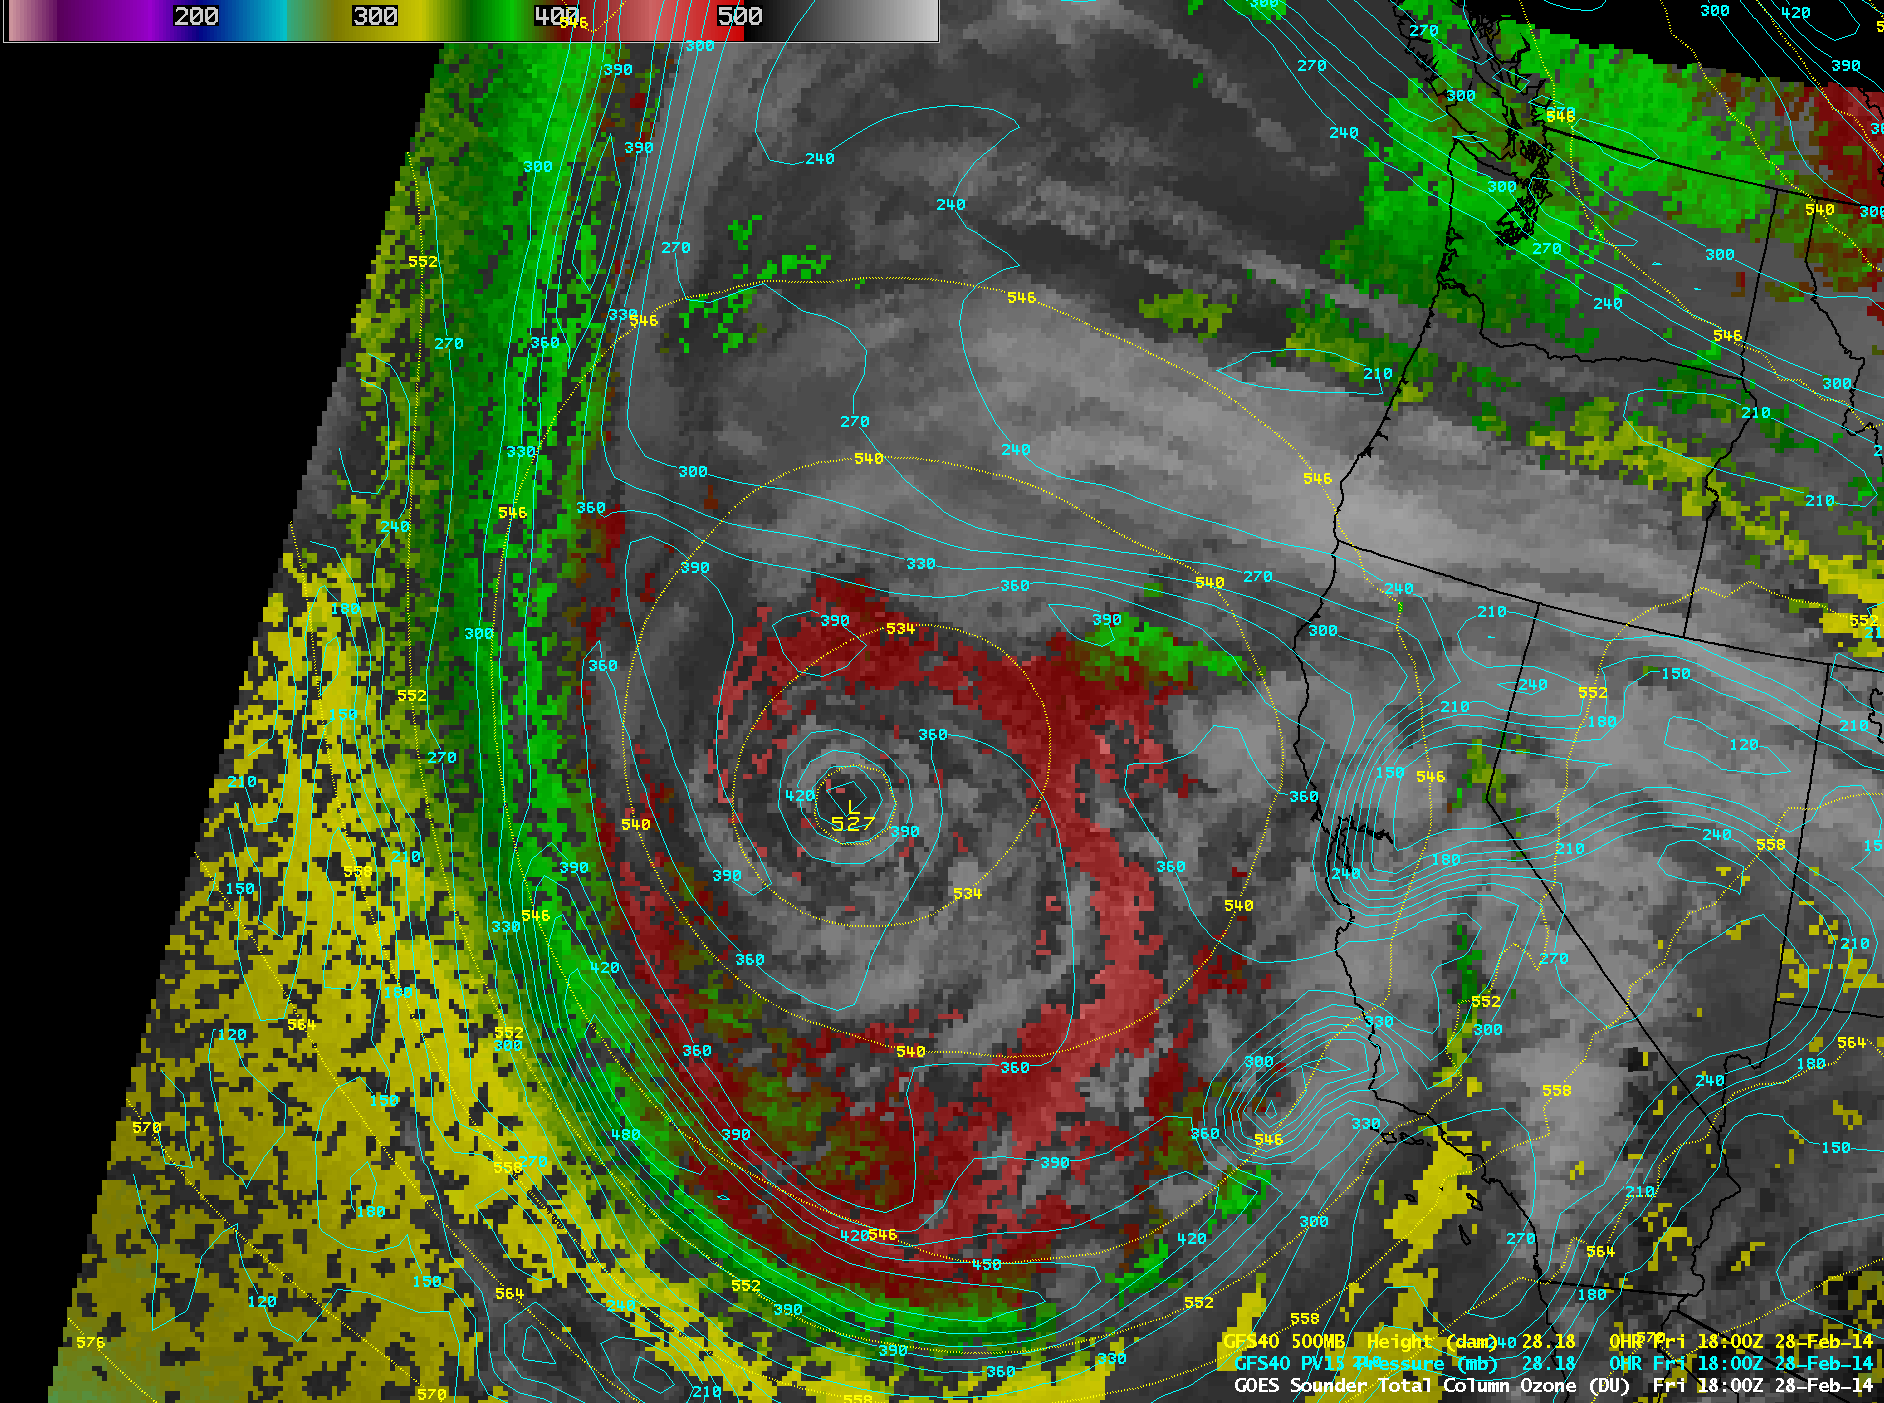
One indication of the strength of the storm was the high amounts of GOES-15 sounder Total Column Ozone associated with the circulation (below; click image to play animation), which reached levels as high as 440-450 Dobson Units (lighter red color enhancement). Such high levels of total column ozone are also often associated with potential vorticity anomalies and a dramatically lowered tropopause — in this case, the GFS40 model indicated the the dynamic tropopause (taken to be the pressure of the PV1.5 surface) was as below the 480 hPa pressure level at 18:00 UTC. It is interesting to note that there was a pilot report of moderate turbulence at 36,000 feet, along the sharp western gradient of the total column ozone (and the sharp gradient of the PV1.5 pressure) — the pilot noted that the turbulene lasted for 10 minutes.
")
GOES-15 sounder Total Column Ozone product (click to play animation)
A comparison of 375-meter resolution Suomi NPP VIIRS 0.64 µm visible channel and 11.45 µm IR channel images at 22:08 UTC (below) revealed a few convective elements offshore which exhibited cloud-top IR brightness temperatures as cold as -50º C (yellow color enhancement), with a few cloud-to-ground lightning strikes being detected.
")
Suomi NPP VIIRS 0.64 µm visible channel and 11.45 µm IR channel images (with cloud-to-ground lightning strikes)
===== 01 March Update =====

Suomi NPP VIIRS 0.7 µm Day/Night Band and 11.45 µm IR channel images
A comparison of Suomi NPP VIIRS 0.7 µm Day/Night Band (DNB) and 11.45 µm IR channel images at 10:22 UTC or 2:22 AM local time on 01 March (above) revealed the presence of numerous arc-shaped mesospheric airglow waves in the western semicircle of the storm circulation on the DNB image — note that there was no corresponding wave signature on the IR image.
These vertically-propagating mesospheric airglow waves were likely generated by the 140-knot jet streak that was moving southward around the rear side of the storm (below).

Suomi NPP VIIRS 0.7 µm Day/Night Band image with NAM 250 hPa winds and isotachs
View only this post Read Less
![GOES-13 Visible <em>(0.63 µm)</em> images [click to play animation]](https://cimss.ssec.wisc.edu/satellite-blog/wp-content/uploads/sites/5/2014/02/140227_g13_vis_great_lakes_anim.gif "GOES-13 Visible <em>(0.63 µm)</em> images [click to play animation]")


")
")

")
