Advanced Dvorak Technique (ADT) intensity estimate
A plot of the Advanced Dvorak Technique intensity estimate for Tropical Cyclone Bansi (above) showed that the storm experienced a period of rapid intensification late in the day on 12 January 2015, reaching Category 4 intensity by 00 UTC on 13 January.
EUMESAT Metosat-7 11.5 µm IR channel images (below; click to play animation; also available as an MP4 movie file) revealed the formation of a well-defined eye, which also exhibited a notable amount of trochoidal motion or “wobble” as it moved across the southwest Indian Ocean (north of Reunion and Mascarene Island).
Meteosat-7 11.5 µm IR channel images (click to play animation)
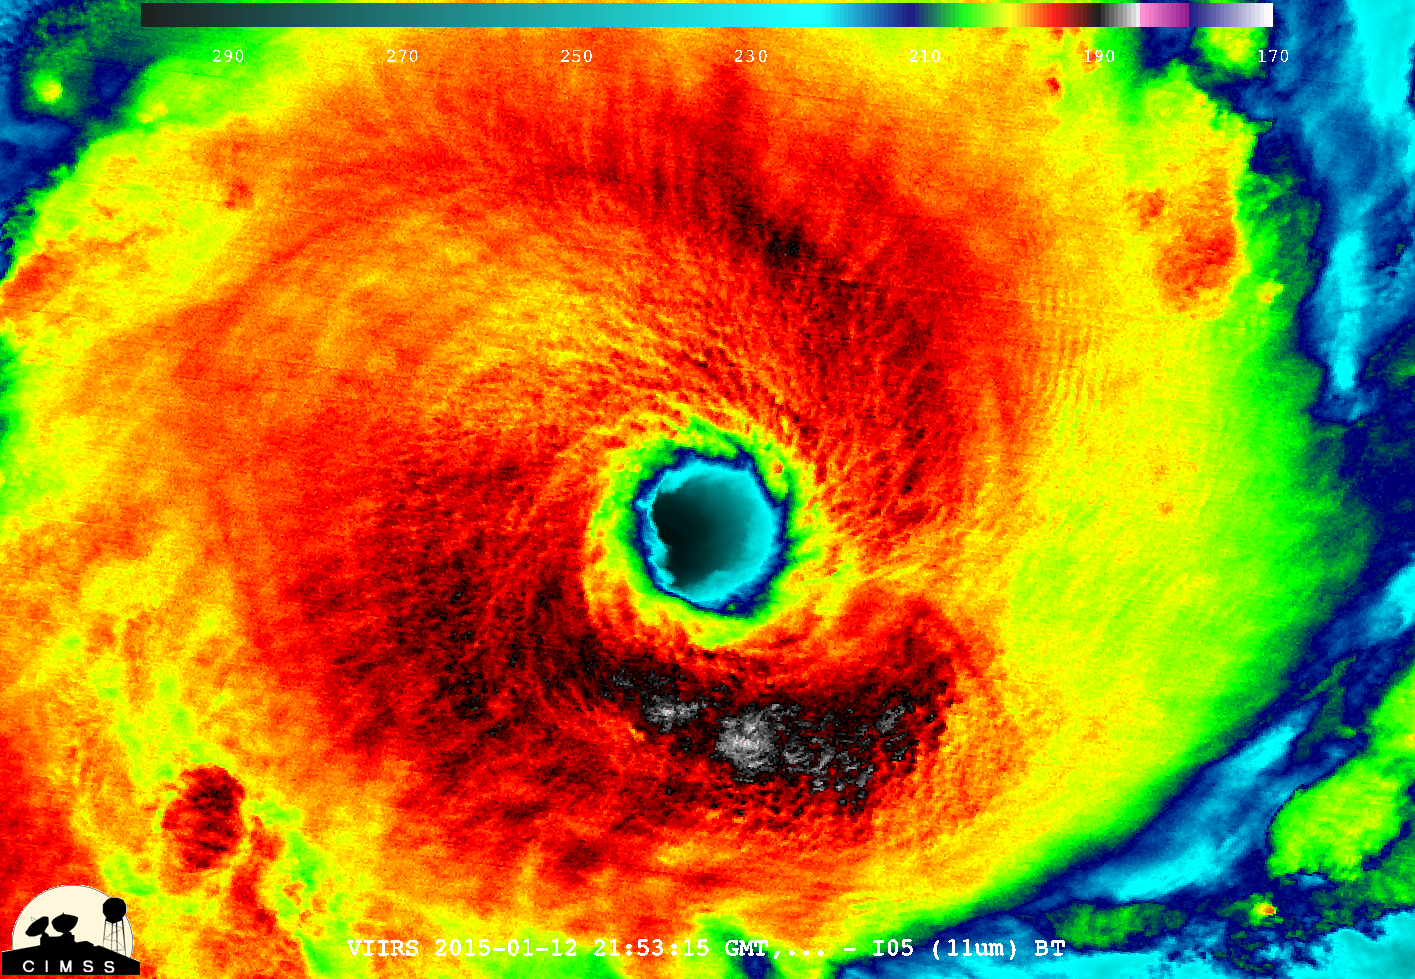
A more detailed view of Tropical Cyclone Bansi was provided by McIDAS-V images of Suomi NPP VIIRS 11.45 µm IR and 0.7 µm Day/Night Band data (below; credit: William Straka, SSEC) — deep convection with overshooting tops could be seen in the southern quadrant eyewall region, with gravity waves propagating radially outward across the northeastern and eastern portion of the cirrus canopy.

Suomi NPP VIIRS 11.45 µm IR and 0.7 µm Day/Night Band images
A DMSP SSMIS 85 GHz microwave image from the CIMSS Tropical Cyclones site (below) showed that a prominent “moat” of warm brightness temperatures (darker blue color enhancement) existed around the center of Bansi at 14:24 UTC on 13 January. The presence of such a moat usually signifies that the secondary (outer) eyewall formation process has completed, and an eyewall replacement cycle is underway (also signalling that the period of rapid intensification has ended). The moat feature is sustained by subsidence from the eyewall secondary circulations.
DMSP SSMIS 85 GHz microwave image
Note that there was no well-defined eye evident on the conventional Meteosat-7 IR image during this eyewall replacement cycle (below).
Meteosat-7 11.5 µm IR channel and DMSP SSMIS 85 GHz microwave images
View only this post Read Less


