
GOES-12 10.7 µm IR images
Madison, Wisconsin received 3.63 inches (92 mm) of rainfall on 22 September 2009 — much of it within a 4 hour period — which set a record for the highest rainfall amount for any day during the month of September (additional details are available from the NWS Milwaukee/Sullivan). AWIPS images of the GOES-12 10.7 µm IR Window channel (above) showed that the cloud top IR brightness temperatures were rather unremarkable, with only a few areas exhibiting temperatures colder than -50º C (yellow color enhancement) during the heavy rainfall event. The 1-km resolution AVHRR Cloud Top Temperature values were only slightly colder, at -54º C — this corresponded to a AVHRR Cloud Top Height of 11-12 km.
GOES-12 visible images (below) did not show any pronounced cloud top texture or shadowing that would indicate strong convective elements over southern Wisconsin — in fact, there were no cloud-to-ground lightning strikes seen during the day, and no thunder was reported at any of the first order observing stations.

GOES-12 visible images

Blended Total Precipitable Water product
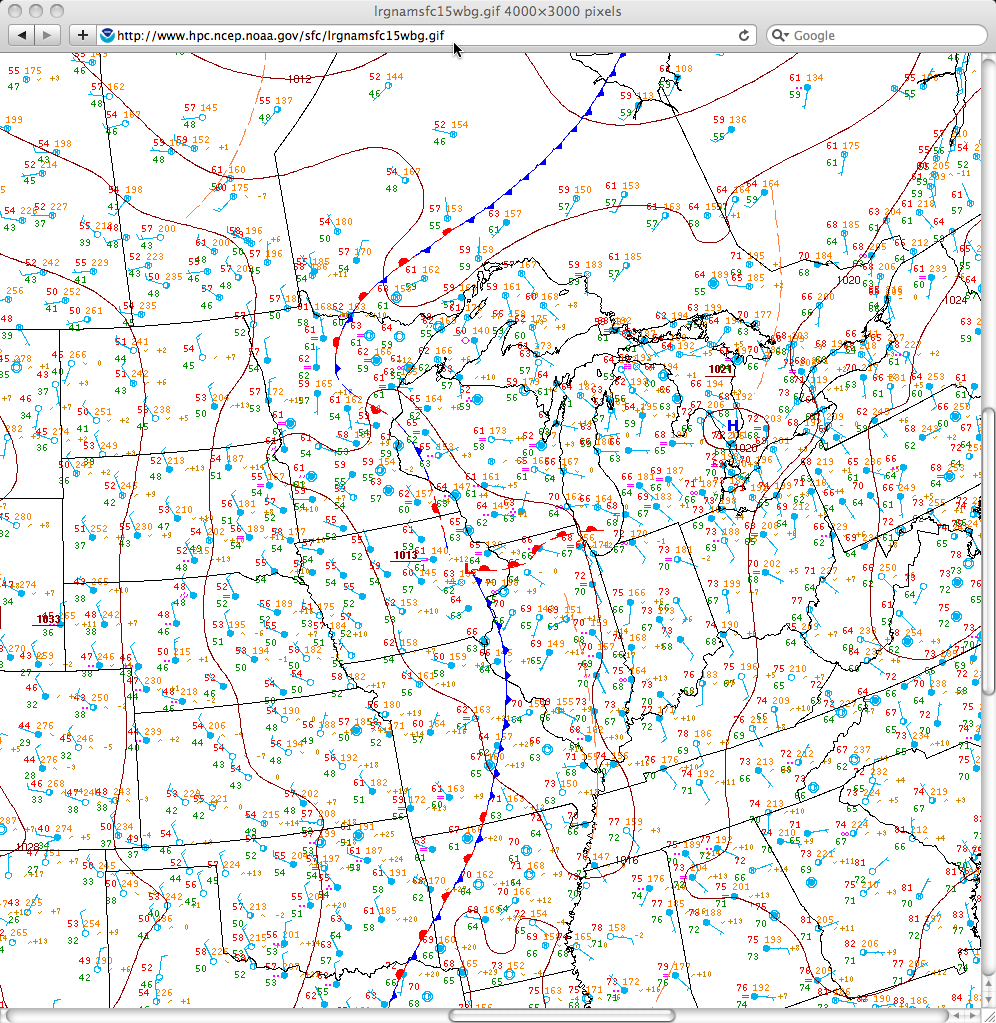
The Blended Total Precipitable Water (TPW) product (above) did reveal that an area of TPW values of 40 mm and greater (red colors) developed across northern Illinois and far eastern Iowa after about 08 UTC — this seemed to be associated with a disturbance that developed and moved northward along and ahead of a frontal boundary that was moving slowly eastward across the region. It should be noted that these TPW values were about 175-200% above normal.
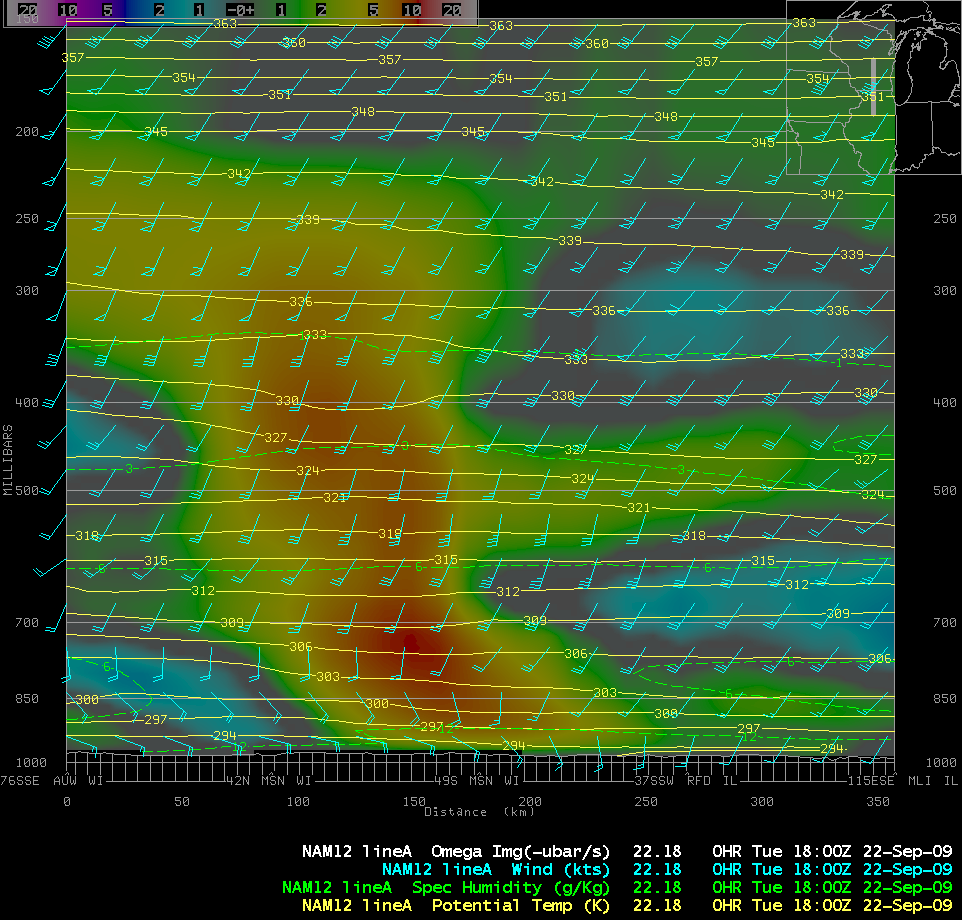
However, about 5 hours earlier the MODIS TPW product displayed TPW values of 40 mm and higher (red colors) over parts of northwestern Illinois, at a time when the Blended TPW product was still only indicating TPW values of 30-35 mm (below). This area of higher TPW values over northern Illinois was then advected northward during the day, and lifted along and ahead of a developing warm frontal boundary. A cross section oriented north to south showed a deep column of upward vertical motion (omega values of 10 µbars per second, red colors) over southern Wisconsin.

Blended TPW + MODIS TPW products
View only this post Read Less
")
")
 + MTSAT-1R visible images")
")


")
")


