During the northwestward flight of AirAsia 8501 from Surabaya, Indonesia to Singapore, contact was lost with the aircraft over the Java Sea (likely east of the island of Pulau Belitung) on 28 December 2014 (late 27 December UTC time). Using the SSEC RealEarth web... Read More
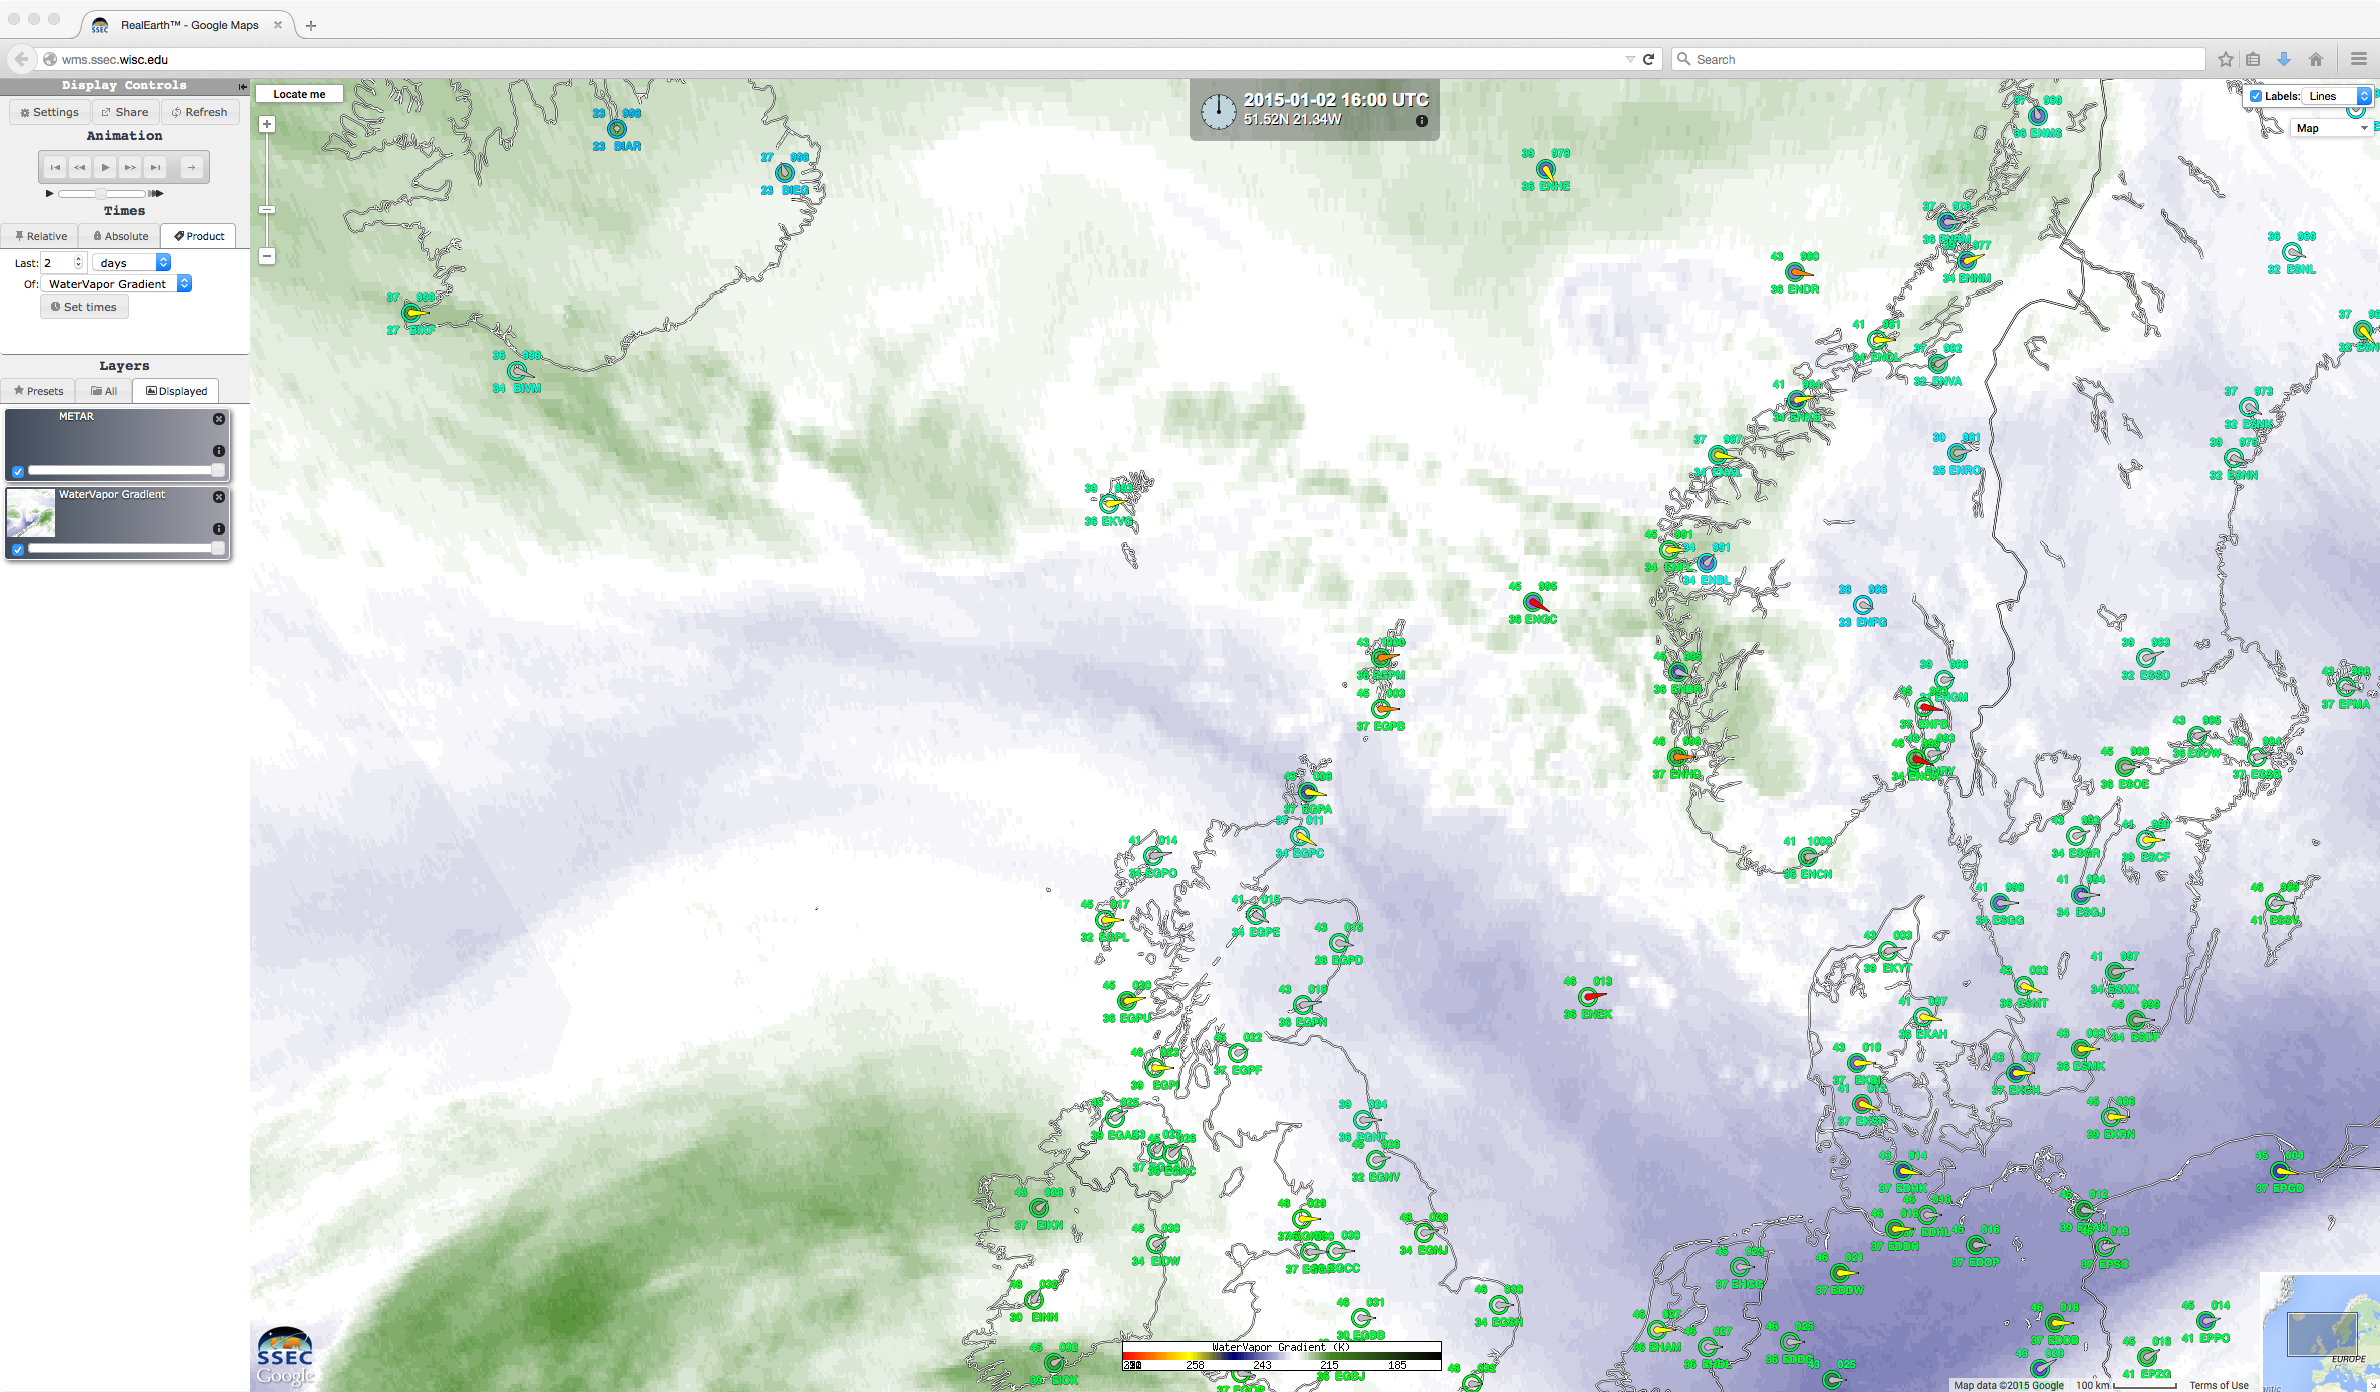
SSEC RealEarth fade between the regional map and the 23:00 UTC MTSAT-2 10.8 µm IR image
During the northwestward flight of AirAsia 8501 from Surabaya, Indonesia to Singapore, contact was lost with the aircraft over the Java Sea (likely east of the island of Pulau Belitung) on 28 December 2014 (late 27 December UTC time). Using the SSEC RealEarth web map server site, a fade between the regional map and the MTSAT-2 10.8 µm IR image at 23:00 UTC is shown above. The satellite image revealed that there were clusters of deep convection (thunderstorms with very high, very cold cloud tops) over the middle portion of the flight path.
COMS-1 10.8 µm IR channel images (click to play animation)
COMS-1 10.8 µm IR channel images (above; click to play animation; also available as an MP4 movie file) indicated that the coldest cloud-top IR brightness temperatures were in the -80º to -85ºC range (violet color enhancement) with these thunderstorms. The location of Surabaya, Indonesia (station identifier WARR) and Singapore (station identifier WSSS) are annotated on the images; the last point of contact (at 23:24 UTC) was approximately within the circle drawn just to the left of the center of the images, when the aircraft was flying at an altitude of 32,000 feet (9.75 km) over the Java Sea. There were reports from various media sources that the pilots had requested to divert their flight path and climb to a higher altitude to avoid adverse weather conditions not long before contact was lost.
The corresponding COMS-1 0.675 µm visible channel images (below; click to play animation; also available as an MP4 movie file) showed evidence that there were some overshooting tops associated with these thunderstorms.
COMS-1 0.675 µm visible channel images (click to play animation)
——————————————————————–
MTSAT-2 10.8 µm IR channel image (click to enlarge)
Given that there was a long gap in available COMS-1 images (between 23:00 and 23:45 UTC), a closer view is shown using the 23:32 UTC MTSAT-2 10.8 µm IR channel (above) and 0.675 µm visible channel images (below). A circle is again drawn near the center of the MTSAT-2 images to denote the approximate location of final radar contact with the aircraft at 23:24 UTC — and the intended final destination of Singapore (WSSS) is labelled in the upper left corner of the images. Similar to what was seen in the COMS-1 images, the coldest cloud-top IR brightness temperature in the area at that time was -81.4ºC, and there was evidence of overshooting tops in the near vicinity on the visible image. (Note: due to the far southern location just below the Equator, the flight region on the 22:00 COMS-1 image was actually being scanned around 22:07 UTC, while on the 22:32 UTC MTSAT-2 image the flight region was being scanned around 22:39 UTC).
MTSAT-2 0.675 µm visible channel image (click to enlarge)
A nearby rawinsonde report from Pangkalpinang (station identifier 96237 on the MTSAT-2 images) showed that the aircraft cruising flight level of 32,000 feet was near 300 hPa (9750 meters above ground level), where the air temperature was -29.3ºC and winds were from the west-southwest at 16 knots (below). The tropopause appeared to be around 100 hPa (at a height of 54,265 feet or 1654 km), with an air temperature of -86.5ºC — close to the coldest cloud-top IR brightness temperatures seen on the COMS-1 and MTSAT-2 IR images. Moisture was abundant throughout the atmospheric column, with a Total Precipitable Water value of 52.4 mm or 2.1 inches.
Pangkalpinang, Indonesia rawinsonde report
MTSAT-2 water vapor image derived atmospheric motion vectors from the CIMSS Tropical Cyclones site (below) showed that upper-tropospheric winds over the flight region (located at the far top center portion of the images) before, during, and after the flight time were generally southwesterly to westerly in the 15-30 knot range.
MTSAT-2 6.57 µm water vapor channel images with upper-tropospheric atmospheric motion vectors
Deep convection is not uncommon in this region during this time of the year, when the Intertropical Convergence Zone (ITCZ) migrates southward during the Southern Hemisphere summer season. The presence of warm sea surface temperatures along with abundant Total Precipitable Water over western Indonesia (below) helps to create an environment that is favorable for the growth and maintenance of large thunderstorms.
Global image of Sea Surface Temperatures on 27 December
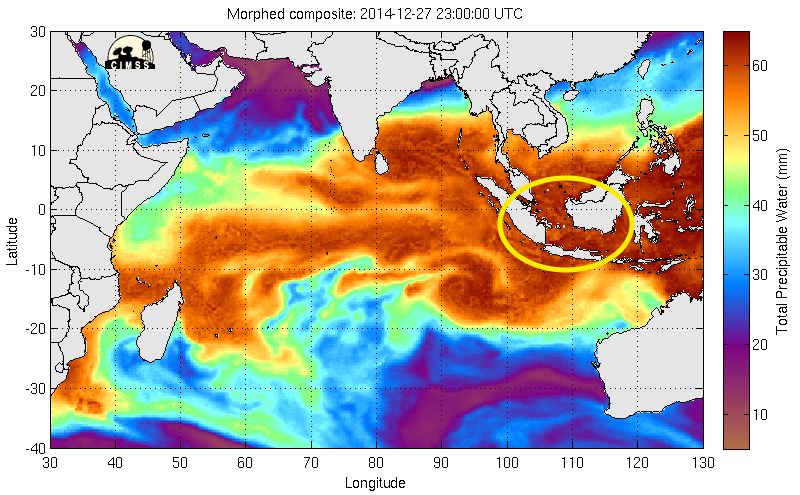
25-27 December MIMIC Total Precipitable Water product (click to play animation)
For an additional detailed meteorological analysis of this event, see the Weather Graphics site.
===== 30 December Update =====
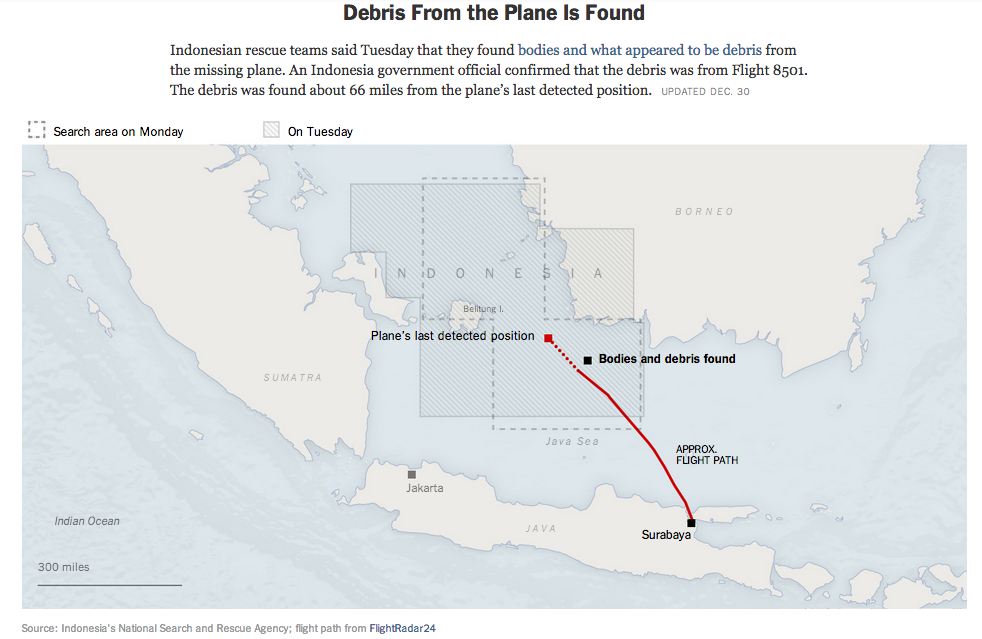
Map of AirAsia Flight 8501, and location of initial debris (credit: New York Times)
On the third day of the search, aircraft debris and bodies of passengers were discovered about 66 miles southwest of the last known coordinates of AirAsia Flight 8501 (above). The prevailing ocean current in the Java Sea (below) may have displaced some of the debris southwestward from the actual crash site.
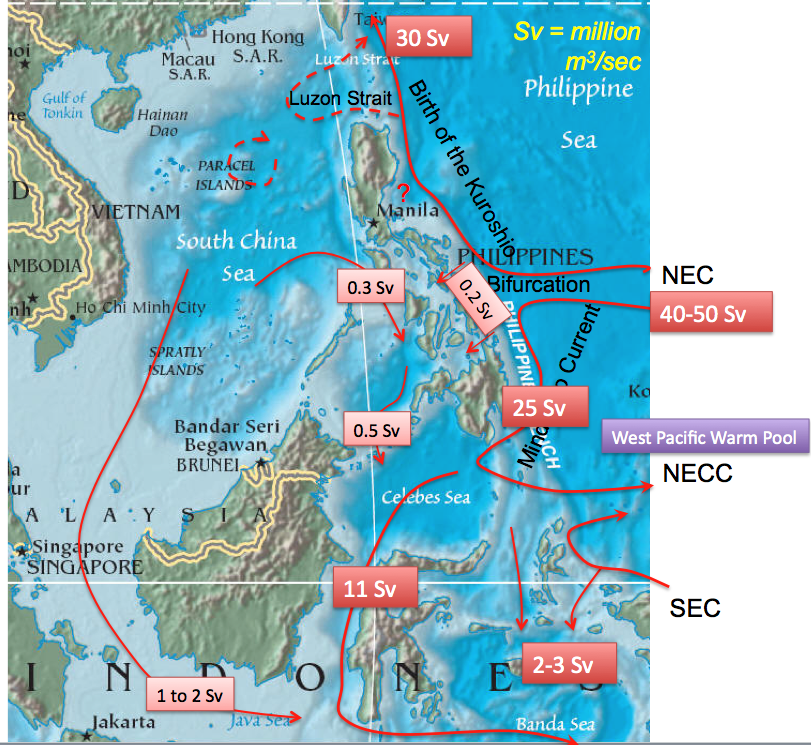
Map of ocean currents (credit: Columbia University Earth Institute)
The Indonesian Bureau of Meteorology, Climate, and Geophysics (BMKG) released their meteorological analysis of the AirAsia 8501 crash on 31 December.
View only this post
Read Less

