
AWIPS images of the MIMIC Total Precipitable Water product (above; click image to play animation) showed a broad moist plume in the equatorial South Pacific Ocean, within which Tropical Storm Niko began to develop during the 19 January – 20 January 2015 period. By... Read More
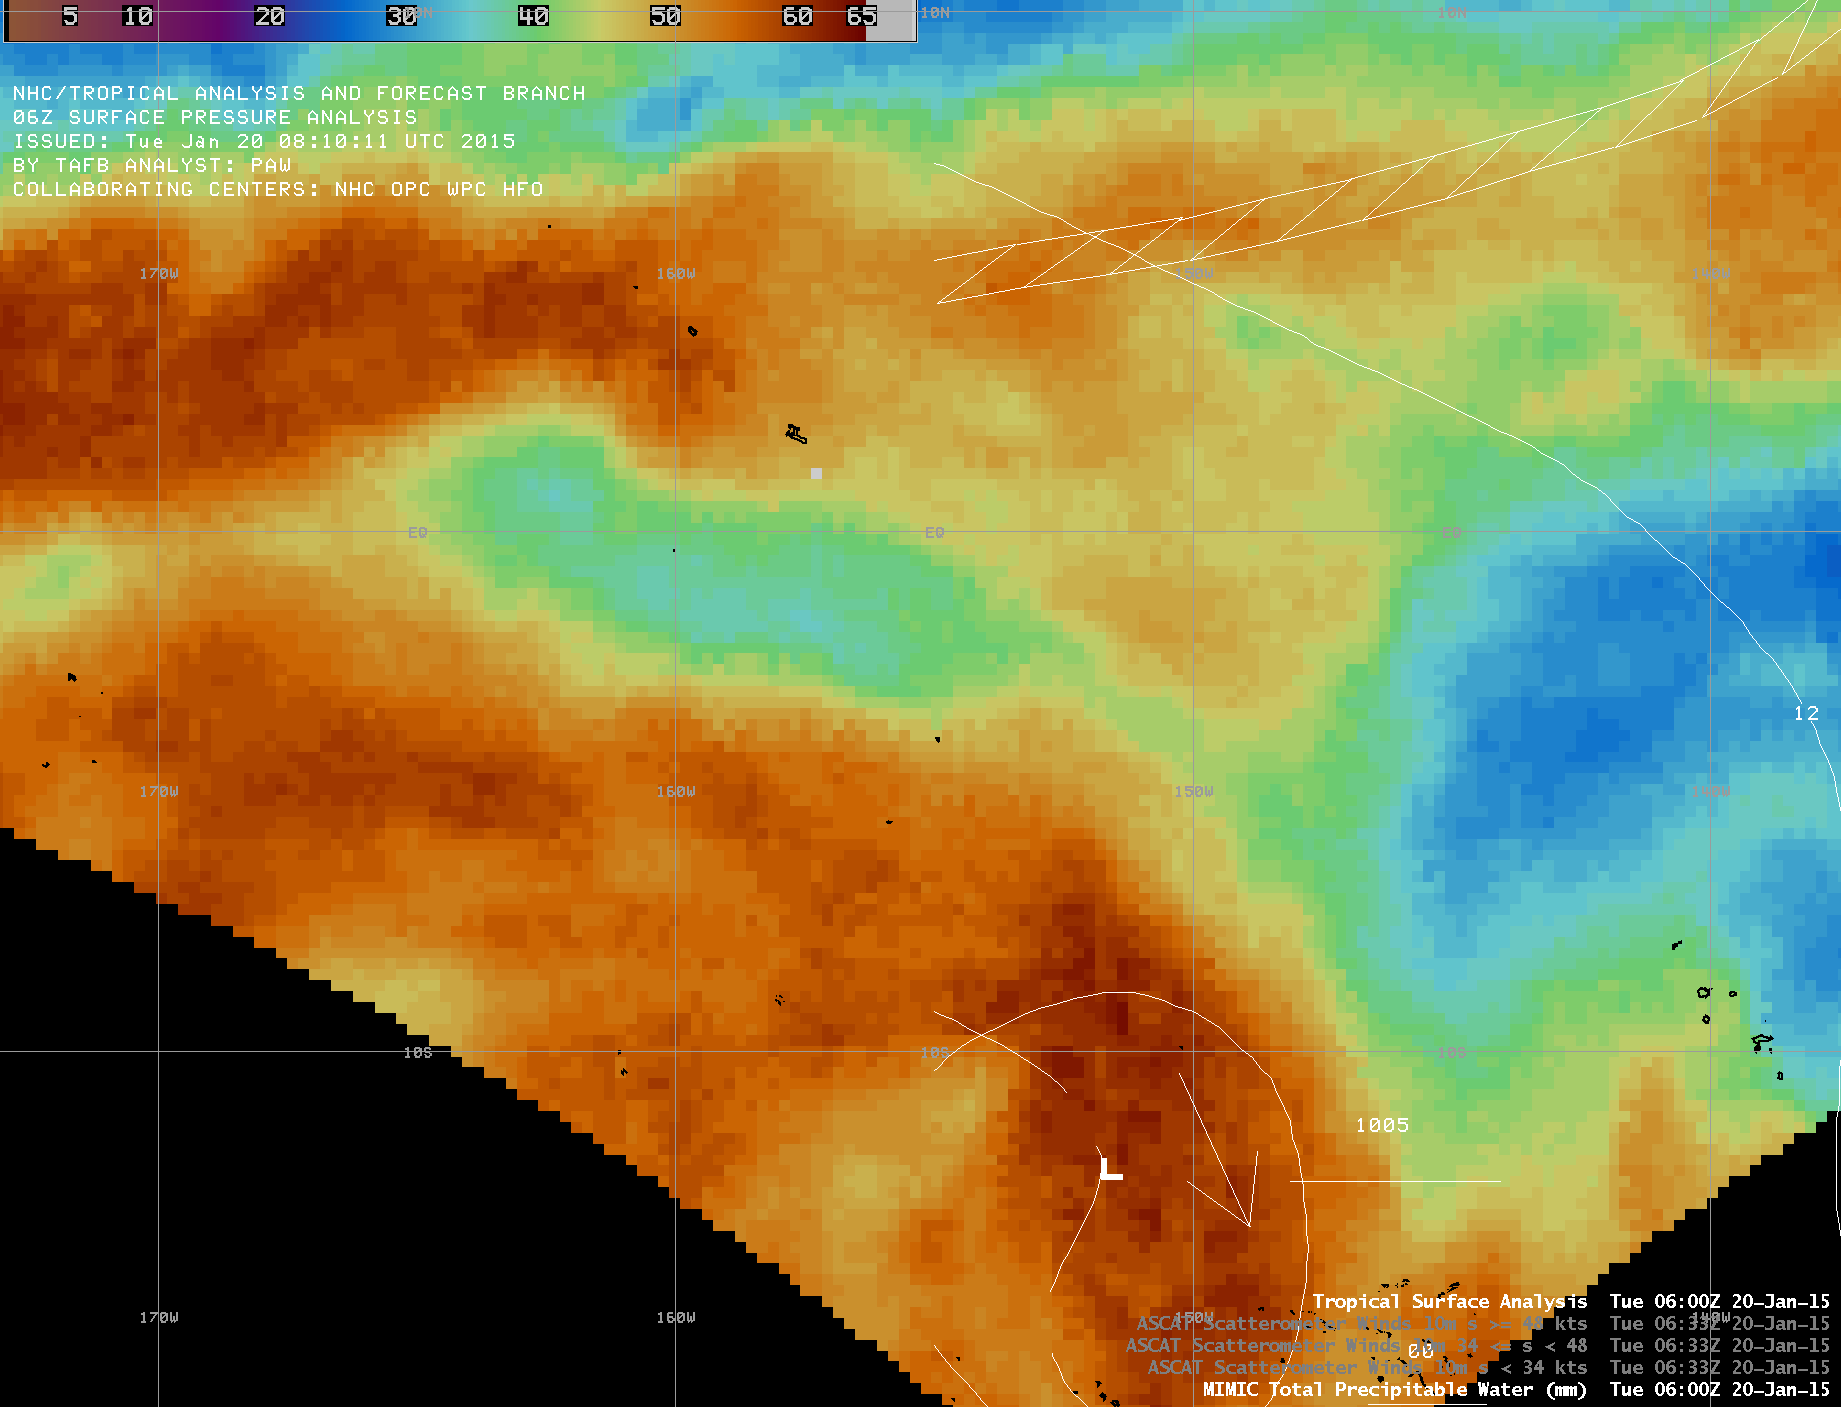
MIMIC Total Precipitable Water product, with Tropical Surface Analyses (click to play animation)
AWIPS images of the MIMIC Total Precipitable Water product (above; click image to play animation) showed a broad moist plume in the equatorial South Pacific Ocean, within which Tropical Storm Niko began to develop during the 19 January – 20 January 2015 period. By the end of the animation, Gale Force winds were being analyzed within the eastern semicircle of the developing cyclone. Metop ASCAT surface scatterometer winds at 08:01 UTC (below) showed winds as strong as 42 knots (though the direction of the stronger yellow wind barbs was suspect, likely due to rain contamination).
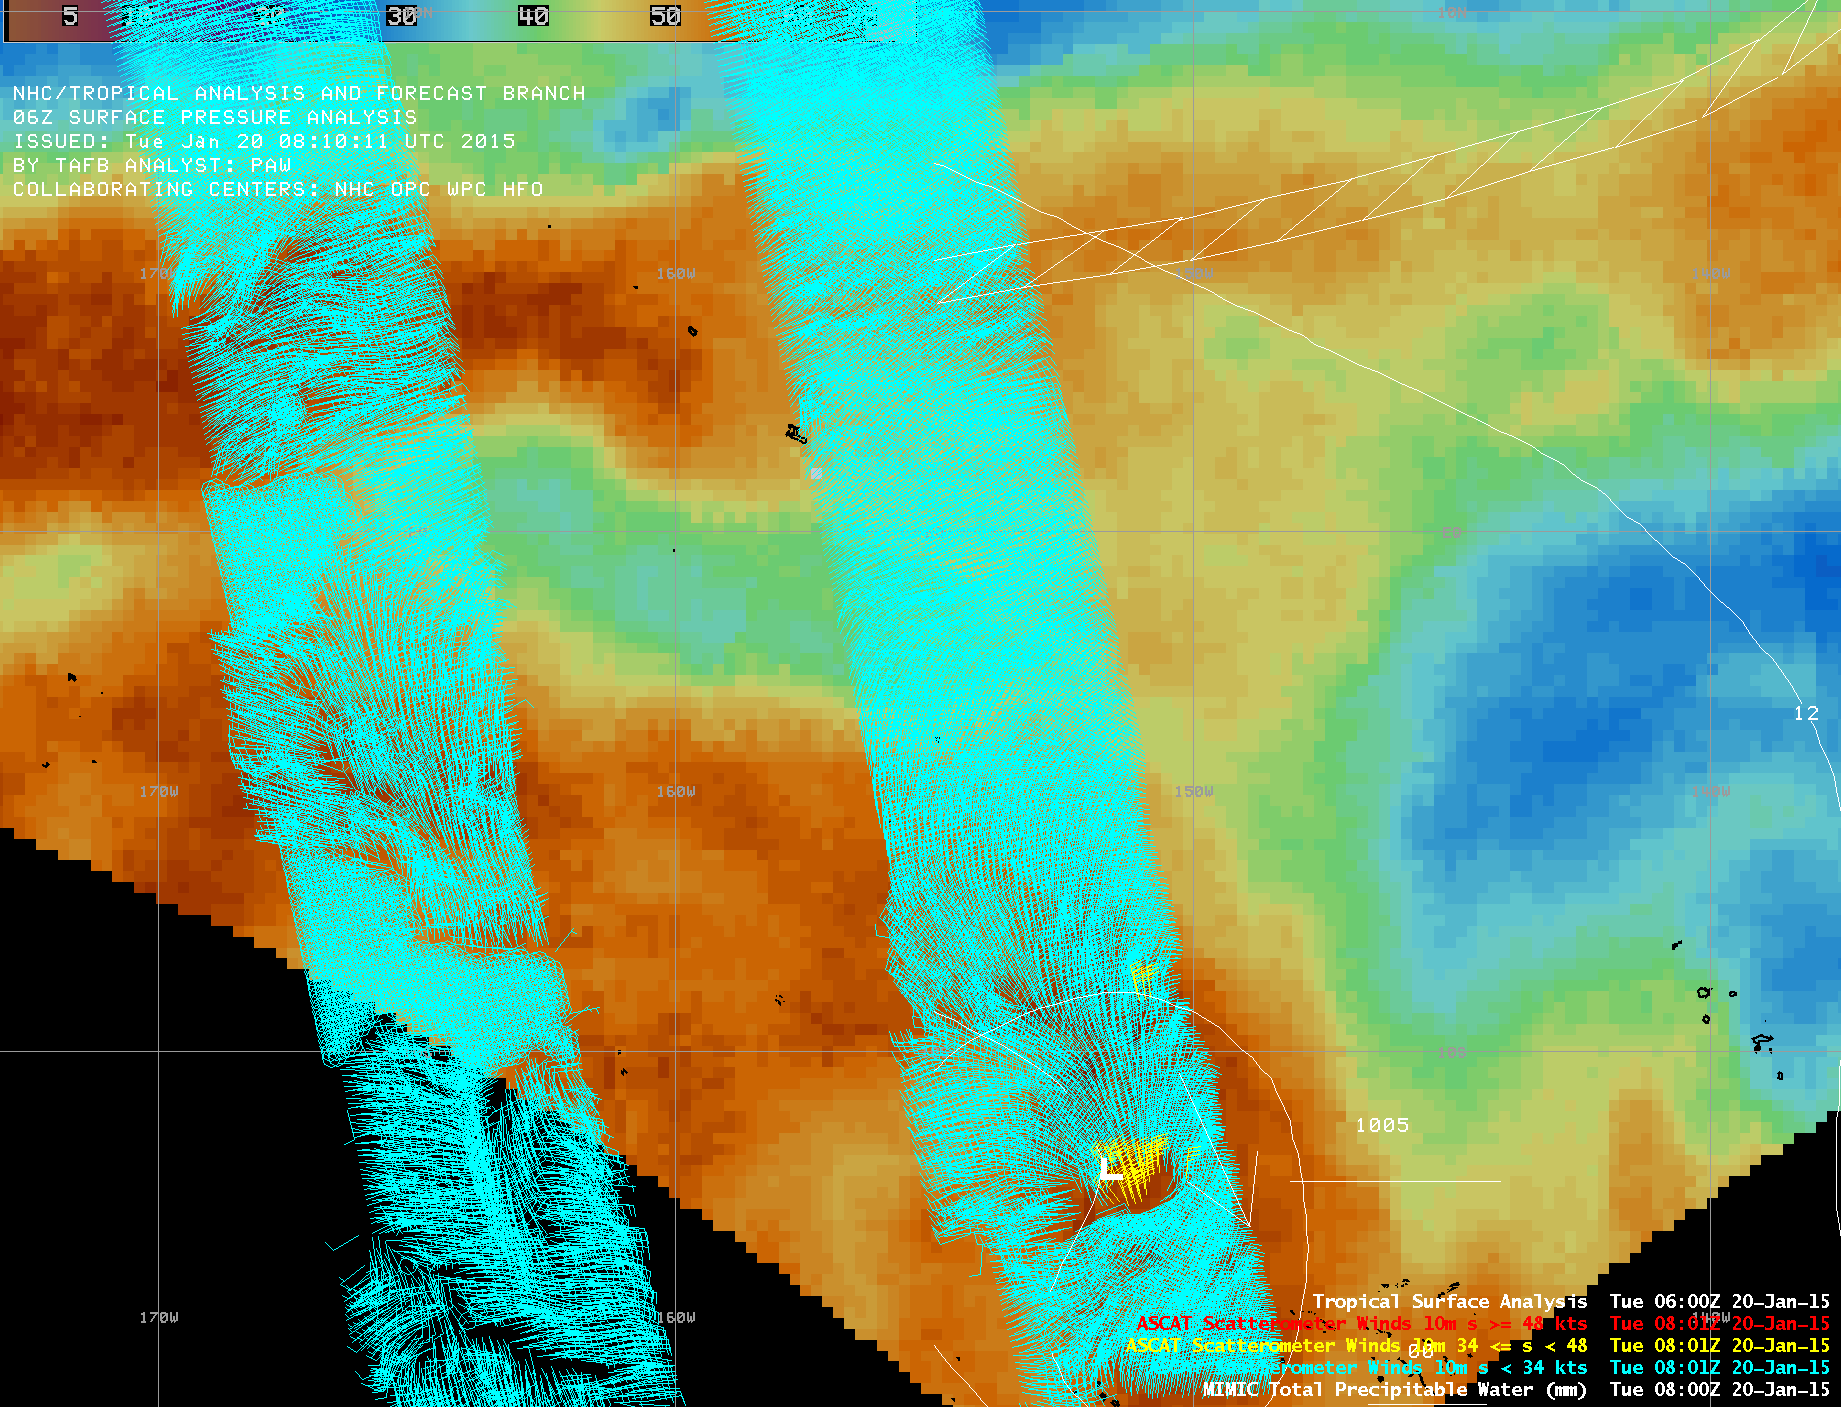
MIMIC TPW product, with Metop ASCAT surface scatterometer winds
After daybreak on 20 January, McIDAS images of GOES-15 (GOES-West) 0.63 µm visible channel data (below; click image to play animation) showed the development of spiral banding wrapping into the central low-level circulation center as the system reached tropical storm intensity by 18 UTC. In addition, a few strong convective pulses with distinct overshooting tops could be seen near the core of Niko.
GOES-15 0.63 µm visible channel images (click to play animation)
An animation of GOES-15 10.7 µm IR channel images from the CIMSS Tropical Cyclones site (below) included an overlay of contours of the deep layer (200 – 850 hPa) wind shear at 18 UTC — Tropical Storm Niko developed in a region characterized by low wind shear, which enabled the storm to rapidly intensify.
GOES-15 10.7 µm IR channel images, with contours of deep layer wind shear
View only this post
Read Less


