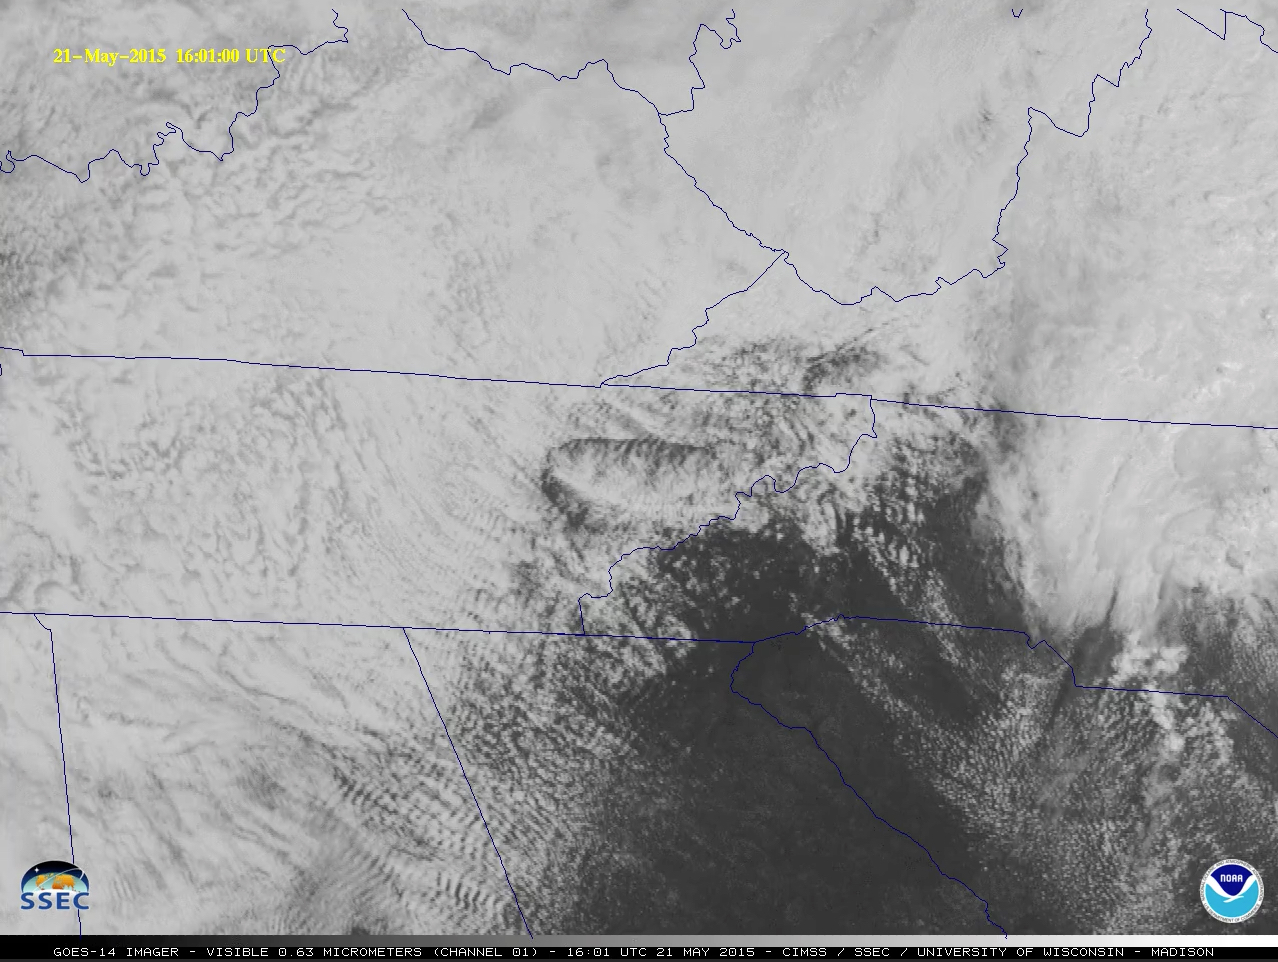
GOES-14 remained in Super Rapid Scan Operations for GOES-R (SRSO-R) demonstration mode on 21 May 2015, providing 1-minute images for much of the eastern US (see this blog post) — and another interesting feature was seen over eastern Tennessee that was rather perplexing. Since this easily qualified for the “What the heck is this?” blog category, we thought it might be fun to have a contest of sorts and invite readers to submit their wild guesses and/or educated explanations. We will post more imagery later in the day on 22 May as to our explanation — but in the meantime, leave a comment on the blog (comments are moderated, so they will not appear until approved), or send your thoughts to our Twitter account.
—– 22 May Update —–
Thanks to all who submitted their suggestions here and on Twitter of an explanation of the “What the heck is this” feature; Here is our best guess:
![GOES-13 (GOES-East) visible, 3.9 µm shortwave IR, 6.5 µm, and 10.7 µm IR images [click to play animation]](https://cimss.ssec.wisc.edu/satellite-blog/wp-content/uploads/sites/5/2015/05/150521_goes13_4panel_anim.gif)
GOES-13 (GOES-East) visible, 3.9 µm shortwave IR, 6.5 µm, and 10.7 µm IR images [click to play animation]
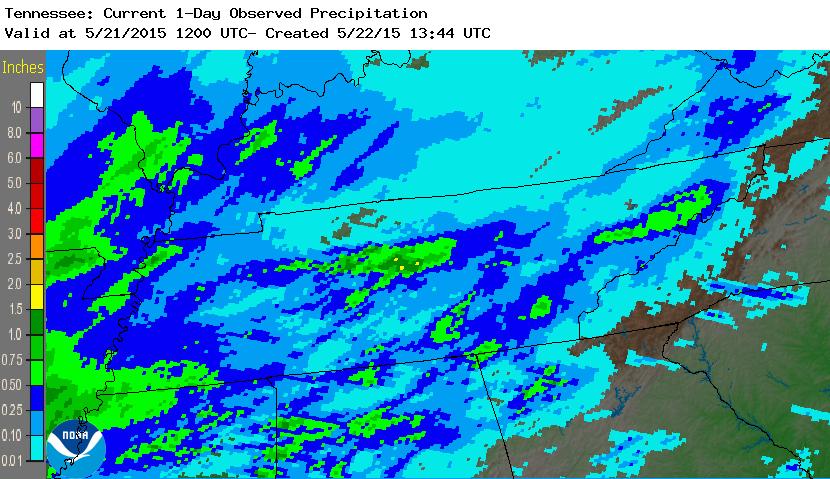
However, the METAR surface reports offer an important clue: a rain shower moved from southwest to northeast through the region during the preceding overnight hours with the passage of a weak low pressure system (surface analyses), with Knoxville (station identifier KTYS) receiving 0.23″ and Oak Ridge (KOQT) receiving 0.10″ of rainfall (radar-estimated 24-hour precipitation). Therefore, one plausible explanation of the feature seen on visible imagery is that it was a shallow pool of stable, rain-cooled air near the surface that was spreading out and flowing downslope (westward) into the Great Valley of East Tennessee during the morning and early afternoon hours.
While the outer edges of this rain-cooled stable air feature remained generally cloud-free, the inner core exhibited a good deal of cloud development (including what appeared to be a more dense northwest-to-southeast oriented cloud band through the middle). An overlay of hourly RTMA surface winds (below; click image to play animation) indicated that there was convergence within the feature (to the lee of higher terrain within the Cumberland Plateau), which along with daytime heating of the moist soil would have helped to promote such shallow cloud development.
![GOES-13 0.63 µm visible channel images, with RTMA surface winds [click to play animation]](https://cimss.ssec.wisc.edu/satellite-blog/wp-content/uploads/sites/5/2015/05/150521_goes13_visible_rtma_surface_winds_anim.gif)
GOES-13 0.63 µm visible channel images, with RTMA surface winds [click to play animation]
CLAVR-x POES AVHRR Cloud Type, Cloud Top Height, and Cloud Top Temperature products
View only this post Read Less
![Day 1 Outlook for Convection from SPC, issued at 1300 UTC 21 May 2015 [click to enlarge]](https://cimss.ssec.wisc.edu/satellite-blog/wp-content/uploads/sites/5/2015/05/day1otlk_1300_21May2015.gif)
![GOES-13 Sounder DPI values of Lifted Index, 1600 UTC 21 May 2015 [click to enlarge]](https://cimss.ssec.wisc.edu/satellite-blog/wp-content/uploads/sites/5/2015/05/GOES_DPI_LI_1600UTC_21May2015.png)
![Suomi NPP VIIRS 11.45 µm infrared imagery and NUCAPS Sounding Points (in green), ~1730 and ~1900 UTC 21 May 2015 [click to enlarge]](https://cimss.ssec.wisc.edu/satellite-blog/wp-content/uploads/sites/5/2015/05/SNPP_11.45_NCUAPS_1700_1840UTC_21May2015toggle.gif)
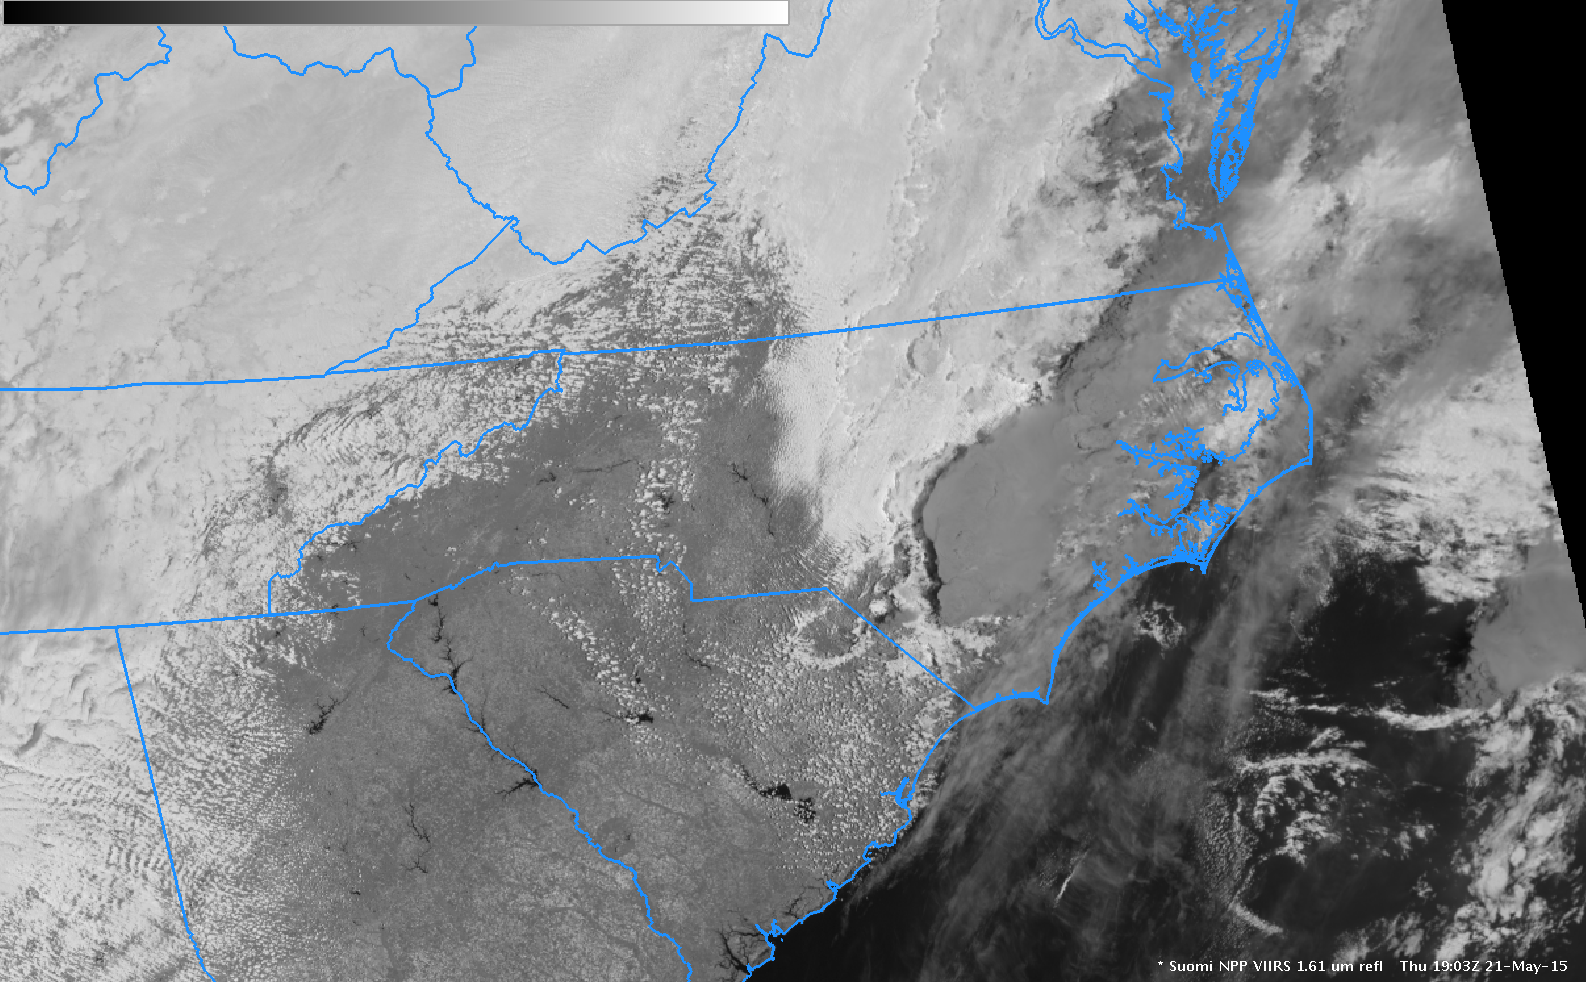
![Suomi NPP VIIRS 0.64 µm visible imagery and 1.61 µm near-infrared imagery 1903 UTC 21 May 2015 [click to enlarge]](https://cimss.ssec.wisc.edu/satellite-blog/wp-content/uploads/sites/5/2015/05/SNPP_1.61_0.64_1900UTC_21May2015toggle.gif)
![GOES-14 0.62 µm visible imagery; Andrews County is highlighted [click to play animation]](https://cimss.ssec.wisc.edu/satellite-blog/wp-content/uploads/sites/5/2015/05/GOES14_TX_20MAY2015anim_WestTX.gif)
![GOES-15 (left), GOES-14 (center), and GOES-13 (right) 0.62 µm visible channel images [click to play animation]](https://cimss.ssec.wisc.edu/satellite-blog/wp-content/uploads/sites/5/2015/05/150519_goes15_goes14_goes13_visible_Texas_severe_thunderstorms_anim.gif)
