![Meteosat-10 Infrared (10.8 µm) images [click to play animation]](https://cimss.ssec.wisc.edu/satellite-blog/wp-content/uploads/sites/5/2015/09/150905_meteosat10_ir_Naples_Italy_hail_anim.gif)
Meteosat-10 Infrared (10.8 µm) images [click to play animation]
![Meteosat-10 Infrared (10.8 µm) images [click to play animation]](https://cimss.ssec.wisc.edu/satellite-blog/wp-content/uploads/sites/5/2015/09/150905_meteosat10_ir_Naples_hail_anim.gif)
Meteosat-10 Infrared (10.8 µm) images [click to play animation]
![Meteosat-10 Visible (0.8 µm) images [click to play animation]](https://cimss.ssec.wisc.edu/satellite-blog/wp-content/uploads/sites/5/2015/09/150905_meteosat10_visible_Naples_Italy_hail_anim.gif)
Meteosat-10 Visible (0.8 µm) images [click to play animation]
View only this post Read Less
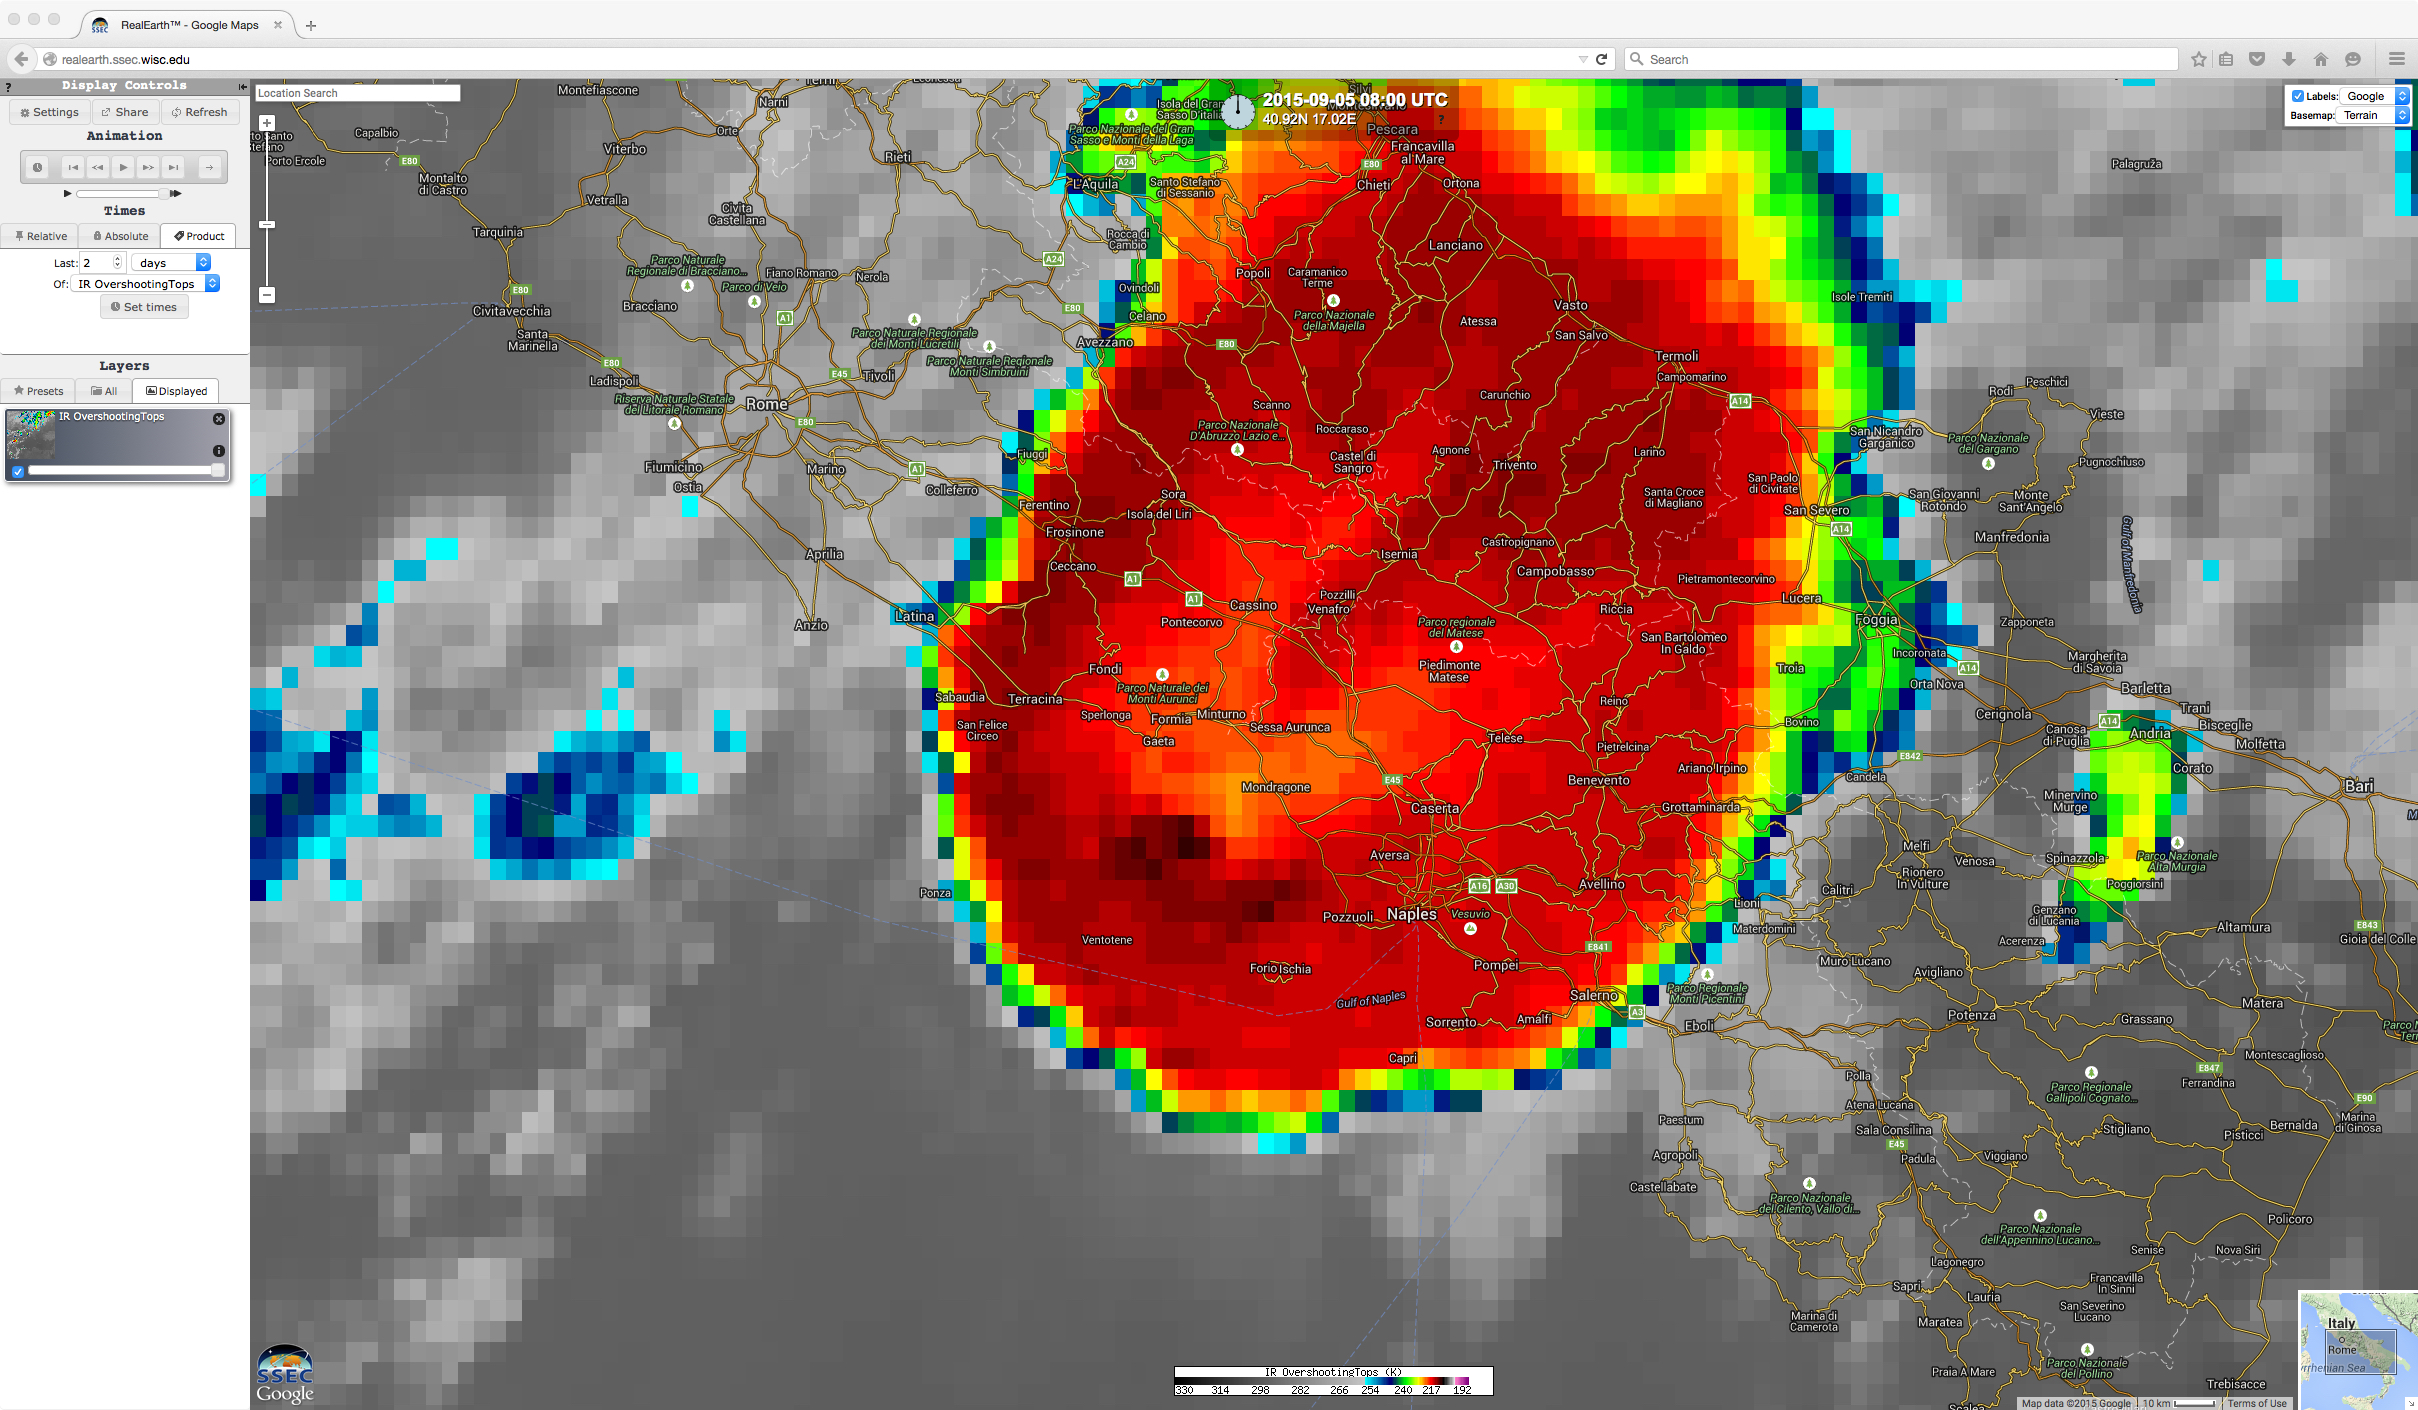
EUMETSAT Meteosat-10 Infrared (10.8 µm) images (above; click image to play animation) showed an isolated supercell thunderstorm which quickly developed over the eastern Mediterranean Sea and moved eastward across central Italy on 05 September 2015. This storm produced large in the Naples area (station identifier LIRN); hail was as large... Read More
Meteosat-10 Infrared (10.8 µm) images [click to play animation]
Meteosat-10 Infrared (10.8 µm) images [click to play animation]
Meteosat-10 Visible (0.8 µm) images [click to play animation]
View only this post Read Less
GOES-13 (GOES-East) Visible (0.63 µm) images (above; click to play animation) revealed the low-level circulation of the remnants of Tropical Storm Erika moving off the coast of Georgia early in the day on 03 September 2015 (15 UTC surface analysis). Although there was one brief convective burst over the low-level circulation center (LLCC), it is unclear whether... Read More
![GOES-13 Visible (0.63 µm) images [click to play animation]](https://cimss.ssec.wisc.edu/satellite-blog/wp-content/uploads/sites/5/2015/09/150903_goes13_visible_Erika_remnants_anim.gif)
GOES-13 Visible (0.63 µm) images [click to play animation]
During the preceding nighttime hours, the remnant LLCC could be seen on a Suomi NPP VIIRS Day/Night Band image at 0631 UTC or 2:31 AM local time (below), still inland over southeastern Georgia.
![Suomi NPP VIIRS Day/Night Band (0.7 µm) and Infrared (11.45 µm) images [click to enlarge]](https://cimss.ssec.wisc.edu/satellite-blog/wp-content/uploads/sites/5/2015/09/150903_0631utc_suomi_npp_viirs_dnb_ir_Erika_remnants_anim.gif)
Suomi NPP VIIRS Day/Night Band (0.7 µm) and Infrared (11.45 µm) images [click to enlarge]
![Terra MODIS Visible (0.64 µm) and Infrared (11.0 µm) images [click to enlarge]](https://cimss.ssec.wisc.edu/satellite-blog/wp-content/uploads/sites/5/2015/09/150903_1550utc_modis_visible_ir_Erika_remnants_anim.gif)
Terra MODIS Visible (0.64 µm) and Infrared (11.0 µm) images [click to enlarge]
![Atmospheric motion vector 850 hPa Relative Vorticity product [click to play animation]](https://cimss.ssec.wisc.edu/satellite-blog/wp-content/uploads/sites/5/2015/09/150825-0903_850mb_reletive_vorticity_TS_Erika_anim.gif)
Atmospheric motion vector 850 hPa Relative Vorticity product [click to play animation]
View only this post Read Less
The YouTube video embedded above shows GOES-13 Water Vapor (6.5 µm) images each hour for all of August 2015. The 10.7 µm Infrared window channel animation is shown below. Both show a remarkable lack of thunderstorm activity in the Caribbean Sea. In addition, hourly Water Vapor (6.5 µm) and... Read More
View only this post Read Less
Tropical Storm Fred reached hurricane intensity east of the Cape Verde Islands late in the day on 30 August 2015. As mentioned in the NHC discussion on the following morning, Fred was the first hurricane to pass through the Cape Verde Islands since 1892. While no central eye was apparent on... Read More
![GOES-13 Visible (0.63 um) and Infrared (10.7 um) images [click to enlarge]](https://cimss.ssec.wisc.edu/satellite-blog/wp-content/uploads/sites/5/2015/08/150831_0845utc_goes13_visible_ir_Hurricane_Fred_anim.gif)
GOES-13 Visible (0.63 um) and Infrared (10.7 um) images [click to enlarge]
![DMSP SSMIS 85 GHz microwave image [click to enlarge]](https://cimss.ssec.wisc.edu/satellite-blog/wp-content/uploads/sites/5/2015/08/150831_0904utc_ssmis_mw_Fred.gif)
DMSP SSMIS 85 GHz microwave image [click to enlarge]
![Meteosat-10 Infrared (10.8 um) images with overlay of Tropical Overshooting Top product [click to enlarge]](https://cimss.ssec.wisc.edu/satellite-blog/wp-content/uploads/sites/5/2015/08/150831_14-17utc_ir_tot_Fred_anim.gif)
Meteosat-10 Infrared (10.8 um) images with overlay of Tropical Overshooting Top product [click to enlarge]
View only this post Read Less
