![GOES-12 10.7 µm IR images [click to play mp4 animation]](https://cimss.ssec.wisc.edu/satellite-blog/wp-content/uploads/sites/5/2015/08/960x1280_AGOES12_B4_KATRINAIR4_2005240_154500.GIF)
GOES-12 10.7 µm IR images [click to play mp4 animation]
![GOES-12 10.7 µm IR images [click to enlarge]](https://cimss.ssec.wisc.edu/satellite-blog/wp-content/uploads/sites/5/2015/08/960x1280_AGOES12_B4_KATRINAIR4_2005240_040200_061500toggle.gif)
GOES-12 10.7 µm IR images [click to enlarge]
Katrina was featured in the CIMSS GOES Gallery back in 2005 (Link).
View only this post Read Less
August 28 2015 is the 10-year anniversary of Hurricane Katrina achieving Category 5 status (on the Saffir-Simpson Scale) in the central Gulf of Mexico. The mp4 animation above (available here as a 490 megabyte animated gif, and on YouTube) shows the evolution of Katrina from a thunderstorm cluster in the Bahamas... Read More
GOES-12 10.7 µm IR images [click to play mp4 animation]
GOES-12 10.7 µm IR images [click to enlarge]
Katrina was featured in the CIMSS GOES Gallery back in 2005 (Link).
View only this post Read Less
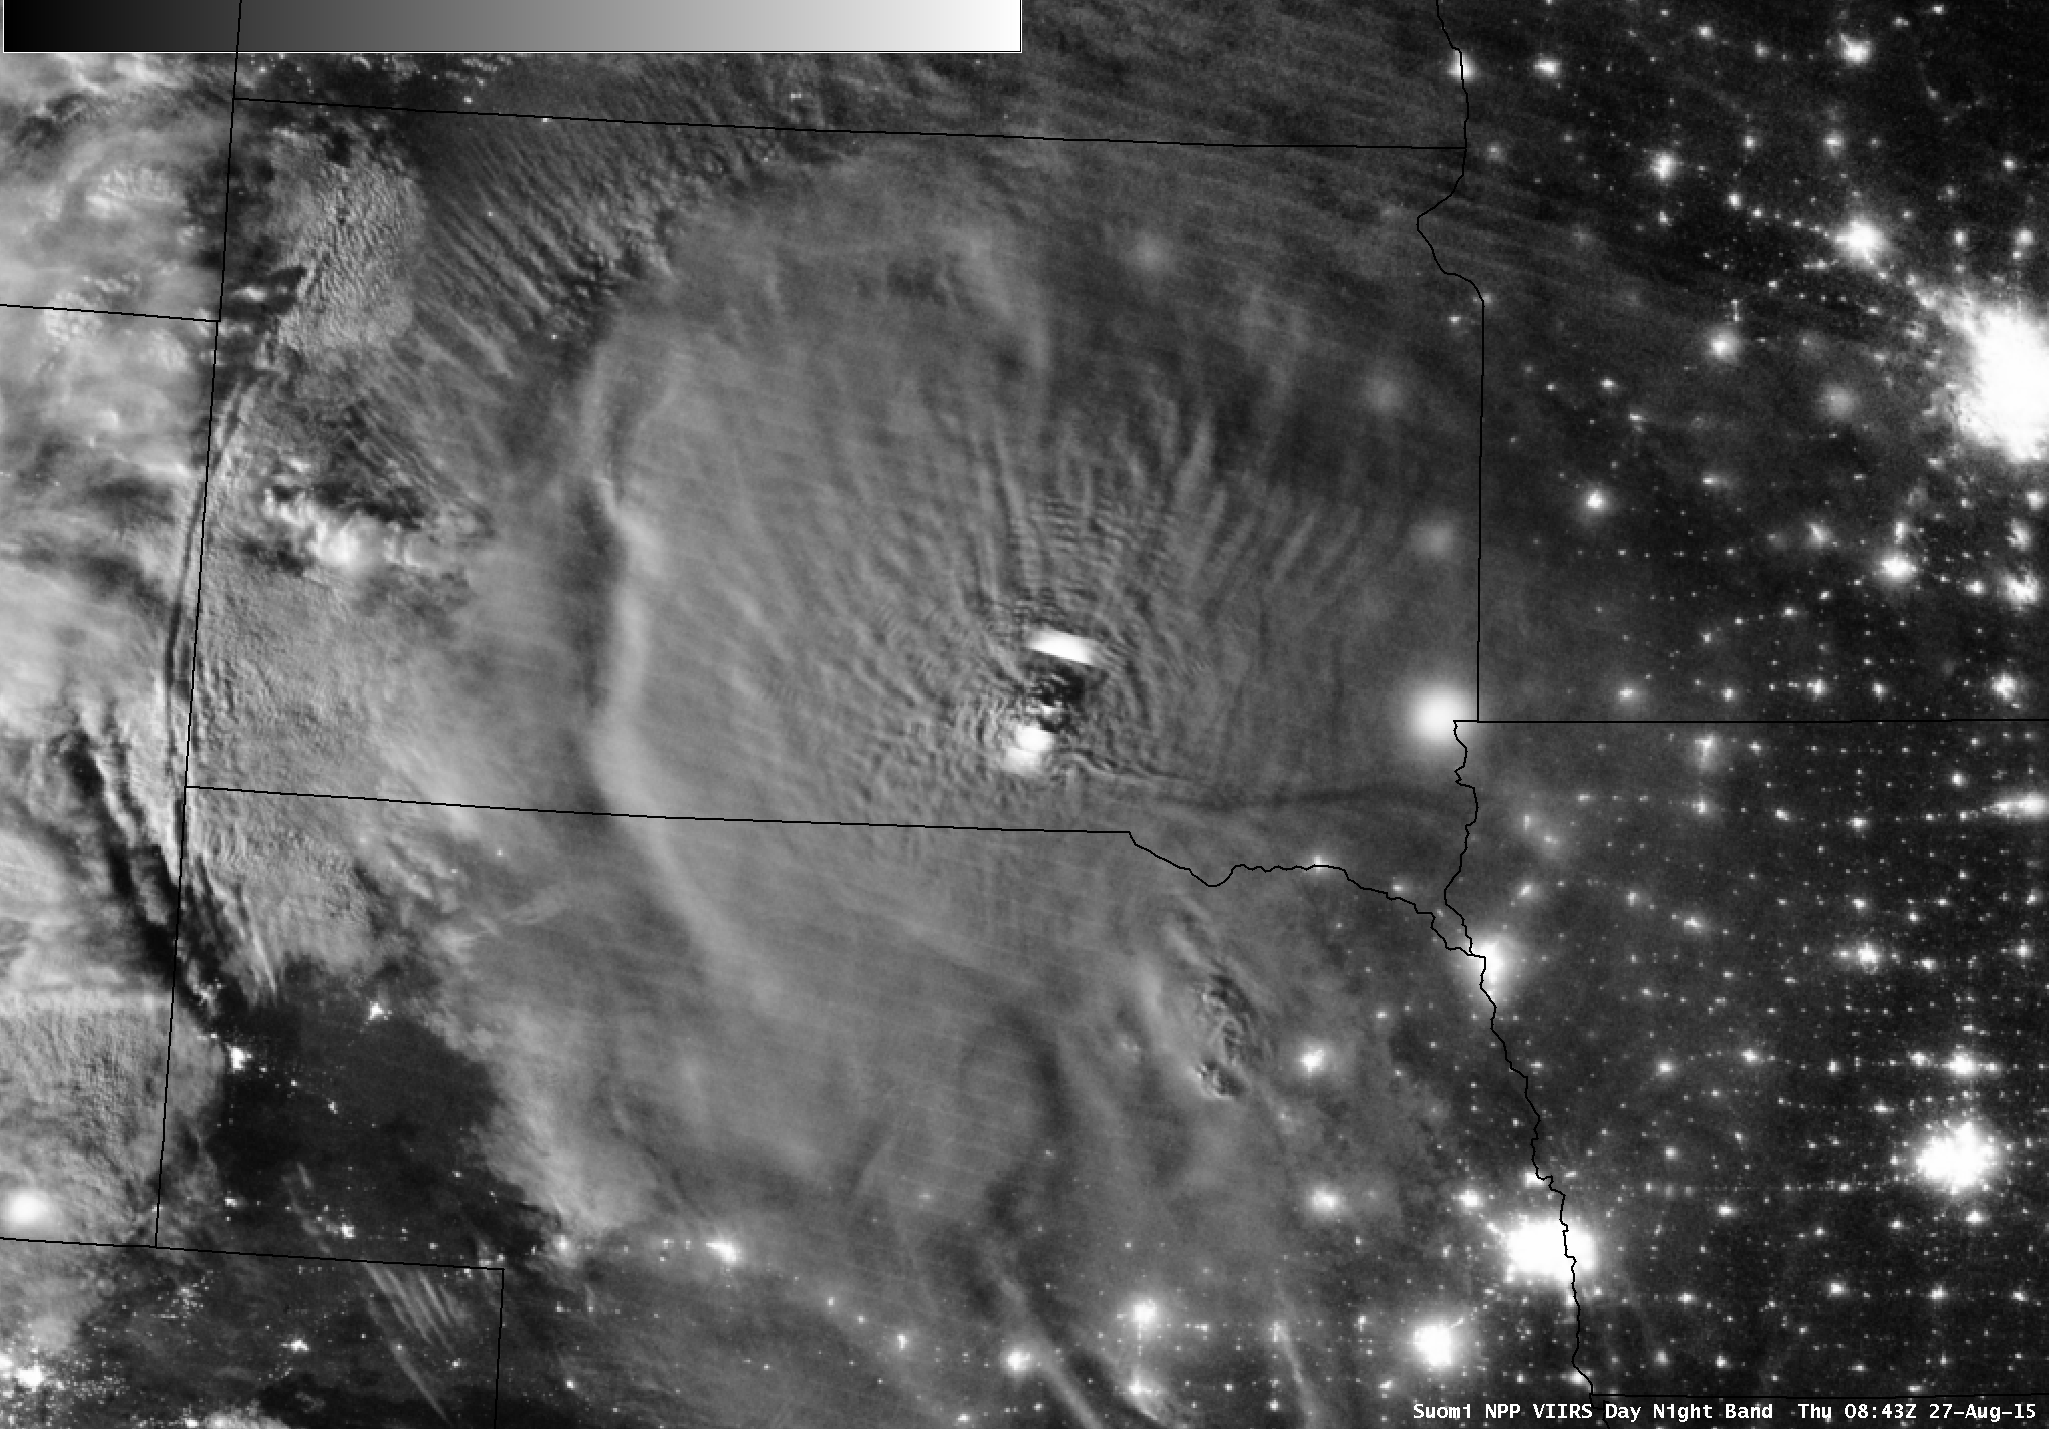
A large Mesoscale Convective System (MCS) developed over western South Dakota late in the day on 26 August 2015, moving eastward across the state and producing wind gusts as high as 79 mph (SPC storm reports). A nighttime comparison of Suomi NPP VIIRS Infrared (11.45 µm) and Day/Night Band (0.7 µm) images... Read More
![Suomi NPP VIIRS Infrared (11.45 µm) and Day/Night Band (0.7 µm) images [click to enlarge]](https://cimss.ssec.wisc.edu/satellite-blog/wp-content/uploads/sites/5/2015/08/150827_0842utc_suomi_npp_viirs_ir_dnb_SD_mcs_anim.gif)
Suomi NPP VIIRS Infrared (11.45 µm) and Day/Night Band (0.7 µm) images [click to enlarge]
Regarding the large arc of waves along the back edge of the MCS, GOES-13 (GOES-East) water vapor (6.5 µm) images (below; click image to play animation) revealed a signal of strong subsidence (warming/drying, darker blue color enhancement) as the westward-expanding cloud mass was acting as an obstacle to the prevailing westerly winds coming from Wyoming and Montana.
![GOES-13 water vapor (6.5 µm) images [click to play animation]](https://cimss.ssec.wisc.edu/satellite-blog/wp-content/uploads/sites/5/2015/08/150827_goes13_water_vapor_SD_mcs_anim.gif)
GOES-13 water vapor (6.5 µm) images [click to play animation]
View only this post Read Less
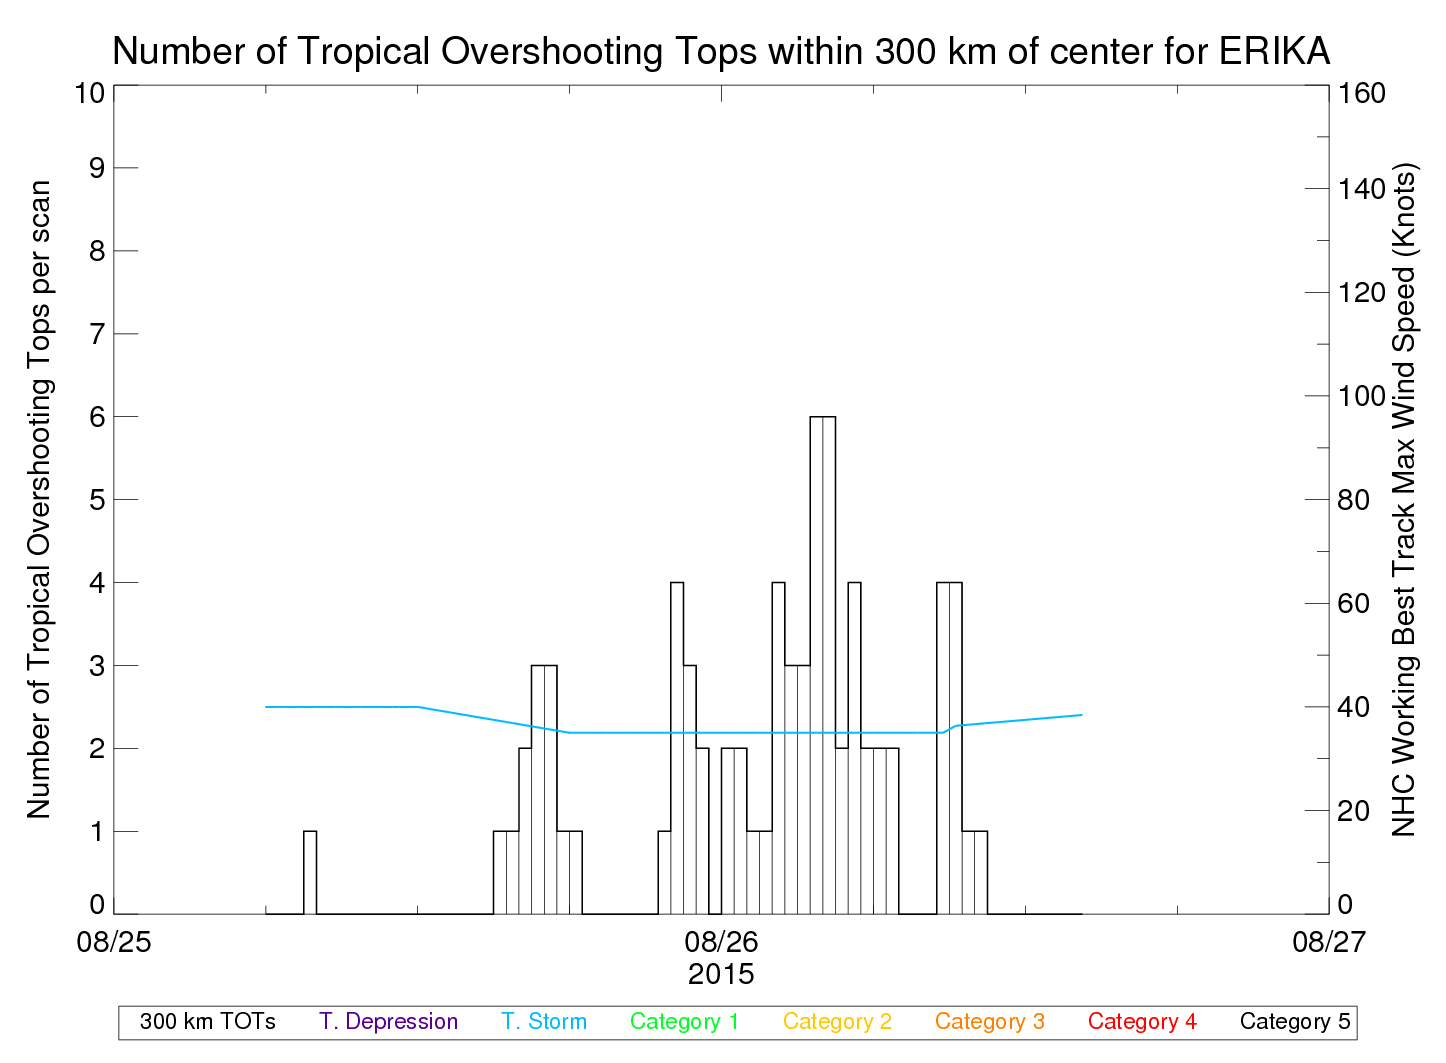
GOES-13 Infrared Imagery (above) for the 24 hours ending 1415 UTC on 26 August 2015 show Tropical Storm Erika approaching the Leeward Islands of the eastern Caribbean. A general increase in convection in the 24 hours shown is obvious. Visible imagery (below) from the morning of 26 August shows some overshooting... Read More
![GOES-13 10.7 µm IR images [click to play animated GIF]](https://cimss.ssec.wisc.edu/satellite-blog/wp-content/uploads/sites/5/2015/08/960x1280_AGOES13_B4_ERIKAIR4_animated_2015237_141500_180_2015238_141500_180_IR4AVHRR4.gif)
GOES-13 10.7 µm IR images [click to play animated GIF]
![GOES-13 Visible Imagery (0.63 µm) [click to play animated GIF]](https://cimss.ssec.wisc.edu/satellite-blog/wp-content/uploads/sites/5/2015/08/GOES13_VIS_26AUG2015_0945_1415anim.gif)
GOES-13 Visible Imagery (0.63 µm) [click to play animated GIF]
![ASCAT Winds and GOES-13 Water Vapor IR (6.5 µm) [click to enlarge]](https://cimss.ssec.wisc.edu/satellite-blog/wp-content/uploads/sites/5/2015/08/ASCAT_0056_26August2015.png)
ASCAT Winds and GOES-13 Water Vapor IR (6.5 µm), ~0100 UTC 26 August 2015 [click to enlarge]
![ASCAT Winds and GOES-13 Water Vapor IR (6.5 µm) [click to enlarge]](https://cimss.ssec.wisc.edu/satellite-blog/wp-content/uploads/sites/5/2015/08/ASCAT_1411_26August2015.png)
ASCAT Winds and GOES-13 Water Vapor IR (6.5 µm), ~1400 UTC 26 August 2015 [click to enlarge]
View only this post Read Less
Typhoon Atsani (which reached Category 5 intensity in the West Pacific Ocean on 19 August 2015) began to transition to a strong post-tropical storm on 25 August. JMA Himawari-8 water vapor (6.2 µm) images (above; click to play MP4 animation) showed the transformation as warm/dry air (yellow to red color enhancement) began... Read More
![Himawari-8 water vapor (6.2 µm) images [click to play MP4 animation]](https://cimss.ssec.wisc.edu/satellite-blog/wp-content/uploads/sites/5/2015/08/960x1280_AH08_B8_ATSANITWO_2015237_090000.GIF)
Himawari-8 water vapor (6.2 µm) images [click to play MP4 animation]
Surface analyses from the Ocean Prediction Center (below; click to play animation) indicated that the post-tropical storm deepened to a minimum central pressure of 957 hPa at 12 UTC on 25 August, and was producing hurricane-force winds until 00 UTC on 26 August.
![West Pacific Ocean surface analyses [click to play animation]](https://cimss.ssec.wisc.edu/satellite-blog/wp-content/uploads/sites/5/2015/08/150824-26_west_Pacific_surface_analyses_anim.gif)
West Pacific Ocean surface analyses [click to play animation]
#Atsani transitions from typhoon into powerful HF post-tropical low
impressive, short video: https://t.co/uMfMPOBh2M pic.twitter.com/InXpkA6B4Y
— NWS OPC (@NWSOPC) August 25, 2015
View only this post Read Less
