On 15 December 2015 NOAA/NESDIS conducted a test of the new GOES-15 (GOES-West) Rapid Scan Operations (RSO) sector for coverage of the American Samoa region (SSD message). GOES-15 Visible (0.63 µm, 1-km resolution) images during the test period between 1711 and 1957 UTC are shown above, with plots of surface observations for... Read More
![GOES-15 Visible (0.63 µm) images [click to play animation]](https://cimss.ssec.wisc.edu/satellite-blog/wp-content/uploads/sites/5/2015/12/151215_G15_VIS_AMERICAN_SAMOA_RSO_TEST_12.GIF)
GOES-15 Visible (0.63 µm) images [click to play animation]
On 15 December 2015 NOAA/NESDIS conducted a test of the new GOES-15
(GOES-West) Rapid Scan Operations (RSO) sector for coverage of the
American Samoa region (
SSD message). GOES-15 Visible
(0.63 µm, 1-km resolution) images during the test period between 1711 and 1957 UTC are shown above, with plots of surface observations for Pago Pago
(station identifier NSTU) and Faleolo
(station identifier NSFA). Note that visible images from the
Full Disk scan at 1800 UTC and
Southern Hemisphere sectors at :22 past each hour are also included in the animation; during routine operations, there are periods when only 1 image per hour is available (from the Southern Hemisphere sector) which covers American Samoa.
The full size of the American Samoa RSO sector is shown below.
![GOES-15 Visible (0.63 µm) image showing the size of the American Samoa RSO sector [click to enlarge]](https://cimss.ssec.wisc.edu/satellite-blog/wp-content/uploads/sites/5/2015/12/151215_G15_VIS_AMERICAN_SAMOA_RSO_TEST_FULL_SECTOR.GIF)
GOES-15 Visible (0.63 µm) image showing the size of the American Samoa RSO sector [click to enlarge]
Displayed below is the American Samoa RSO sector is relation to the typical GOES-West Full Disk scan coverage.
![GOES-15 Visible (0.63 µm) image showing the location of the American Samoa RSO sector in relation to the GOES-15 Full Disk scan coverage [click to enlarge]](https://cimss.ssec.wisc.edu/satellite-blog/wp-content/uploads/sites/5/2015/12/151215_G15_VIS_AMERICAN_SAMOA_RSO_TEST_FULL_SECTOR_FULL_DISK.GIF)
GOES-15 Visible (0.63 µm) image showing the location of the American Samoa RSO sector in relation to the GOES-15 Full Disk scan coverage [click to enlarge]
The American Samoa RSO sector images were also successfully broadcast over the Satellite Broadcast Network (SBN) for display in AWIPS II; a sample GOES-15 Infrared
(10.7 µm, 4-km resolution) image is shown below.
![GOES-15 Infrared (10.7 µm) image, displayed using AWIPS II [click to enlarge]](https://cimss.ssec.wisc.edu/satellite-blog/wp-content/uploads/sites/5/2015/12/151215_1956utc_goes15_11micronIR_awips2.png)
GOES-15 Infrared (10.7 µm) image, displayed using AWIPS II [click to enlarge]
As a preview to the upcoming
GOES-R series of satellites, we can examine
JMA Himawari-8 Visible
(0.64 µm, 0.5 km resolution) images for the same 3-hour time period, as seen below (sun glint over the open water is high during this time of day, due to the sun-satellite geometry of Himiwari-8 positioned at 140º East longitude). The images are available from the
AHI instrument every 10 minutes, and show the development of organized clusters of convection just north and south of the larger islands of Samoa and Apia. Remote locations such as American Samoa will receive similar images every 5 minutes from the
ABI instrument on GOES-R/S/T.
![Himawari-8 Visible (0.64 µm) images [click to play animation]](https://cimss.ssec.wisc.edu/satellite-blog/wp-content/uploads/sites/5/2015/12/960x1280_AHIM08_B3_AMERICAN_SAMOA_VIS_2015349_200000_0001PANEL.GIF)
Himawari-8 Visible (0.64 µm) images [click to play animation]
View only this post
Read Less
![GOES-15 Visible (0.63 µm) images [click to play animation]](https://cimss.ssec.wisc.edu/satellite-blog/wp-content/uploads/sites/5/2015/12/151215_goes15_visible_American_Samoa_RSO_Test_anim.gif)
![Himawari-8 Visible (0.64 µm) images [click to play animation]](https://cimss.ssec.wisc.edu/satellite-blog/wp-content/uploads/sites/5/2015/12/151215_himawari8_visible_American_Samoa_anim.gif)
![GOES-13 Visible (0.63 µm) images [click to play animation]](https://cimss.ssec.wisc.edu/satellite-blog/wp-content/uploads/sites/5/2015/12/900x1600_EASTL_CONUS_B1_GOES13_GRAVWAVES_VIS_animated_2015349_131500_180_2015349_163000_180_GRAY.gif)
![GOES-15 Visible (0.63 µm) images [click to play animation]](https://cimss.ssec.wisc.edu/satellite-blog/wp-content/uploads/sites/5/2015/12/900x1600_WESTL_CONUS_B1_GOES15_GRAVWAVES_VIS_animated_2015349_131500_184_2015349_163000_184_GRAY.gif)
![GOES-13 Visible (0.63 µm) imagery at 1400 UTC; Station Locations are indicated, including the 5 stations with identifiable Wind Gusts associated with the Bore Feature [click to enlarge]](https://cimss.ssec.wisc.edu/satellite-blog/wp-content/uploads/sites/5/2015/12/TexasBoreGustPlot_15December2015.gif)
![Aqua MODIS Water Vapor (6.7 µm) and Infrared (11.0 µm) images [click to enlarge]](https://cimss.ssec.wisc.edu/satellite-blog/wp-content/uploads/sites/5/2015/12/151215_0822utc_modis_water_vapor_ir_TX_undular_bore_anim.gif)
![GOES-15 Water Vapor (6.5 µm) images [click to play animation]](https://cimss.ssec.wisc.edu/satellite-blog/wp-content/uploads/sites/5/2015/12/151212-13_goes15_water_vapor_Bering_Sea_storm_anim.gif)
![Time series of Adak Island, Alaska surface observation [click to enlarge]](https://cimss.ssec.wisc.edu/satellite-blog/wp-content/uploads/sites/5/2015/12/151212-13_PADK_SFCMG.GIF)
![GOES-15 Band 3 Water Vapor (6.5 µm) imagery for 6-8 December 2015 [click to play animation]](https://cimss.ssec.wisc.edu/satellite-blog/wp-content/uploads/sites/5/2015/12/1000x1600_AGOES15_CONUS_B3_DREARY_PACNW_animated_2015340_000000_184_2015342_210000_184_WVSCOTT.gif)
![MIMIC Total Precipitable Water for the 72 hours ending 1700 UTC on 8 December 2015 [click to enlarge]](https://cimss.ssec.wisc.edu/satellite-blog/wp-content/uploads/sites/5/2015/12/MIMIC_TPW_EPAC_latest72hrs_Ending1700_08dec2015.gif)
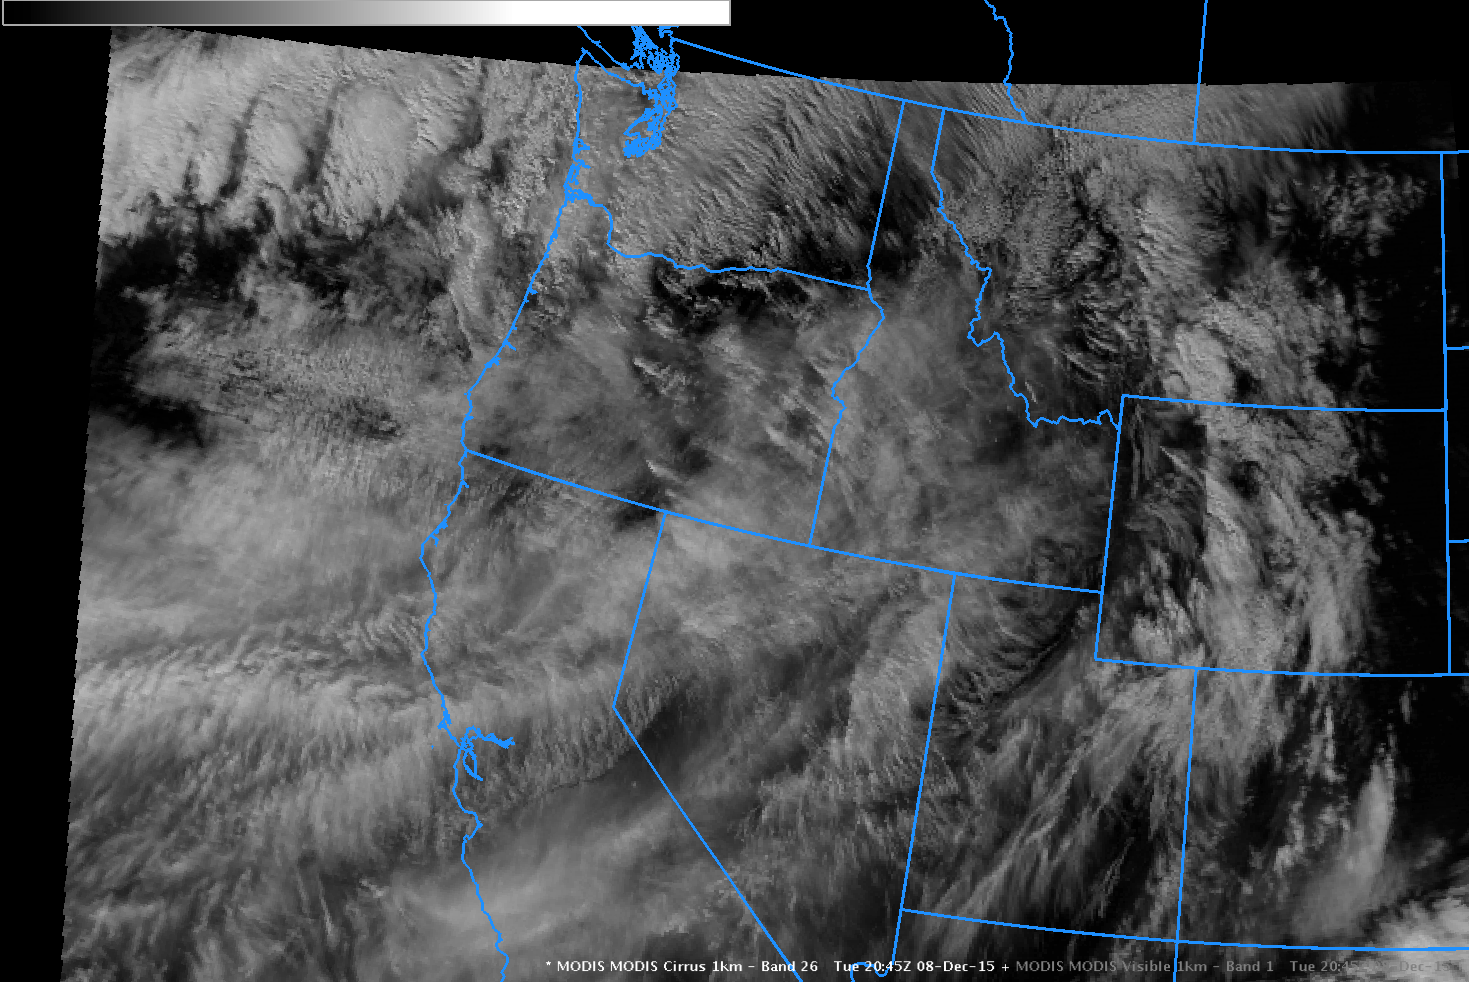
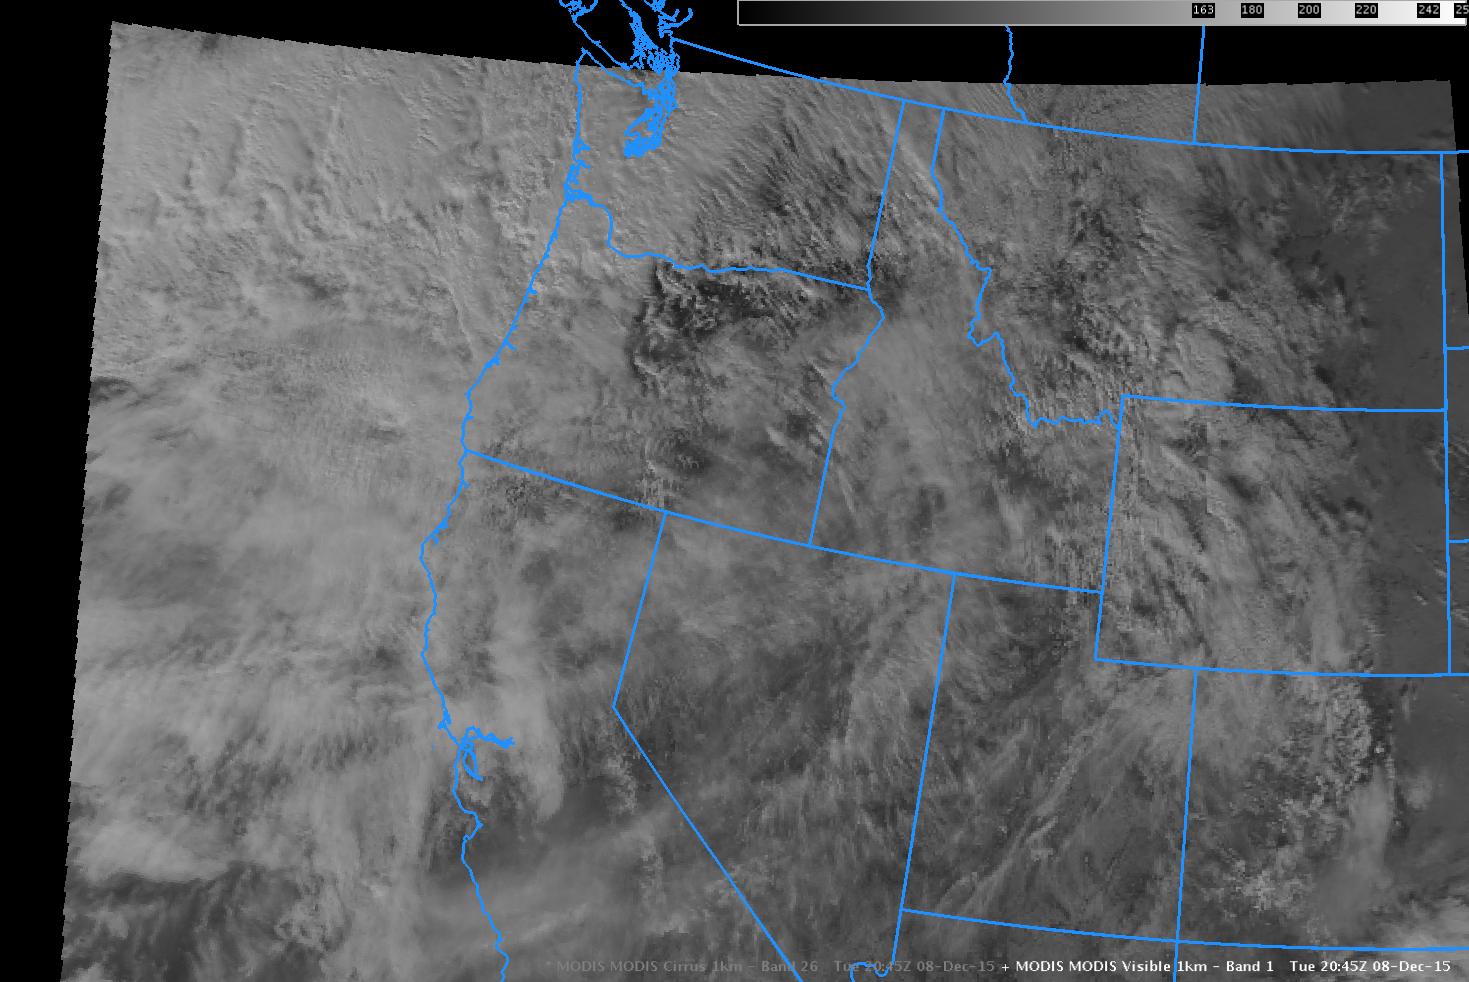
![Aqua MODIS Cirrus Channel (1.38 µm) and Visible Channel (0.64 µm) imagery, 2045 UTC on 8 December 2015 [click to enlarge]](https://cimss.ssec.wisc.edu/satellite-blog/wp-content/uploads/sites/5/2015/12/Aqua_MODIS_VIS_Cirrus_2045UTC_8Dec2015toggle.gif)
