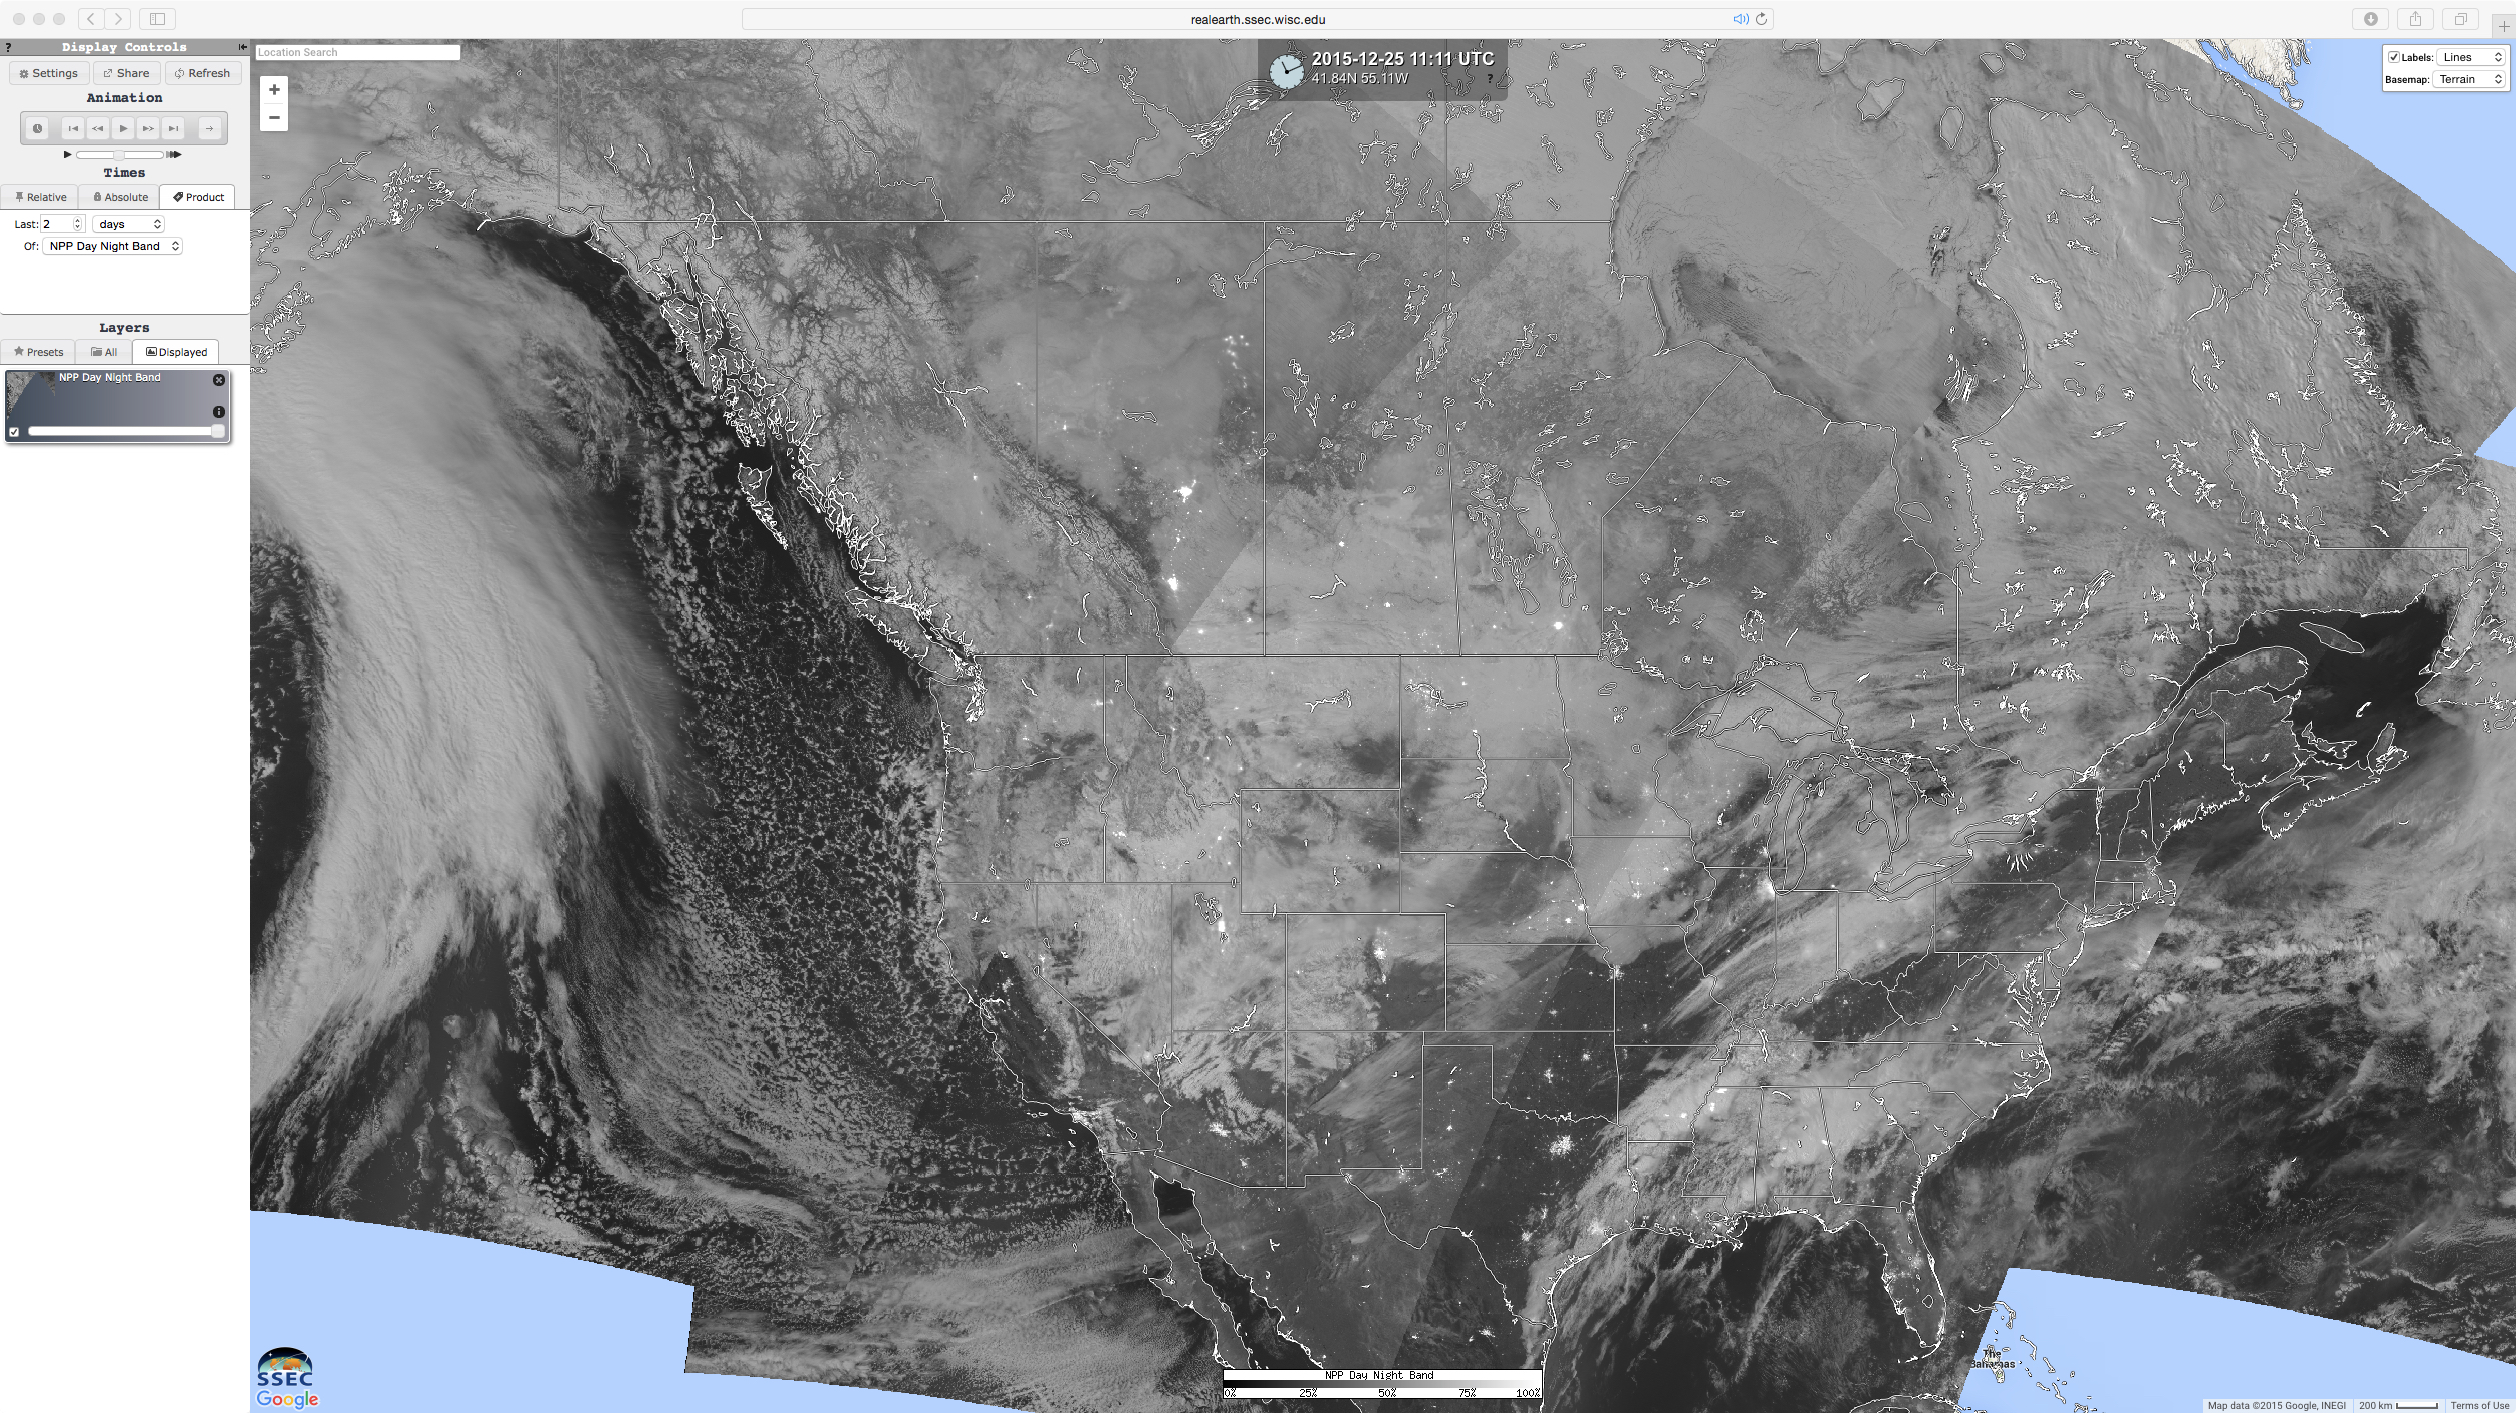
A rare Full Moon on Christmas — the last occurrence was in 1977, and the next will be in 2034 — was reached at 1111 UTC, and provided some compelling “visible images at night” from the Suomi NPP VIIRS 0.7 µm Day/Night Band (DNB). The animation above shows the coverage of... Read More
![Suomi NPP VIIRS Day/Night Band image swaths [click to enlarge]](https://cimss.ssec.wisc.edu/satellite-blog/wp-content/uploads/sites/5/2015/12/151225_suomi_npp_viirs_DNB_swaths_anim.gif)
Suomi NPP VIIRS Day/Night Band image swaths [click to enlarge]
A rare Full Moon on Christmas — the last occurrence was in 1977, and the next will be in 2034 — was reached at 1111 UTC, and provided some compelling “visible images at night” from the
Suomi NPP VIIRS 0.7 µm Day/Night Band (DNB). The animation above shows the coverage of 4 consecutive DNB image swaths across much of North America, as viewed using
RealEarth.
Taking a closer look at various regions and features, we will begin with the Northeast US at 0610 UTC (below). One item of interest was the narrow fingers of valley fog that were forming in parts of Pennsylvania and New York, where strong radiational cooling under cloud-free skies was allowing the surface air temperatures to cool into the 30s and 40s F.
![Suomi NPP VIIRS 0.7 µm Day/Night Band image centered over the Northeast US [click to enlarge]](https://cimss.ssec.wisc.edu/satellite-blog/wp-content/uploads/sites/5/2015/12/151225_0610utc_Suomi_npp_viirs_DNB_Northeast_US_anim.gif)
Suomi NPP VIIRS 0.7 µm Day/Night Band image centered over the Northeast US [click to enlarge]
Over the Southeast US at 0749 UTC
(below), ample illumination by the Full Moon provided a very detailed nighttime view of the tops of numerous thunderstorms that had developed along and ahead of a cold frontal boundary (
surface analysis). Note the appearance of several bright white areas at the tops of some thunderstorms, a signature of cloud illumination by intense lightning activity. In addition, temperatures ahead of the cold front were unusually warm for 25 December — for example, new records for the warmest low temperature for the date were set at both Mobile, Alabama and Pensacola, Florida (with 75º F and 71º F, respectively).
![Suomi NPP VIIRS Day/Night Band image centered over the Southeast US [click to enlarge]](https://cimss.ssec.wisc.edu/satellite-blog/wp-content/uploads/sites/5/2015/12/151225_0749utc_Suomi_npp_viirs_DNB_Southeast_US_anim.gif)
Suomi NPP VIIRS Day/Night Band image centered over the Southeast US [click to enlarge]
Farther to the north, a DNB image centered over South Dakota
(below) showed a great deal of variability in snow cover across that area; the effect of deeper snow cover on surface air temperatures could also be seen in the surface observations at that time, with the colder readings generally coinciding with sites having snow on the ground.
![Suomi NPP VIIRS Day/Night Band image centered over South Dakota [click to enlarge]](https://cimss.ssec.wisc.edu/satellite-blog/wp-content/uploads/sites/5/2015/12/151225_0749utc_Suomi_npp_viirs_DNB_South_Dakota_anim.gif)
Suomi NPP VIIRS Day/Night Band image centered over South Dakota [click to enlarge]
Even farther to the north, it could be seen that ice covered a significant portion of Hudson Bay, Canada
(below). In southern parts of Hudson Bay where open water still existed, numerous “lake effect” cloud bands could be seen due the northwesterly flow of very cold arctic air across the water.
![Suomi NPP VIIRS Day/Night Band image centered over Hudson Bay, Canada [click to enlarge]](https://cimss.ssec.wisc.edu/satellite-blog/wp-content/uploads/sites/5/2015/12/151225_0749utc_Suomi_npp_viirs_DNB_Hudson_Bay_anim.gif)
Suomi NPP VIIRS Day/Night Band image centered over Hudson Bay, Canada [click to enlarge]
A DNB image centered over the Western US at 0930 UTC
(below) revealed features such as snow pack over the higher terrain of the Sierra Nevada in California (where temperatures at the time ranged from 55º F in the desert at Needles KEED to 1º F in the mountains at South Lake Tahoe KTVL), and a variety of open-cell and closed-cell convection over the adjacent offshore waters of the Pacific Ocean.
![Suomi NPP VIIRS Day/Night Band image centered over the western US [click to enlarge]](https://cimss.ssec.wisc.edu/satellite-blog/wp-content/uploads/sites/5/2015/12/151225_0930utc_Suomi_npp_viirs_DNB_Western_US_anim.gif)
Suomi NPP VIIRS Day/Night Band image centered over the western US [click to enlarge]
Finally, a DNB image centered over Alaska and the Yukon Territory of Canada at 1111 UTC
(below) showed widespread snow cover over the cloud-free interior regions, with the thick cloud shield from a Gulf of Alaska storm moving over southwestern and southcentral Alaska. Very cold surface air temperatures at or below -30º F could be seen at a number of sites in the interior areas, with -42º F being reported at the time in Arctic Village, Alaska PARC (their minimum temperature later dropped to -45º F).
![Suomi NPP VIIRS Day/Night Band image centered over Alaska and the Yukon Territory [click to enlarge]](https://cimss.ssec.wisc.edu/satellite-blog/wp-content/uploads/sites/5/2015/12/151225_1111utc_Suomi_npp_viirs_DNB_Alaska_Yukon_anim.gif)
Suomi NPP VIIRS Day/Night Band image centered over Alaska and the Yukon Territory [click to enlarge]
View only this post
Read Less
![GOES-13 Visible Imagery (0.63 µm) and surface reports [click to enlarge]](https://cimss.ssec.wisc.edu/satellite-blog/wp-content/uploads/sites/5/2015/12/RopeCloud_1400_1800UTC_28December2015anim.gif)
![GOES-13 Visible Imagery (0.63 µm), 1300-1430 UTC on 28 December 2015 [click to enlarge]](https://cimss.ssec.wisc.edu/satellite-blog/wp-content/uploads/sites/5/2015/12/GOES13_1300_1430_28DEC2015anim.gif)
![MODIS Visible (0.65 µm) and Infrared (11.0 µm) images [click to enlarge]](https://cimss.ssec.wisc.edu/satellite-blog/wp-content/uploads/sites/5/2015/12/151228_1702utc_modis_visible_ir_Gulf_of_Mexoco_rope_cloud_anim.gif)
![ASCAT Scatterometer Winds, 0248 UTC on 29 December, 2015 [click to enlarge]](https://cimss.ssec.wisc.edu/satellite-blog/wp-content/uploads/sites/5/2015/12/ASCAT_0248UTC_29dece2015.png)
![SPC preliminary storm reports [click map for complete listing]](http://www.spc.noaa.gov/climo/reports/151223_rpts.gif)
![Preliminary tornado damage paths [click to enlarge]](https://cimss.ssec.wisc.edu/satellite-blog/wp-content/uploads/sites/5/2015/12/151223_MS_TN_long_track_tornadoes.jpg)
![GOES-13 Visible (0.63 µm) images [click to play animation]](https://cimss.ssec.wisc.edu/satellite-blog/wp-content/uploads/sites/5/2015/12/151223_goes13_visible_severe_outbreak_anim.gif)
![GOES-13 Infrared (10.7 µm) images [click to play animation]](https://cimss.ssec.wisc.edu/satellite-blog/wp-content/uploads/sites/5/2015/12/151223-24_goes13_ir_severe_outbreak_anim.gif)
![GOES-13 Water Vapor (6.5 µm) images [click to play animation]](https://cimss.ssec.wisc.edu/satellite-blog/wp-content/uploads/sites/5/2015/12/151223-24_goes13_water_vapor_severe_outbreak_anim.gif)
![GOES-13 Visible (0.63 µm) images [click to play animation]](https://cimss.ssec.wisc.edu/satellite-blog/wp-content/uploads/sites/5/2015/12/151221_goes13_visible_solstice_anim.gif)
![GOES-15 Visible (0.63 µm) images [click to play animation]](https://cimss.ssec.wisc.edu/satellite-blog/wp-content/uploads/sites/5/2015/12/151221-22_goes15_visible_solstice_anim.gif)
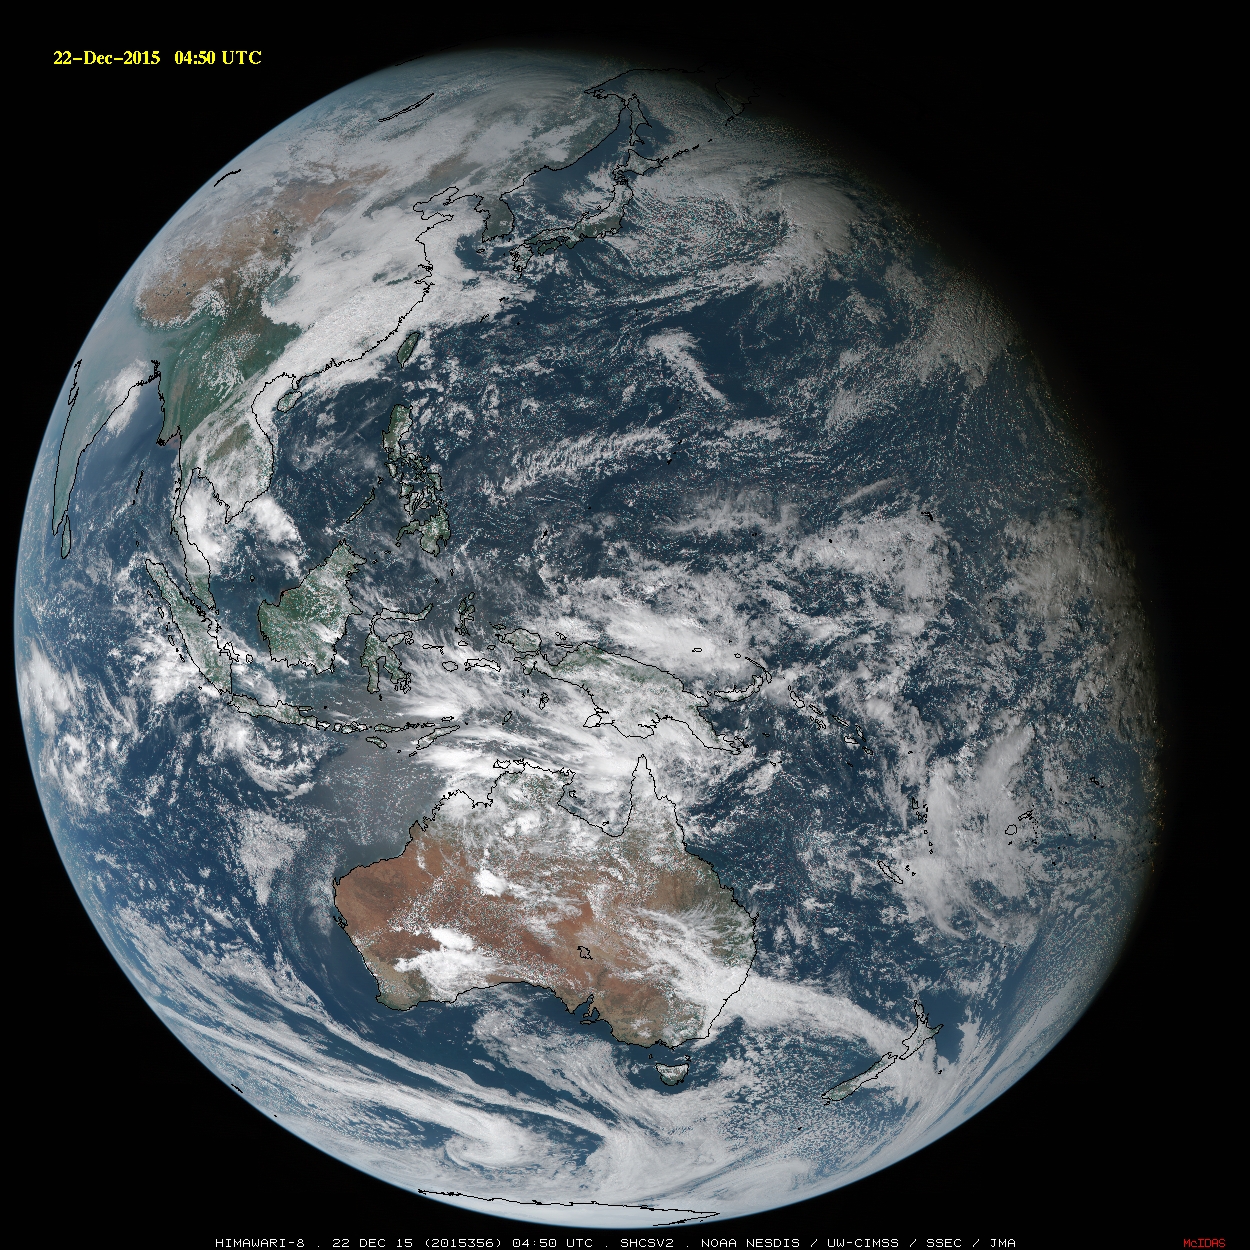
![Himawari-8 true-color images [click to play animation]](https://cimss.ssec.wisc.edu/satellite-blog/wp-content/uploads/sites/5/2015/12/151222_himawari8_fulldisk_rgb_solstice_anim.gif)
