![GOES-15 0.63 um Visible (top) and 3.9 um Shortwave Infrared (bottom) images [click to play animation]](http://pyrocb.ssec.wisc.edu/wp-content/uploads/2016/05/480x1280_AGOES15_B12_GOES15_VIS_IR2_YMMFIRE_03MAY2016_2016124_224500_0002PANELS.GIF)
GOES-15 0.63 µm Visible (top) and 3.9 µm Shortwave Infrared (bottom) images [click to play animation]
GOES-15
(GOES-West) Visible (0.63 µm) and Shortwave Infrared (3.9 µm) images
(above) showed the hot spot
(dark black to yellow to red pixels) and the development of pulses of pyrocumulonimbus (pyroCb) clouds associated with a large wildfire located just to the west of Fort McMurray, Alberta
(station identifier CYMM) on 03 May 2016. The fire — which started on 01 May (
Wikipedia) — caused a mandatory evacuation of the nearly 90,00 residents of the city (the largest fire-related evacuation in Alberta history). Note that the hourly surface plots indicated a temperature of 90º F (32.2º C) at 22-23 UTC — in fact, a new daily record high temperature of 32.6º C was set for Fort McMurray (
time series plot of surface data).
The corresponding GOES-15 Visible (0.63 µm) and Infrared Window (10.7 µm) images (below) revealed cloud-top infrared brightness temperature values as cold as -58º C (darker red color enhancement) at 0030 and 0100 UTC on 04 May.
![GOES-15 0.63 um Visible (top) and 10.7 um Infrared Window (bottom) images [click to play animation]](http://pyrocb.ssec.wisc.edu/wp-content/uploads/2016/05/480x1280_AGOES15_B14_GOES15_VIS_IR4_YMMFIRE_03MAY2016_2016124_224500_0002PANELS.GIF)
GOES-15 0.63 µm Visible (top) and 10.7 µm Infrared Window (bottom) images [click to play animation]
![Suomi NPP VIIRS False-color RGB, Visible (0.64 um), Shortwave Infrared (3.74 um), and Infrared Window (11.45 um) images at 1834 UTC [click to enlarge]](http://pyrocb.ssec.wisc.edu/wp-content/uploads/2016/05/160503_1834utc_suomi_npp_viirs_rgb_visible_swir_ir_Fort_McMurray_Alberta_fire_anim.gif)
Suomi NPP VIIRS False-color RGB, Visible (0.64 µm), Shortwave Infrared (3.74 µm), and Infrared Window (11.45 µm) images at 1834 UTC [click to enlarge]
A comparison of Suomi NPP VIIRS false-color “Snow vs cloud discrimination” Red/Green/Blue (RGB), Visible (0.64 µm), Shortwave Infrared (3.74 µm), and Infrared Window (11.45 µm) images at 1834 UTC
(above) showed that while a large fire hot spot was apparent on the Shortwave Infrared image, there was no clear indication of any pyrocumulus cloud development at that time. However, a similar image comparison at 2018 UTC
(below) revealed that a well-defined pyroCb cloud had formed
(with a cloud-top infrared brightness temperature as cold as -60º C, dark red color enhancement) which was drifting just to the north of the Fort McMurray airport (whose cyan surface report is plotted near the center of the images). A 2104 UTC NOAA-19
AVHRR image provided by René Servranckx showed a minimum IR brightness temperature of -59.6º C.
![Suomi NPP VIIRS false-color RGB, Visible (0.64 um), Shortwave Infrared (3.74 um), and Infrared Window (11.45 um) images at 2018 UTC [click to enlarge]](http://pyrocb.ssec.wisc.edu/wp-content/uploads/2016/05/160503_2018utc_suomi_npp_viirs_rgb_visible_shortwaveIR_longwaveIR_Fort_McMurray_Alberta_fire_anim.gif)
Suomi NPP VIIRS false-color RGB, Visible (0.64 µm), Shortwave Infrared (3.74 µm), and Infrared Window (11.45 µm) images at 2018 UTC [click to enlarge]
A closer look using Suomi NPP VIIRS true-color RGB and Shortwave Infrared (3.74 µm) images from the SSEC
RealEarth site
(below) showed the initial pyroCb cloud as it had drifted just east of Fort McMurray, with the early stages of a second pyroCb cloud just south of the city.
![Suomi NPP VIIRS true-color RGB and Shortwave Infrared (3.74 um) images [click to enlarge]](http://pyrocb.ssec.wisc.edu/wp-content/uploads/2016/05/160503_2016utc_suomi_npp_viirs_truecolor_shortwaveIR_Alberta_fire_anim.gif)
Suomi NPP VIIRS true-color RGB and Shortwave Infrared (3.74 µm) images [click to enlarge]
A nighttime comparison of Suomi NPP VIIRS Day/Night Band (0.7 µm) and Shortwave Infrared (3.74 µm) images at 1015 UTC or 3:15 am local time
(below; courtesy of William Straka, SSEC) showed the bright glow of the large Fort McMurray wildfire, as well as the lights associated with the nearby oil shale mining activity.
![Suomi NPP VIIRS Day/Night Band (0.7 um) and Shortwave Infrared (3.74 um) images at 1014 UTC [click to enlarge]](http://pyrocb.ssec.wisc.edu/wp-content/uploads/2016/05/160504_1015utc_suomi_npp_viirs_Day_Night_Band_Shortwave_Infrared_Fort_McMurray_Alberta_wildfire_anim.gif)
Suomi NPP VIIRS Day/Night Band (0.7 µm) and Shortwave Infrared (3.74 µm) images at 1014 UTC [click to enlarge]
A sequence of Suomi NPP VIIRS Shortwave Infrared (3.74 µm) images covering the 02 April – 04 April period
(below) showed the diurnal changes as well as the overall growth of the fire hot spot
(darker black pixels).
![Suomi NPP VIIRS Shortwave Infrared (3.74 µm) images [click to enlarge]](http://pyrocb.ssec.wisc.edu/wp-content/uploads/2016/05/160502-160504_suomi_npp_viirs_shortwaveIR_Alberta_fire_anim.gif)
Suomi NPP VIIRS Shortwave Infrared (3.74 µm) images [click to enlarge]
===== 05 May Update =====
The GOES-14 satellite was operating in Super Rapid Scan Operations for GOES-R (SRSOR) mode, providing images at 1-minute intervals — and the scan sector was positioned to monitor the Fort McMurray wildfire on 05 May. GOES-14 Visible (0.63 µm) and Shortwave Infrared (3.9 µm) images (below; also available as a large 133 Mbyte animated GIF) showed the growth of the smoke plume and fire hot spot signature (black to yellow to red pixels).
![GOES-14 0.63 µm Visible (top) and 3.9 µm Shortwave Infrared (bottom) images [click to play MP4 animation]](http://pyrocb.ssec.wisc.edu/wp-content/uploads/2016/05/480x1280_GOES14_B12_GOES15_VIS_IR2_YMMFIRE_05MAY2016_2016127_000200_0002PANELS.GIF)
GOES-14 0.63 µm Visible (top) and 3.9 µm Shortwave Infrared (bottom) images [click to play MP4 animation]
A 30-meter resolution Landsat-8 false-color Red/Green/Blue (RGB) image
(below) showed the size of part of the fire burn scar (darker brown) as well as the active fires
(bright pink) along the perimeter of the burn scar.
![Landsat-8 false-color image [click to enlarge]](http://pyrocb.ssec.wisc.edu/wp-content/uploads/2016/05/160505_landsat8_falsecolor_Fort_McMurray_fire.png)
Landsat-8 false-color image [click to enlarge]
===== 06 May Update =====
The Fort McMurray fire continued to produce a great deal of smoke on 06 May, and the coverage and intensity of fire hot spots increased during the afternoon hours as seen on 1-minute GOES-14 Visible (0.63 µm) and Shortwave Infrared (3.9 µm) images (below; also available as a large 180 Mbyte animated GIF).
![GOES-14 0.63 µm (top) and 3.9 µm Shortwave Infrared (bottom) images [click to play MP4 animation]](http://pyrocb.ssec.wisc.edu/wp-content/uploads/2016/05/480x1280_GOES14_B12_GOES15_VIS_IR2_YMMFIRE_06MAY2016_2016127_211100_0002PANELS.GIF)
GOES-14 0.63 µm (top) and 3.9 µm Shortwave Infrared (bottom) images [click to play MP4 animation]
===== 13 May Update =====
![Suomi NPP VIIRS Shortwave Infrared (3.74 µm) and Day/Night Band (0.7 µm) images [click to enlarge]](http://pyrocb.ssec.wisc.edu/wp-content/uploads/2016/05/160513_0906utc_suomi_npp_viirs_ShortwaveIR_Day_Night_Band_Fort_McMurray_fire_anim.gif)
Suomi NPP VIIRS Shortwave Infrared (3.74 µm) and Day/Night Band (0.7 µm) images [click to enlarge]
A comparison of Suomi NPP VIIRS Shortwave Infrared (3.74 µm) and Day/Night Band (0.7 µm) images at 0906 UTC or 3:06 am local time
(above) showed the fire hot spots
(dark gray to yellow to red pixels) and their nighttime glow.
A time series of VIIRS Shortwave Infrared (3.74 µm) images covering the 04-13 May period (below) revealed the rapid early growth of the fire, and the continued slow spread of the fire periphery toward the Alberta/Saskatchewan border. On 13 May the total size of the area burned by the Fort McMurray fire was estimated to be 241,000 hectares or 595,524 acres.
![Time series of Suomi NPP VIIRS Shortwave Infrared (3.74 µm) images, covering the 04-13 May period [click to enlarge]](http://pyrocb.ssec.wisc.edu/wp-content/uploads/2016/05/160504-160513_suomi_npp_viirs_shortwaveIR_Fort_McMurray_fire_anim.gif)
Time series of Suomi NPP VIIRS Shortwave Infrared (3.74 µm) images, covering the 04-13 May period [click to enlarge]
===== 16 May Update =====
![GOES-15 0.63 µm Visible (left) and 3.9 µm shortwave Infrared (right images [click to play animation]](http://pyrocb.ssec.wisc.edu/wp-content/uploads/2016/05/960x640_WESTL_B12_GOES15_VIS_IR2_YMMFIRE_16MAY2016_2016137_194500_0002PANELS.GIF)
GOES-15 0.63 µm Visible (left) and 3.9 µm shortwave Infrared (right images [click to play animation]
Strong southerly winds ahead of an approaching trough axis (
surface analyses) created favorable conditions for rapid fire growth on 16 May — GOES-15 Visible (0.63 µm) and Shortwave Infrared (3.74 µm) images
(above) showed the development of pyrocumulus clouds (first on the far western flank of the fire around 1930 UTC, then later in the eastern portion of the fire area). This new flare-up of fire activity prompted additional evacuations of some oil sands work camps and facilities north of Fort McMurray.
A comparison of Suomi NPP VIIRS Visible (0.64 µm), Shortwave Infrared (3.74 µm) and Infrared Window (11.45 µm) images at 1932 UTC (below) showed that a small pyroCb had developed, which exhibited a cloud-top IR brightness temperature of -41.48 C.
![Suomi NPP VIIRS Visible (0.64 µm), Shortwave Infrared (3.74 µm), and Infrared Window (11.45 µm) images [click to enlarge]](http://pyrocb.ssec.wisc.edu/wp-content/uploads/2016/05/160516_1932utc_viirs_visible_shortwaveIR_longwaveIR_YMM_fire_anim.gif)
Suomi NPP VIIRS Visible (0.64 µm), Shortwave Infrared (3.74 µm), and Infrared Window (11.45 µm) images [click to enlarge]
A toggle between the corresponding VIIRS true-color RGB image and Shortwave Infrared images is shown below.
![Suomi NPP VIIRS true-color RGB and Shortwave Infrared (3.74 µm) images [click to enlarge]](http://pyrocb.ssec.wisc.edu/wp-content/uploads/2016/05/160516_1932utc_viirs_truecolor_shortwaveIR_YMM_fire_anim.gif)
Suomi NPP VIIRS true-color RGB and Shortwave Infrared (3.74 µm) images [click to enlarge]
A time series plot of surface weather conditions for Fort McMurray
(below) shows that during prolonged periods of light winds, the surface visibility dropped below 1 mile at times. The air quality at Fort McMurray was rated as “
extreme“, and deemed unsafe for residents to return to the city.
![Time series of weather conditions at Fort McMurray on 16 May [click to enlarge]](http://pyrocb.ssec.wisc.edu/wp-content/uploads/2016/05/160516_CYMM_SFCMG.GIF)
Time series of weather conditions at Fort McMurray on 16 May [click to enlarge]
===== 17 May Update =====
![GOES-15 0.63 µm Visible (left) and 3.9 µm Shortwave Infrared (right) images [click to play animation]](http://pyrocb.ssec.wisc.edu/wp-content/uploads/2016/05/960x640_WESTL_B12_GOES15_VIS_IR2_YMMFIRE_17MAY2016_2016138_194500_0002PANELS.GIF)
GOES-15 0.63 µm Visible (left) and 3.9 µm Shortwave Infrared (right) images [click to play animation]
A shift to westerly winds followed the passage of a surface trough axis on 17 May (
surface analyses), which slowed the northward progress of the fire. GOES-15 Visible (0.63 µm) and Shortwave Infrared (3.9 µm) images
(above; also available as an MP4 animation) continued to show a great deal of thick smoke over the region, with hot spots from active fires.
However, during the afternoon hours multiple pyroCb clouds were seen to develop along the eastern flank of the fire. A comparison of Suomi NPP VIIRS Visible (0.64 µm), Shortwave Infrared (3.74 µm) and Infrared Window (11.45 µm) images at 2054 UTC (below) revealed the pyroCb clouds, which exhibited cloud-top IR Window brightness temperatures as cold as -57º C (darker orange color enhancement).
![Suomi NPP VIIRS Visible (0.64 µm), Shortwave Infrared (3.74 m) and Infrared Window (11.45 ) images [click to enlarge]](http://pyrocb.ssec.wisc.edu/wp-content/uploads/2016/05/160517_2054utc_suomi_npp_viirs_Visible_shortwaveIR_IR_YMM_fire_anim.gif)
Suomi NPP VIIRS Visible (0.64 µm), Shortwave Infrared (3.74 m) and Infrared Window (11.45 ) images [click to enlarge]
A comparison of GOES-15 Shortwave Infrared (3.9 µm) and Infrared Window (10.7 µm) images
(below; also available as an MP4 animation) showed the development of the pyroCb clouds around 2000 UTC, whose anvil debris moved rapidly southeastward; these pyroCb clouds exhibited a darker gray appearance on the shortwave IR images, along with cloud-top IR Window brightness temperatures as cold as -52º C
(light orange color enhancement).
Lightning strikes were detected during the early stages of pyroCb growth.
![GOES-15 3.9 µm Shortwave Infrared (left) and 10.7 µm Infrared Window (right) images [click to play animation]](http://pyrocb.ssec.wisc.edu/wp-content/uploads/2016/05/960x640_WESTL_B24_GOES15_IR2_IR4_YMMFIRE_17MAY2016_2016138_221500_0002PANELS.GIF)
GOES-15 3.9 µm Shortwave Infrared (left) and 10.7 µm Infrared Window (right) images [click to play animation]
===== 18 May Update =====
![Suomi NPP VIIRS Shortwave Infrared (3.74 µm) images covering the 04-18 May 2016 period [click to enlarge]](http://pyrocb.ssec.wisc.edu/wp-content/uploads/2016/05/160504-160518_suomi_npp_viirs_shortwaveIR_Fort_McMurray_fire_anim.gif)
Suomi NPP VIIRS Shortwave Infrared (3.74 µm) images covering the 04-18 May 2016 period [click to enlarge]
Daily Suomi NPP VIIRS Shortwave Infrared (3.74 µm) images covering the period 04 May to 18 May 2016 are shown above. The rapid growth of the perimeter of fire hot spots
(yellow to red color enhancement) is quite evident during the first few days; patches of thick cloud cover tended to mask the fire hot spots during the middle of the period, but then another increase in hot spot growth is seen beginning on 16 May.
This event is also discussed here.
View only this post
Read Less
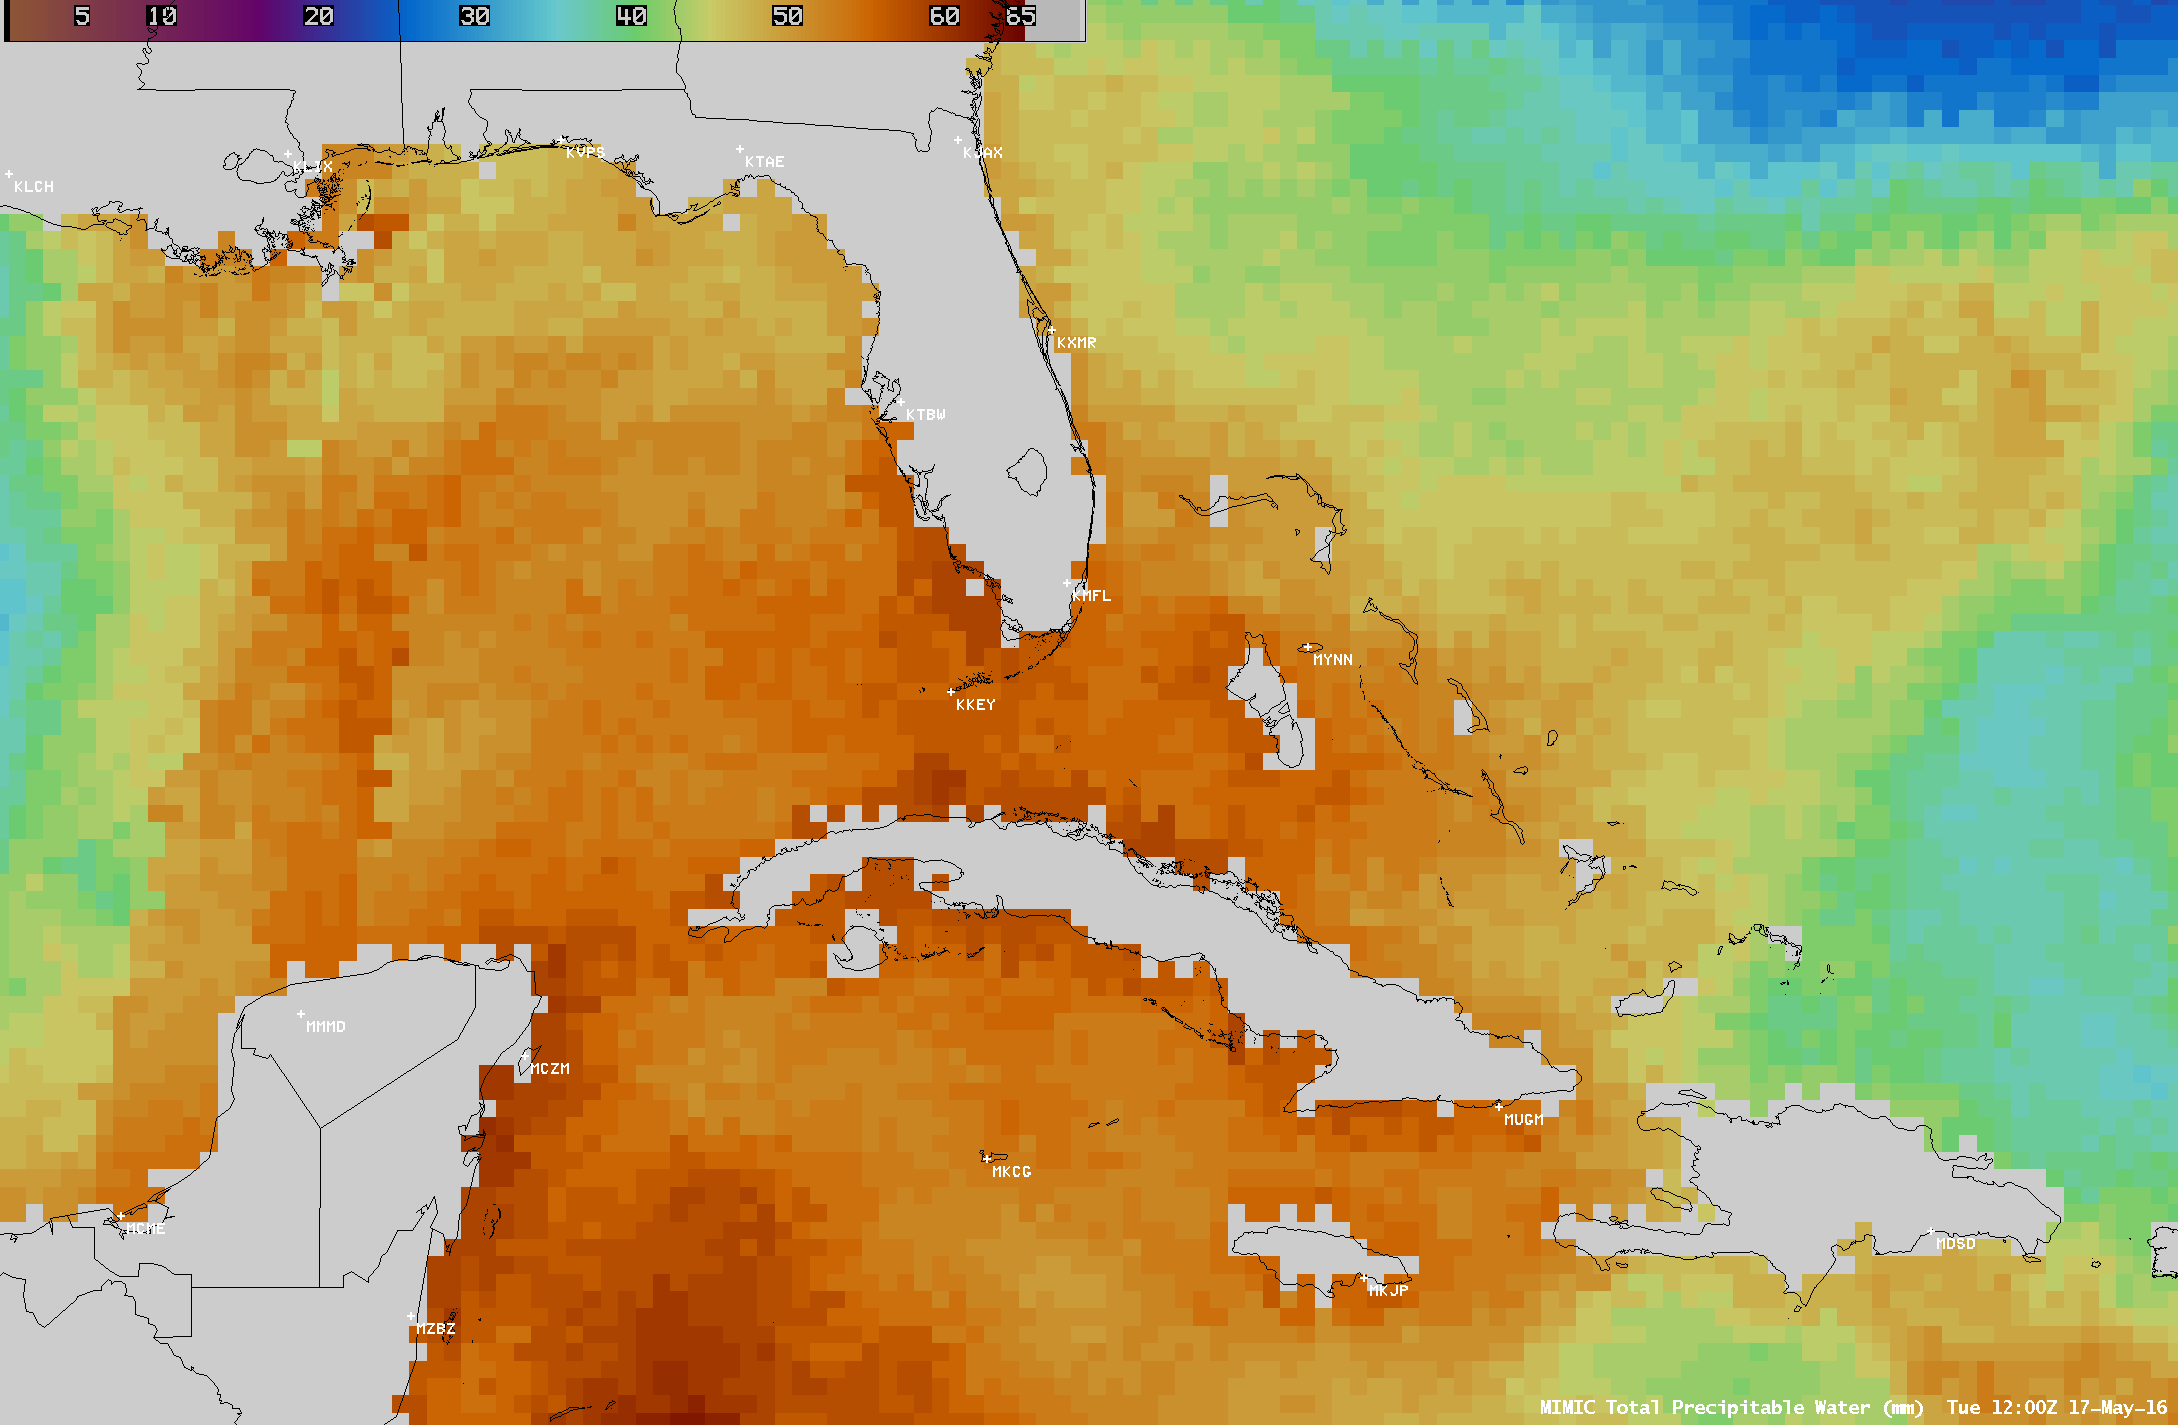
![MIMIC Total Precpitable Water product [click to play animation]](https://cimss.ssec.wisc.edu/satellite-blog/wp-content/uploads/sites/5/2016/05/160516-17_mimic_tpw_anim.gif)
![00 UTC and 12 UTC Miami rawinsonde data [click to enlarge]](https://cimss.ssec.wisc.edu/satellite-blog/wp-content/uploads/sites/5/2016/05/160517_kmfl_raobs_anim.gif)
![GOES-13 Infrared Window (10.7 µm) images [click to play animation]](https://cimss.ssec.wisc.edu/satellite-blog/wp-content/uploads/sites/5/2016/05/160517_goes13_ir_GOM_mcs_anim.gif)
![Terra MODIS Visible (0.65 µm) and Infrared Window (11.0 µm) images [click to enlarge]](https://cimss.ssec.wisc.edu/satellite-blog/wp-content/uploads/sites/5/2016/05/160517_1632utc_terra_modis_visible_infrared_Gulf_of_Mexico_mcs_anim.gif)
![GOES-14 Infrared Window (10.7 µm) images, with parallax-corrected SPC storm reports [click to play animation]](https://cimss.ssec.wisc.edu/satellite-blog/wp-content/uploads/sites/5/2016/05/160511_goes14_infrared_NE_anim.gif)
![GOES-14 Visible (0.63 µm) images, with parallax-corrected SPC storm reports [click to play MP4 animation]](https://cimss.ssec.wisc.edu/satellite-blog/wp-content/uploads/sites/5/2016/05/960x1280_GOES14_B1_GOES14_VIS_MO_IL_11MAY2016_2016132_214600_0001PANEL.GIF)
![GOES-13 visible (0.63 µm) images, with parallax-corrected SPC storm reports [click to play animation]](https://cimss.ssec.wisc.edu/satellite-blog/wp-content/uploads/sites/5/2016/05/160511_goes13_visible_spc_storm_reports_STL_anim.gif)
![GOES-14 Visible (0.63 µm) images, with parallax-corrected SPC storm reports [click to play MP4 animation]](https://cimss.ssec.wisc.edu/satellite-blog/wp-content/uploads/sites/5/2016/05/960x1280_GOES14_B1_GOES14_VIS_TX_11MAY2016_2016132_234900_0001PANEL.GIF)
![GOES-14 Visible (0.63 um) images, with SPC storm reports [click to play MP4 animation]](https://cimss.ssec.wisc.edu/satellite-blog/wp-content/uploads/sites/5/2016/05/960x1280_AGOES14_B1_GOES14_VIS_NE_KS_09MAY2016_2016130_223300_0001PANEL.GIF)
![GOES-14 Visible (0.63 um) images, with SPC storm reports [click to play MP4 animation]](https://cimss.ssec.wisc.edu/satellite-blog/wp-content/uploads/sites/5/2016/05/960x1280_AGOES14_B1_GOES14_VIS_KS_OK_09MAY2016_2016130_213300_0001PANEL.GIF)
![GOES-15 0.63 um Visible (top) and 3.9 um Shortwave Infrared (bottom) images [click to play animation]](http://pyrocb.ssec.wisc.edu/wp-content/uploads/2016/05/160502_goes15_visible_shortwaveIR_CYMM_Fire_anim.gif)
![GOES-15 0.63 um Visible (top) and 10.7 um Infrared Window (bottom) images [click to play animation]](http://pyrocb.ssec.wisc.edu/wp-content/uploads/2016/05/160502_goes15_visible_infrared_CYMM_Fire_anim.gif)
![GOES-15 0.63 µm Visible (left) and 3.9 µm shortwave Infrared (right images [click to play animation]](http://pyrocb.ssec.wisc.edu/wp-content/uploads/2016/05/160516_goes15_visible_shortwaveIR_YMM_fire_anim.gif)
![GOES-15 0.63 µm Visible (left) and 3.9 µm Shortwave Infrared (right) images [click to play animation]](http://pyrocb.ssec.wisc.edu/wp-content/uploads/2016/05/160517_goes15_visible_shortwaveIR_YMM_fire_anim.gif)
![GOES-15 3.9 µm Shortwave Infrared (left) and 10.7 µm Infrared Window (right) images [click to play animation]](http://pyrocb.ssec.wisc.edu/wp-content/uploads/2016/05/160517_goes15_shortwaveIR_longwaveIR_YMM_fire_anim.gif)
