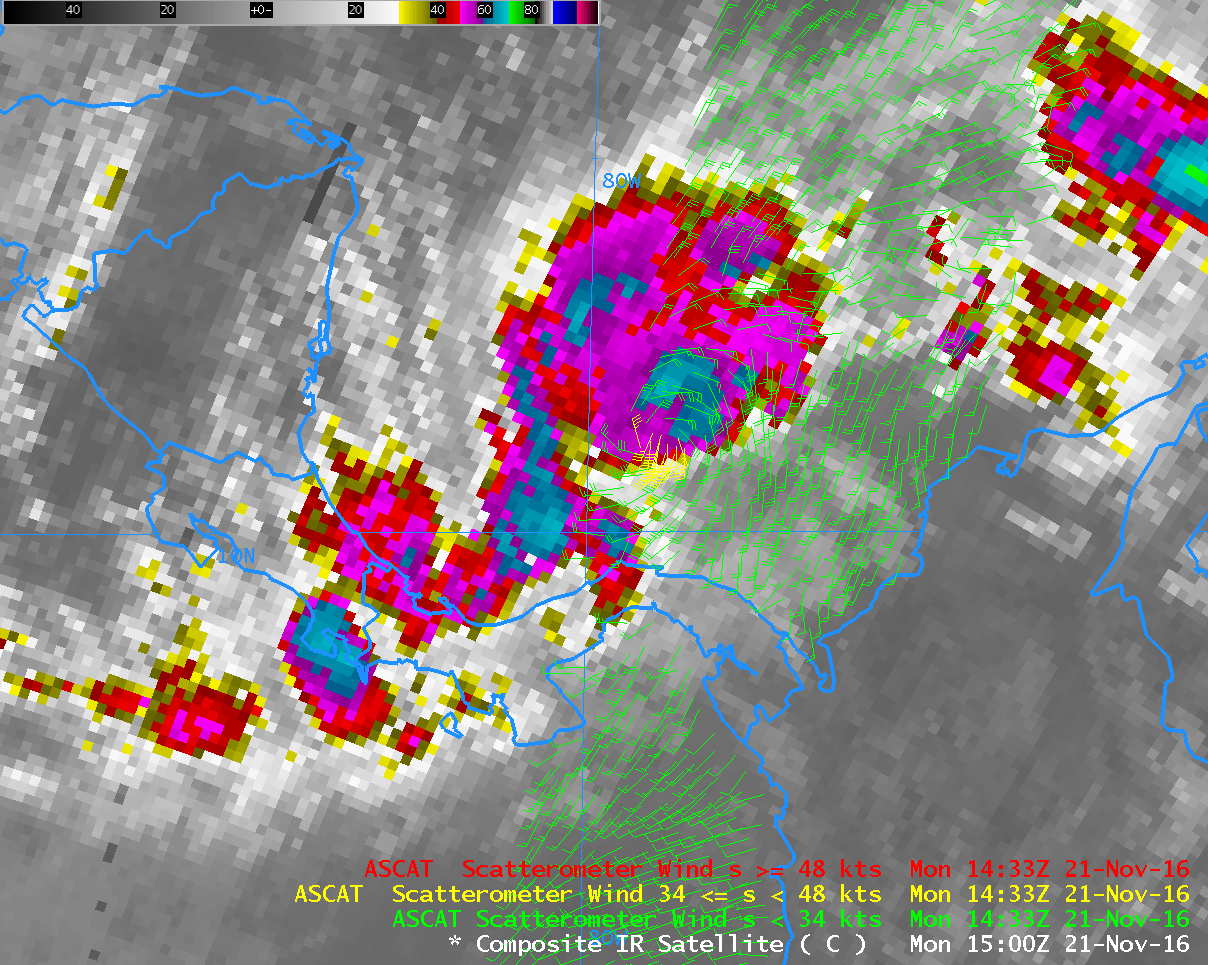
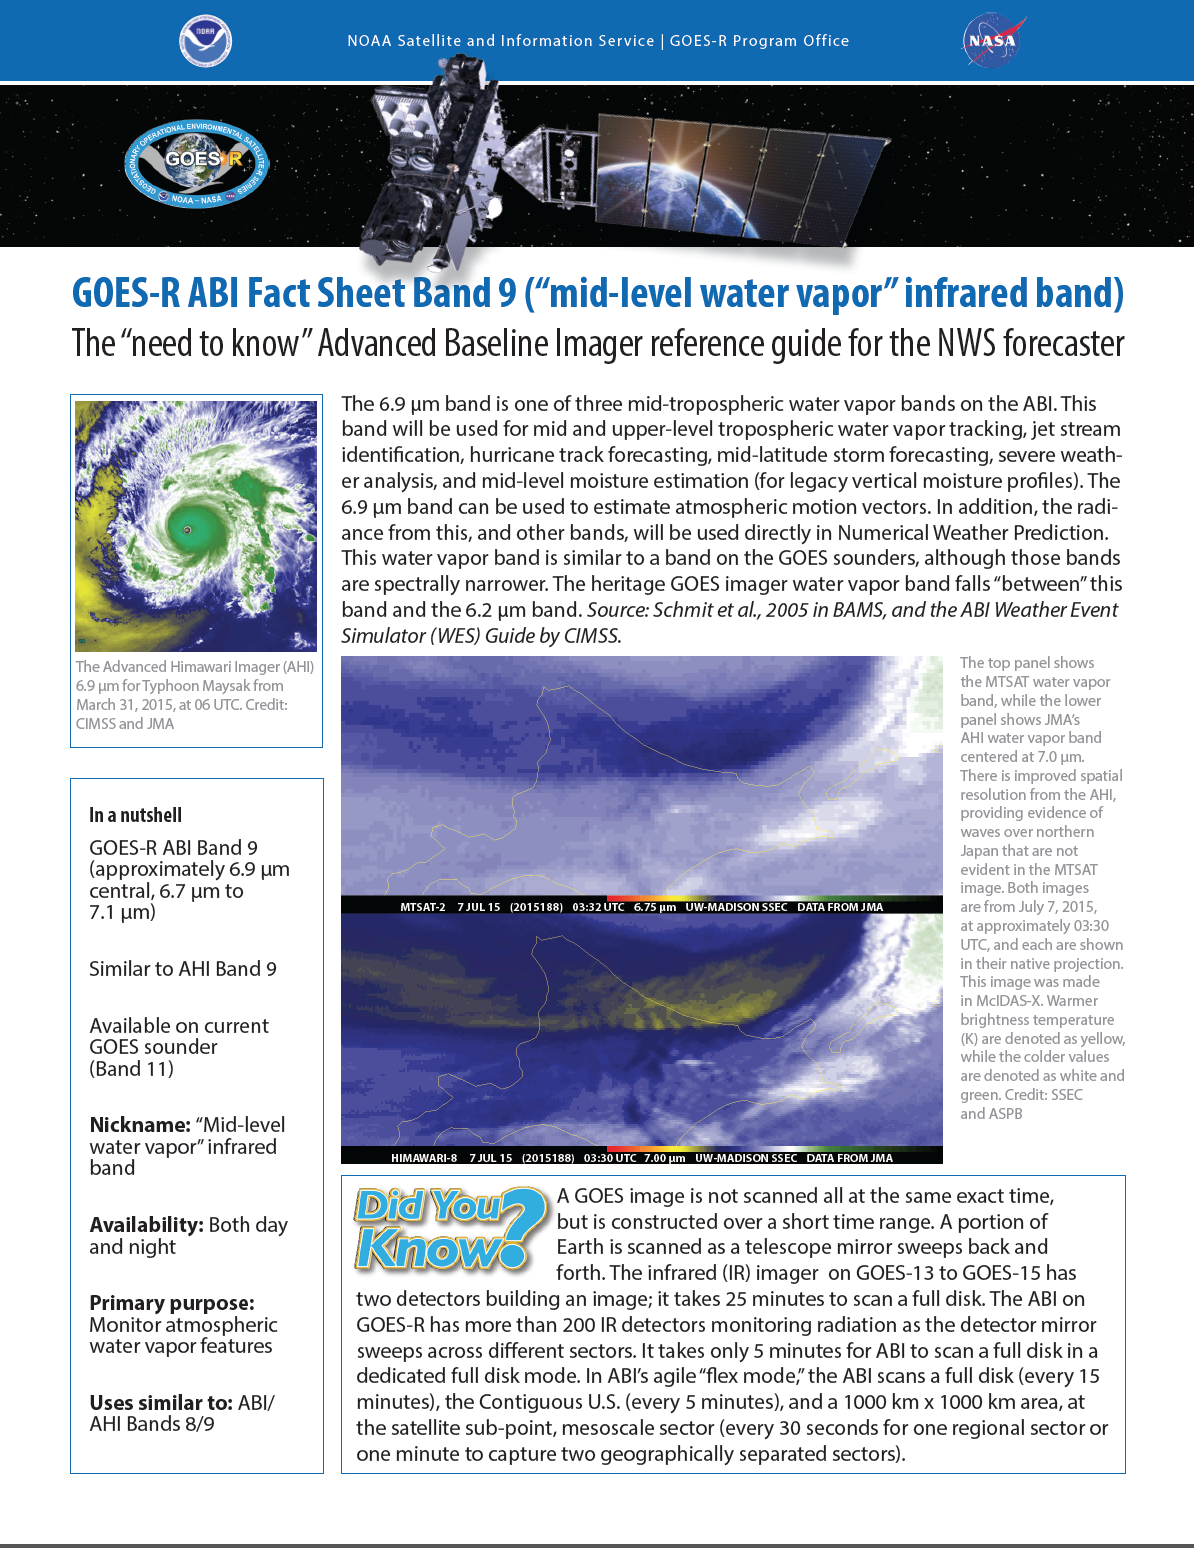
Metop-A Scatterometer winds at 1430 UTC and GOES-13 10.7 µm Brightness Temperature (Click to enlarge)
A late-season tropical depression has formed in the southwestern Caribbean Sea. The morning Metop-A pass on 21 November 2016 allowed ASCAT scatterometer winds to be sampled over the system: rain-flagged values near tropical storm force were present as shown above. A similar image (from this site) is available here, and also here (from this site).
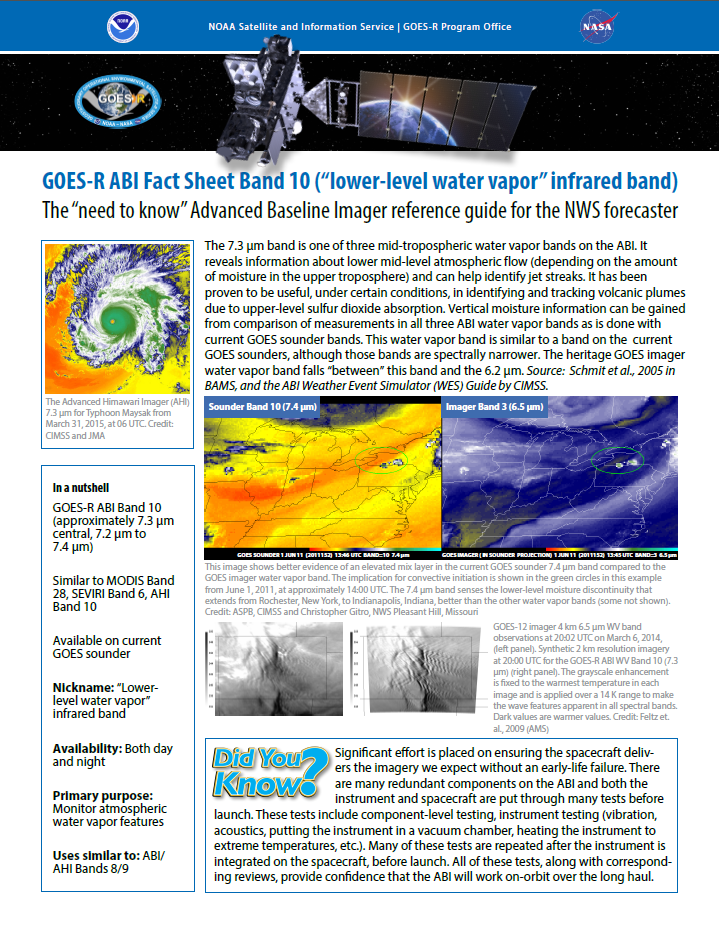
GOES-13 Infrared (10.7 µm) Brightness Temperatures (Click to animate)
Infrared (10.7 µm) imagery from GOES-13, above, from 1315 through 1715 UTC on 21 November, shows periodic deep convection over the Depression; the grey regions in the deepest convection over the system correspond to brightness temperatures colder than -75 C. The environment surrounding this system, shown below, is marginally favorable for strengthening; sea-surface temperatures are warm, although the oceanic heat content suggests the warmth does not extend through a deep column of water. Wind shear over the storm is modest (but far stronger north of the storm). (Imagery below is from this site). The system is forecast to become a tropical storm within the next 24 hours.
Sea-surface temperatures, Oceanic Heat Content and Wind Shear (Click to enlarge)
Update: Otto was named a tropical storm at 2100 UTC 21 November; GOES-13 Visible (0.63 µm) Imagery is shown below. Numerous tropical overshooting tops can be seen during the course of the day.

GOES-13 Visible (0.63 µm) Imagery on 21 November 2016 (Click to animate)
MIMIC Total Precipitable Water fields, below, show that Otto emerged from a region of persistent deep moisture over the southwestern Caribbean Sea that has been contracting as the storm formed. This region of moisture was focused along the intersection of a stalled and decaying Atlantic frontal zone and the Pacific monsoon trough (hourly animation).
MIMIC Total Precipitable Water fields at 2100 UTC on 17,18,19,20 and 21 November (Click to enlarge)
DMSP-16 Microwave (85 GHz) imagery, below, showed evidence of a closed eye associated with Otto at 2132 UTC.
![DMSP-16 SSMIS Microwave (85 GHz) image [click to enlarge]](https://cimss.ssec.wisc.edu/satellite-blog/wp-content/uploads/sites/5/2016/11/161121_2132utc_dmsp16_ssmis_TS_Otto.png)
DMSP-16 SSMIS Microwave (85 GHz) image [click to enlarge]
View only this post Read Less
![GOES-15 Water Vapor (6.5 µm) images, with hourly surface and buoy/ship reports [click to play MP4 animation]](https://cimss.ssec.wisc.edu/satellite-blog/wp-content/uploads/sites/5/2016/11/960x1280_AGOES15_B3_GOES15_WV_G_OF_AK_15-17NOV2016_2016320_200000_0001PANEL.GIF)
![JMA Hmawari-8 Water Vapor (6.2 µm, top; 6.9 µm, middle; 7.3 µm, bottom) images [click to play MP4 animation]](https://cimss.ssec.wisc.edu/satellite-blog/wp-content/uploads/sites/5/2016/11/320x1280_AHIM08_B8910_HIM08_WV_3PANEL_N_PACIFIC_HF_LOW_15NOV2016_2016320_235000_0003PANELS.GIF)
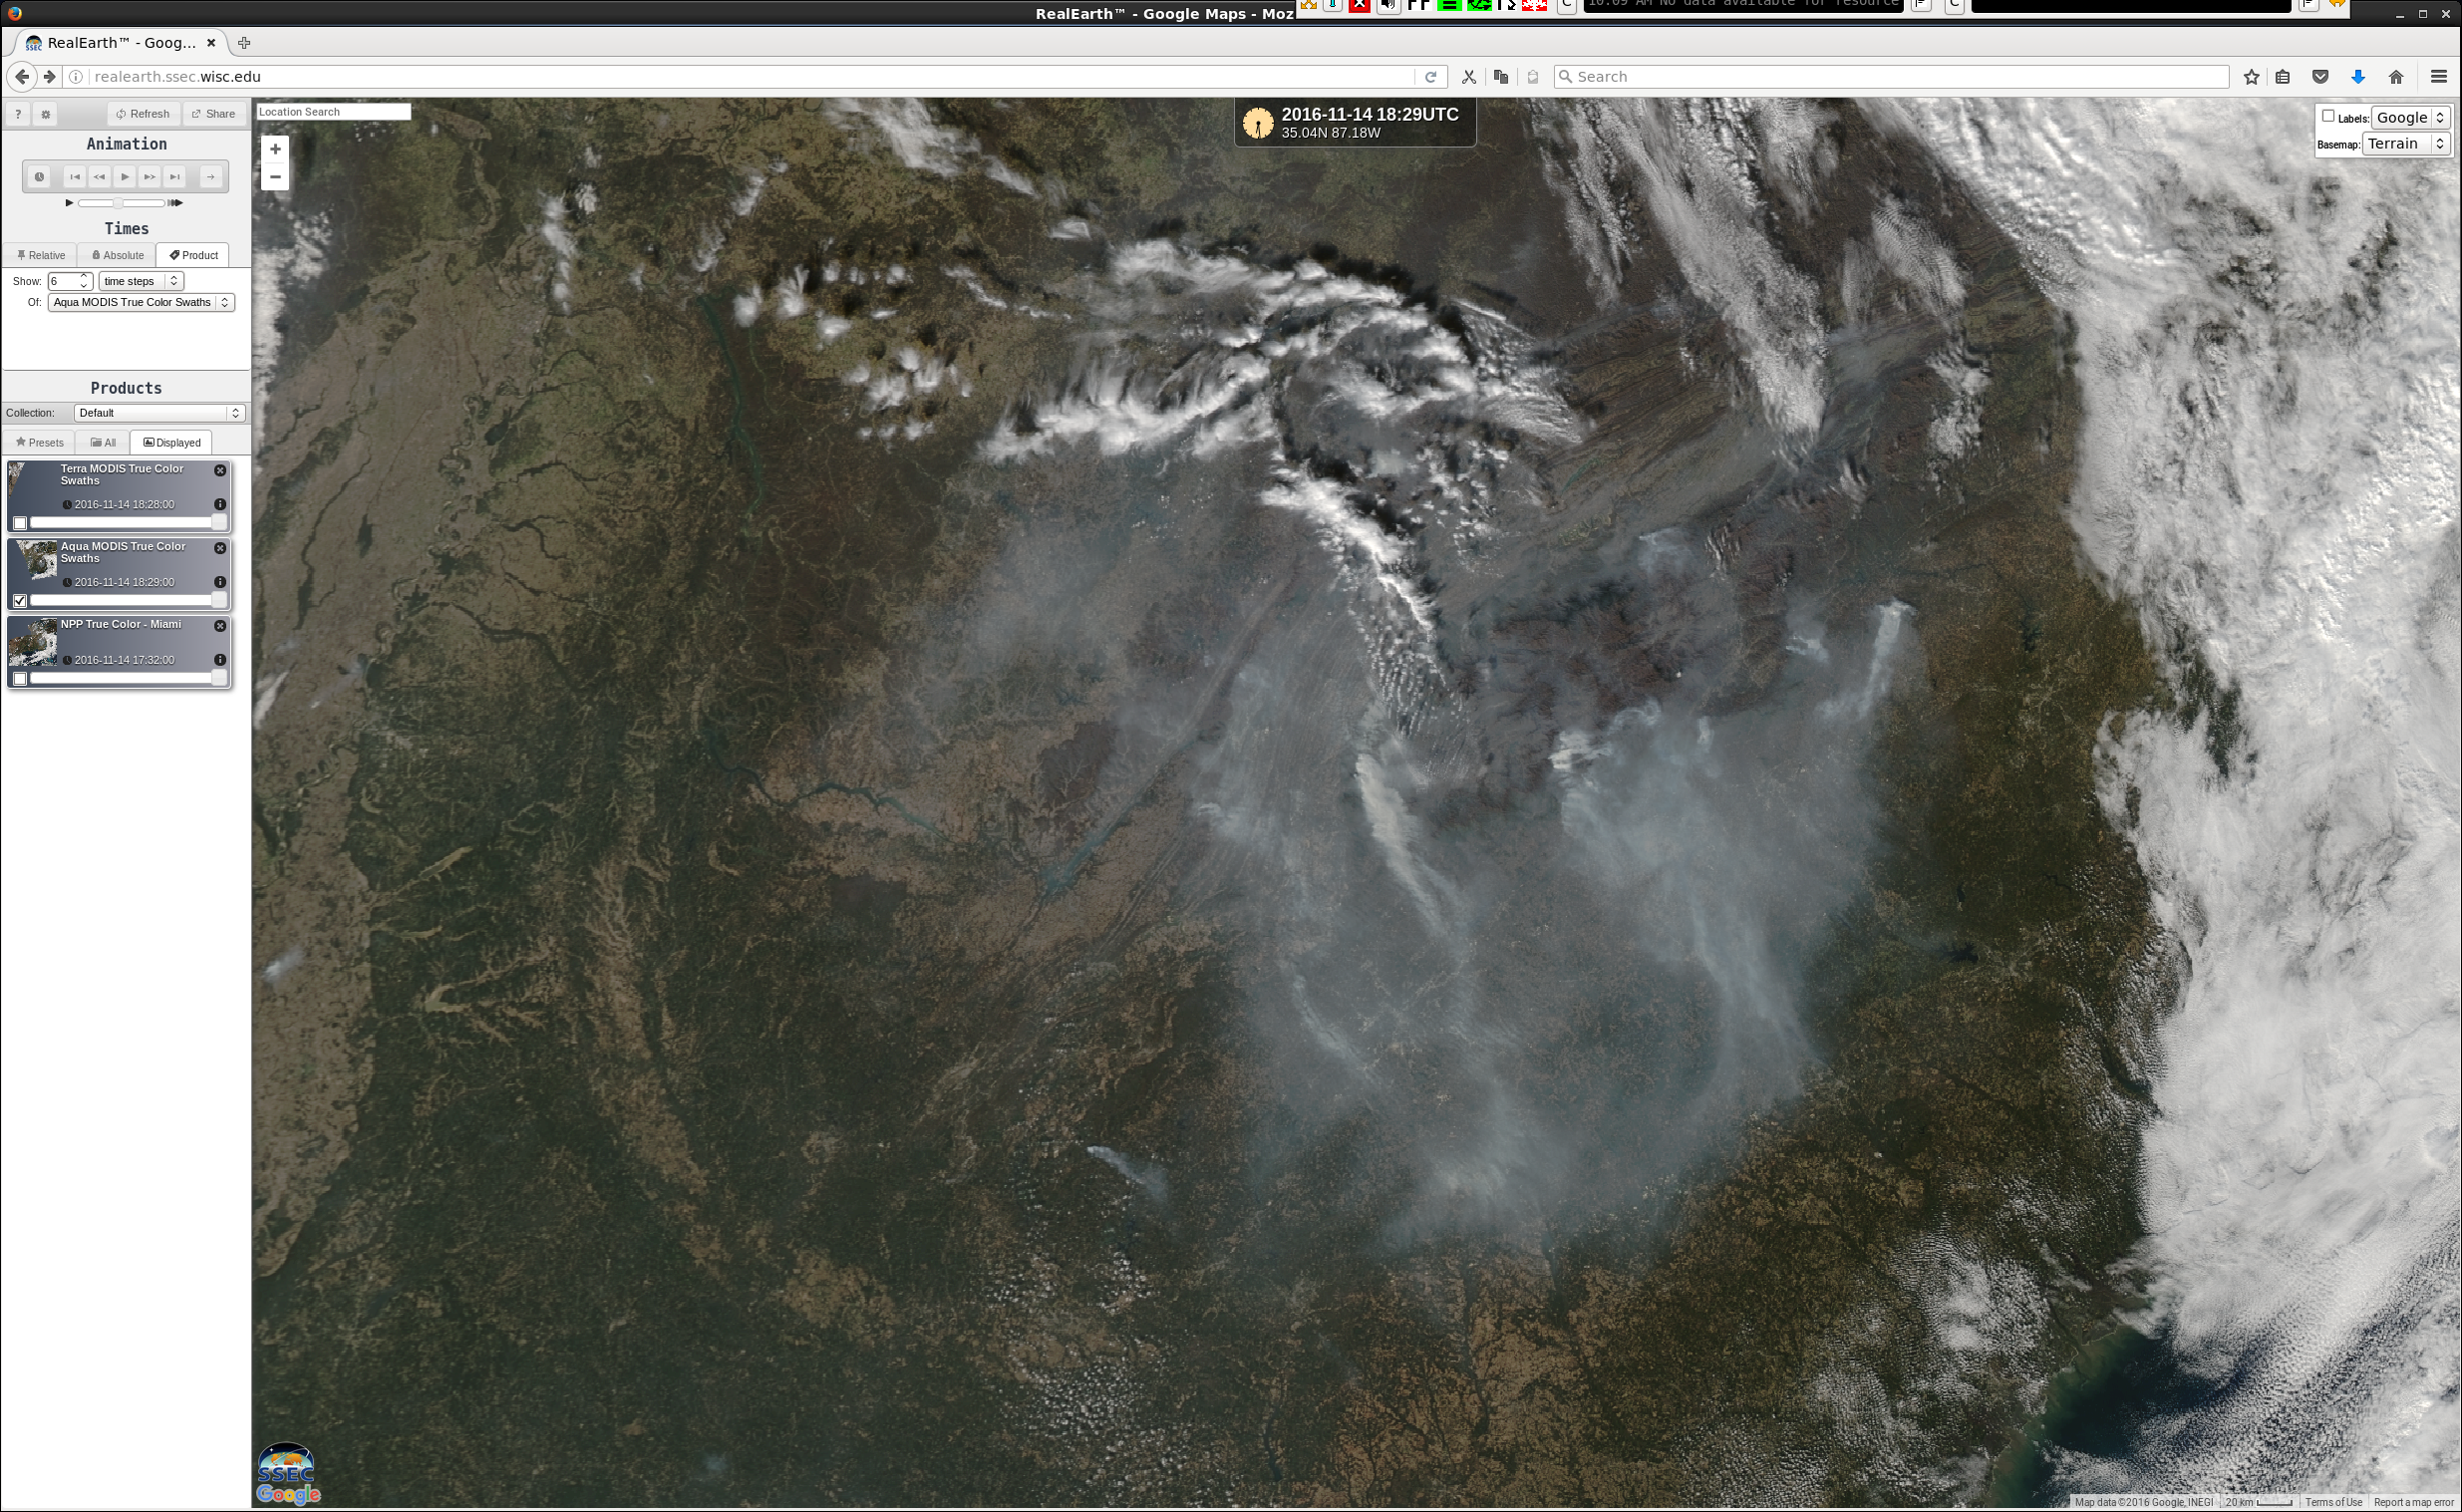
![Terra MODIS (1650 UTC), Aqua MODIS (1829 UTC) and Suomi NPP VIIRS (1913 UTC) true-color images [click to enlarge]](https://cimss.ssec.wisc.edu/satellite-blog/wp-content/uploads/sites/5/2016/11/161114_modis_viirs_truecolor_Southeast_US_fires_anim.gif)
![GOES-13 Visible (0.63 µm) images, with hourly plots of surface weather (yellow) and visibility (statute miles, in cyan) [click to animate]](https://cimss.ssec.wisc.edu/satellite-blog/wp-content/uploads/sites/5/2016/11/161114_goes13_visible_surface_weather_and_visibility_Southeast_US_fires_anim.gif)
![Suomi NPP VIIRS Shortwave Infrared (3.74 um) and Day/Night Band (0.7 um) images, plus METAR surface reports [click to enlarge]](https://cimss.ssec.wisc.edu/satellite-blog/wp-content/uploads/sites/5/2016/11/161115_0735utc_suomi_npp_viirs_shortwaveIR_DayNightBand_Southeast_US_fires_anim.gif)
![Terra MODIS and Suomi NPP VIIRS true-color images, with VIIRS Aerosol Optical Depth (click to enlarge]](https://cimss.ssec.wisc.edu/satellite-blog/wp-content/uploads/sites/5/2016/11/161115_terra_modis_truecolor_suomi_npp_viirs_truecolor_aod_Southeast_US_fires_anim.gif)
![Suomi NPP VIIRS Visible (0.64 µm) image with a PIREP over South Carolina [click to enlarge]](https://cimss.ssec.wisc.edu/satellite-blog/wp-content/uploads/sites/5/2016/11/161115_1859utc_viirs_visible_pirep_SC.jpg)
![Aqua MODIS Visible (0.65 µm) image with a PIREP over Georgia [click to enlarge]](https://cimss.ssec.wisc.edu/satellite-blog/wp-content/uploads/sites/5/2016/11/161115_1912utc_modis_visible_pirep_GA.jpg)
![GOES-13 Visible (0.63 µm) image with a PIREP over North Carolina [click to enlarge]](https://cimss.ssec.wisc.edu/satellite-blog/wp-content/uploads/sites/5/2016/11/161115_2115utc_goes13_visible_pirep_NC.jpg)
![Terra/Aqua MODIS and Suomi NPP VIIRS true- color images [click to enlarge]](https://cimss.ssec.wisc.edu/satellite-blog/wp-content/uploads/sites/5/2016/11/161116_1637utc_terra_modis_1818utc_aqua_modis_1840utc_suomi_npp_viirs_truecolor_anim.gif)
![Terra MODIS Visible (0.65 µm), Cirrus (1.375 µm) and Infrared Window (11.0 µm) images [click to enlarge]](https://cimss.ssec.wisc.edu/satellite-blog/wp-content/uploads/sites/5/2016/11/161114_1650utc_terra_modis_visible_cirrus_infrared_anim.gif)
