GOES-15 (GOES-West) Visible (0.63 µm) images during the daylight hours on 23, 24 and 25 October 2016 (above) revealed the hazy signature of large amounts of airborne glacial silt and sand from the Copper River Valley being transported southward over the adjacent offshore waters of the Gulf of Alaska. The fine... Read More
![GOES-15 Visible (0.63 µm) images, 23 through 25 October 2016, with hourly surface observations [click to play animation]](https://cimss.ssec.wisc.edu/satellite-blog/wp-content/uploads/sites/5/2016/10/960x1280_WESTL_B1_GOES15_VIS_AK_24OCT2016_2016298_233000_0001PANEL.GIF)
GOES-15 Visible (0.63 µm) images, 23 through 25 October 2016, with hourly surface observations [click to play animation]
GOES-15
(GOES-West) Visible (0.63 µm) images during the daylight hours on 23, 24 and 25 October 2016
(above) revealed the hazy signature of large amounts of airborne glacial silt and sand from the
Copper River Valley being transported southward over the adjacent offshore waters of the Gulf of Alaska. The fine glacial silt and sand particles were being lofted by strong katabatic gap winds being channeled southward down the Copper River Valley — these winds were the result of a strong pressure gradient between arctic high pressure that was moving from the Interior of Alaska to the Yukon Territory of Canada (
surface analyses) and a large occluded low centered off the coast of British Columbia and the US Pacific Northwest (
24 October visible imagery).
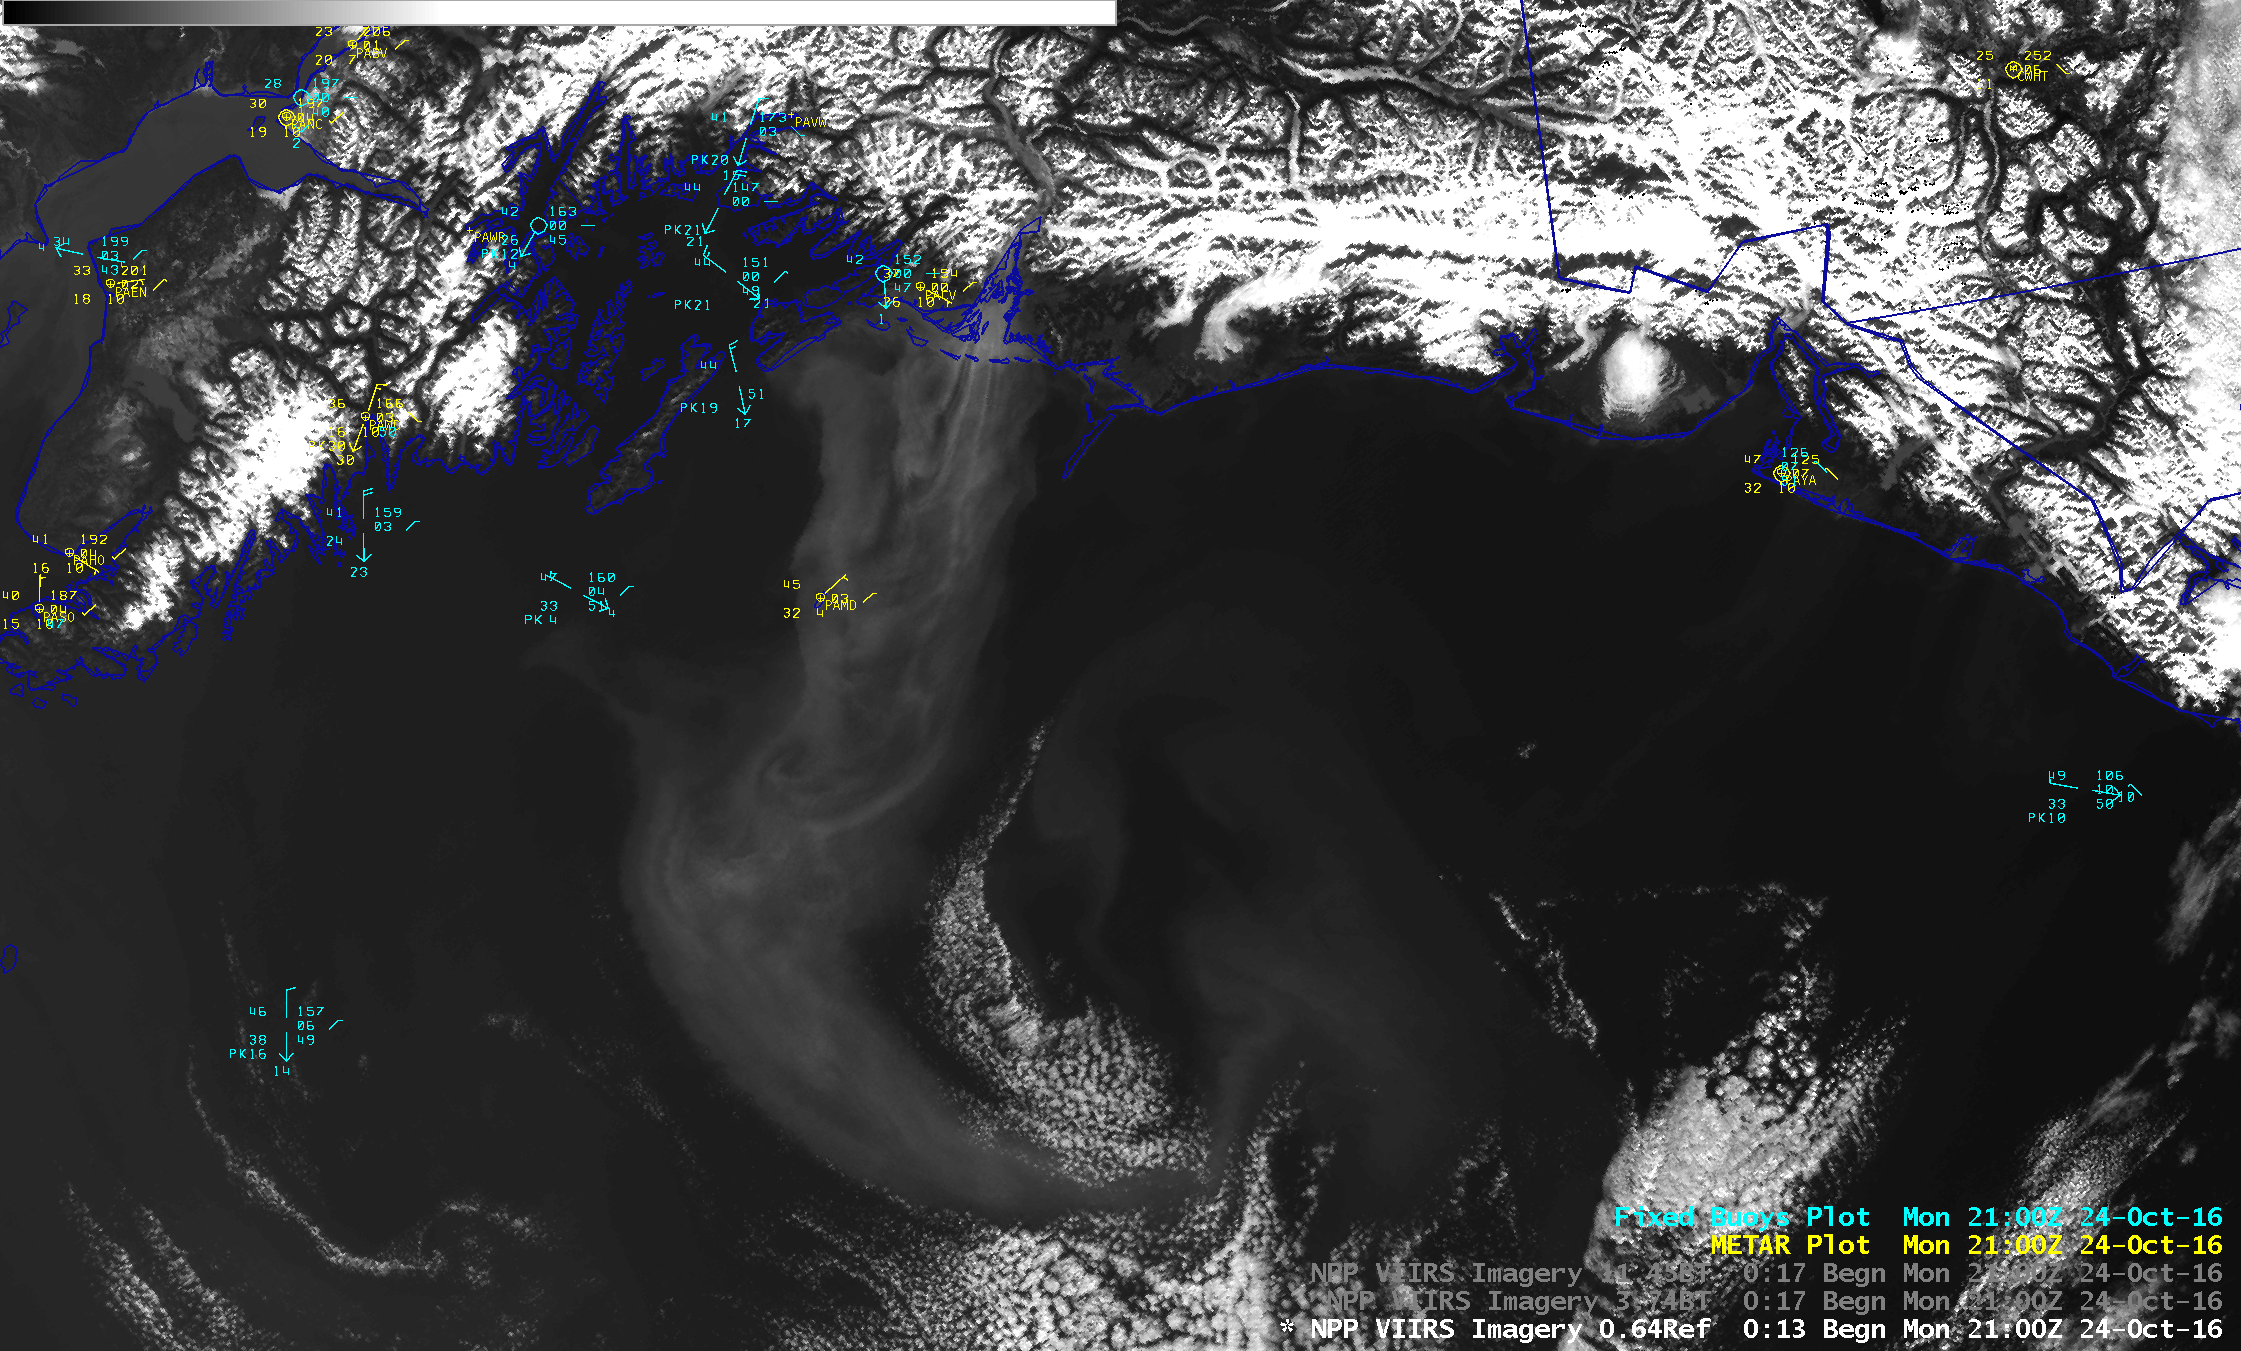
![Suomi NPP VIIRS Visible (0.64 µm), Shortwave Infrared (3.74 µm) and Infrared Window (11.45 µm) images on 24 October 2016 [click to enlarge]](https://cimss.ssec.wisc.edu/satellite-blog/wp-content/uploads/sites/5/2016/10/161024_suomi_npp_viirs_Visible_ShortwaveIR_Infrared_Window_Copper_River_AK_glacial_silt_anim.gif)
Suomi NPP VIIRS Visible (0.64 µm), Shortwave Infrared (3.74 µm) and Infrared Window (11.45 µm) images on 24 October 2016 [click to enlarge]
Comparisons between Suomi NPP VIIRS Visible (0.64 µm), Shortwave Infrared (3.74 µm) and Infrared Window (11.45 µm) images on 24 October
(above) and 25 October
(below) showed that the small airborne glacial silt/sand particles were very reflective to solar radiation, and exhibited a
warmer (darker gray to black enhancement) signature in the Shortwave Infrared images (similar to the warmer signature seen due to spherical water droplets at the tops of supercooled stratiform clouds). On 25 October a large aerosol plume was also emerging from
Yakutat Bay, moving southwestward.
![Suomi NPP VIIRS Visible (0.64 µm), Shortwave Infrared (3.74 µm) and Infrared Window (11.45 µm) images on 25 October 2016 [click to enlarge]](https://cimss.ssec.wisc.edu/satellite-blog/wp-content/uploads/sites/5/2016/10/161025_suomi_npp_viirs_Visible_ShortwaveIR_Infrared_Window_Copper_River_AK_glacial_silt_anim.gif)
Suomi NPP VIIRS Visible (0.64 µm), Shortwave Infrared (3.74 µm) and Infrared Window (11.45 µm) images on 25 October 2016 [click to enlarge]
![Time series of surface observations at Middleton Island in the Gulf of Alaska [click to enlarge]](https://cimss.ssec.wisc.edu/satellite-blog/wp-content/uploads/sites/5/2016/10/161023-25_PAMD_SFCMG.GIF)
Time series of surface observations at Middleton Island in the Gulf of Alaska [click to enlarge]
A time series plot of surface observations from Middleton Island (PAMD) in the northern Gulf of Alaska
(above) showed that the surface visibility was reduced to 3 miles on 24 October and 5 miles on 25 October as the Copper River plume periodically passed over the island. The ceiling height on 24 October was reported to be as low as 1400 feet as the surface visibility began to decrease. Along the southern coast of Alaska just west of the Copper River Delta, the visibility at Cordova (PACV) dropped to 5 miles with haze reported late in the day on 25 October as the western edge of the plume drifted over that area
(below).
![Time series of surface observations at Cordova, Alaska [click to enlarge]](https://cimss.ssec.wisc.edu/satellite-blog/wp-content/uploads/sites/5/2016/10/161023-25_PACV_SFCMG.GIF)
Time series of surface observations at Cordova, Alaska [click to enlarge]
A zoom-in of the 2246 UTC Suomi NPP VIIRS true-color Red/Green/Blue (RGB) image on 24 October (using
RealEarth) showed the gray to light tan color of the glacial silt/sand plume.
![Suomi NPP VIIRS true-color RGB images [click to enlarge]](https://cimss.ssec.wisc.edu/satellite-blog/wp-content/uploads/sites/5/2016/10/161024_suomi_npp_viirs_truecolor_truecolor_Copper_River_Valley_glacial_silt_anim.gif)
Suomi NPP VIIRS true-color RGB images [click to enlarge]
Shown below are toggles between Suomi NPP VIIRS true-color RGB and Aerosol Optical Thickness (
AOT) images (from the
eIDEA site) for 23, 24 and 25 October. Very high values of AOT (in the 0.8 to 1.0 range) were associated with the Copper River plumes.
![Suomi NPP VIIRS true-color RGB and Aerosol Optical Depth images for 23 October [click to enlarge]](https://cimss.ssec.wisc.edu/satellite-blog/wp-content/uploads/sites/5/2016/10/161023_suomi_npp_viirs_aot_rgb_anim.gif)
Suomi NPP VIIRS true-color RGB and Aerosol Optical Depth images for 23 October [click to enlarge]
![Suomi NPP VIIRS true-color RGB and Aerosol Optical Thickness images for 24 October [click to enlarge]](https://cimss.ssec.wisc.edu/satellite-blog/wp-content/uploads/sites/5/2016/10/161024_suomi_npp_viirs_aot_rgb_anim.gif)
Suomi NPP VIIRS true-color RGB and Aerosol Optical Thickness images for 24 October [click to enlarge]
![Suomi NPP VIIRS true-color RGB and Aerosol Optical Thickness images for 25 October [click to enlarge]](https://cimss.ssec.wisc.edu/satellite-blog/wp-content/uploads/sites/5/2016/10/161025_suomi_npp_viirs_aot_rgb_anim.gif)
Suomi NPP VIIRS true-color RGB and Aerosol Optical Thickness images for 25 October [click to enlarge]
A toggle between Terra MODIS Visible (0.64 µm) and Infrared (11-12 µm, commonly referred to as the “split window difference”) Brightness Temperature Difference (BTD) images on 25 October
(below) revealed that there was a very subtle Copper River plume signature in the BTD image (note: the
default 11-12 µm BTD color enhancement was modified to better highlight the plume in this example).
![Terra MODIS Visible (0.64 µm) and Infrared (11.0-12.0 µm) Brightness Temperature Difference images [click to enlarge]](https://cimss.ssec.wisc.edu/satellite-blog/wp-content/uploads/sites/5/2016/10/161025_2031utc_terra_modis_visible_ir_btd_Copper_River_AK_plume_anim.gif)
Terra MODIS Visible (0.64 µm) and Infrared (11.0-12.0 µm) Brightness Temperature Difference images [click to enlarge]
In that respect, the MODIS Infrared “split window” BTD images could be used to help locate the Copper River plume during nighttime as well as daytime, as seen in the image comparison below. The
ABI instrument on
GOES-R will have similar
11 µm and
12 µm Infrared bands, and will have the capability to provide this type of BTD imagery at 5 minute intervals over the entire Full Disk scan.
![Nighttime (0706 UTC) and daytime (2031 UTC) Terra MODIS Infrared (11-12 µm) Brightness Temperature Difference images [click to enlarge]](https://cimss.ssec.wisc.edu/satellite-blog/wp-content/uploads/sites/5/2016/10/161025_0706utc_2031utc_terra_modis_ir_btd_Copper_River_AK_plume_anim.gif)
Nighttime (0706 UTC) and daytime (2031 UTC) Terra MODIS Infrared (11-12 µm) Brightness Temperature Difference images [click to enlarge]
Previous cases of similar airborne Copper River plumes have been documented on this blog: Oct 2014 | Nov 2013 | Oct 2012.
View only this post
Read Less
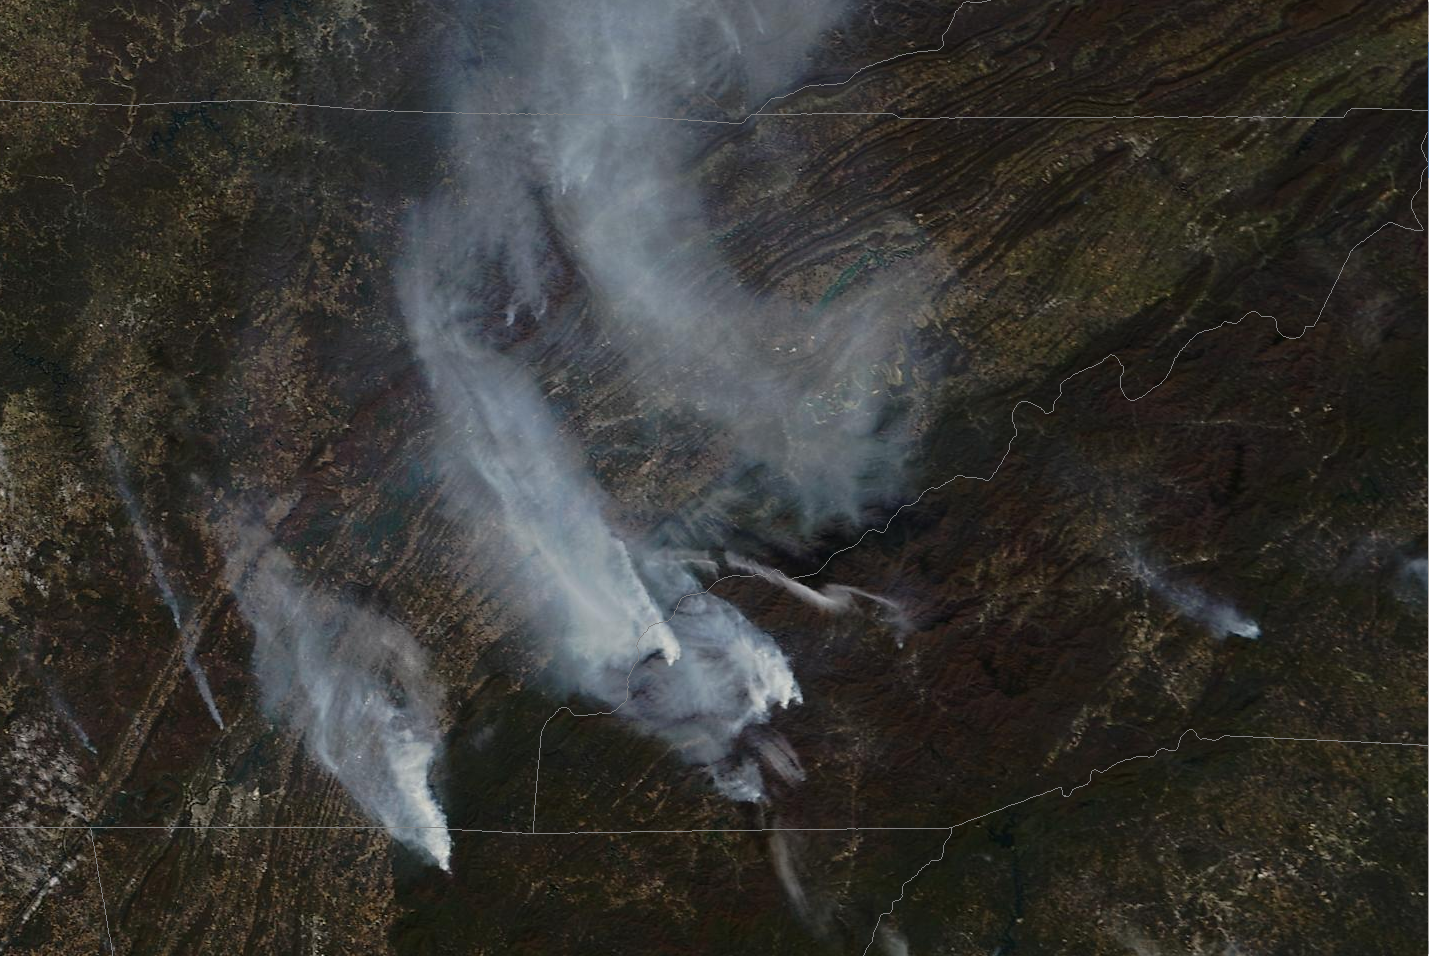
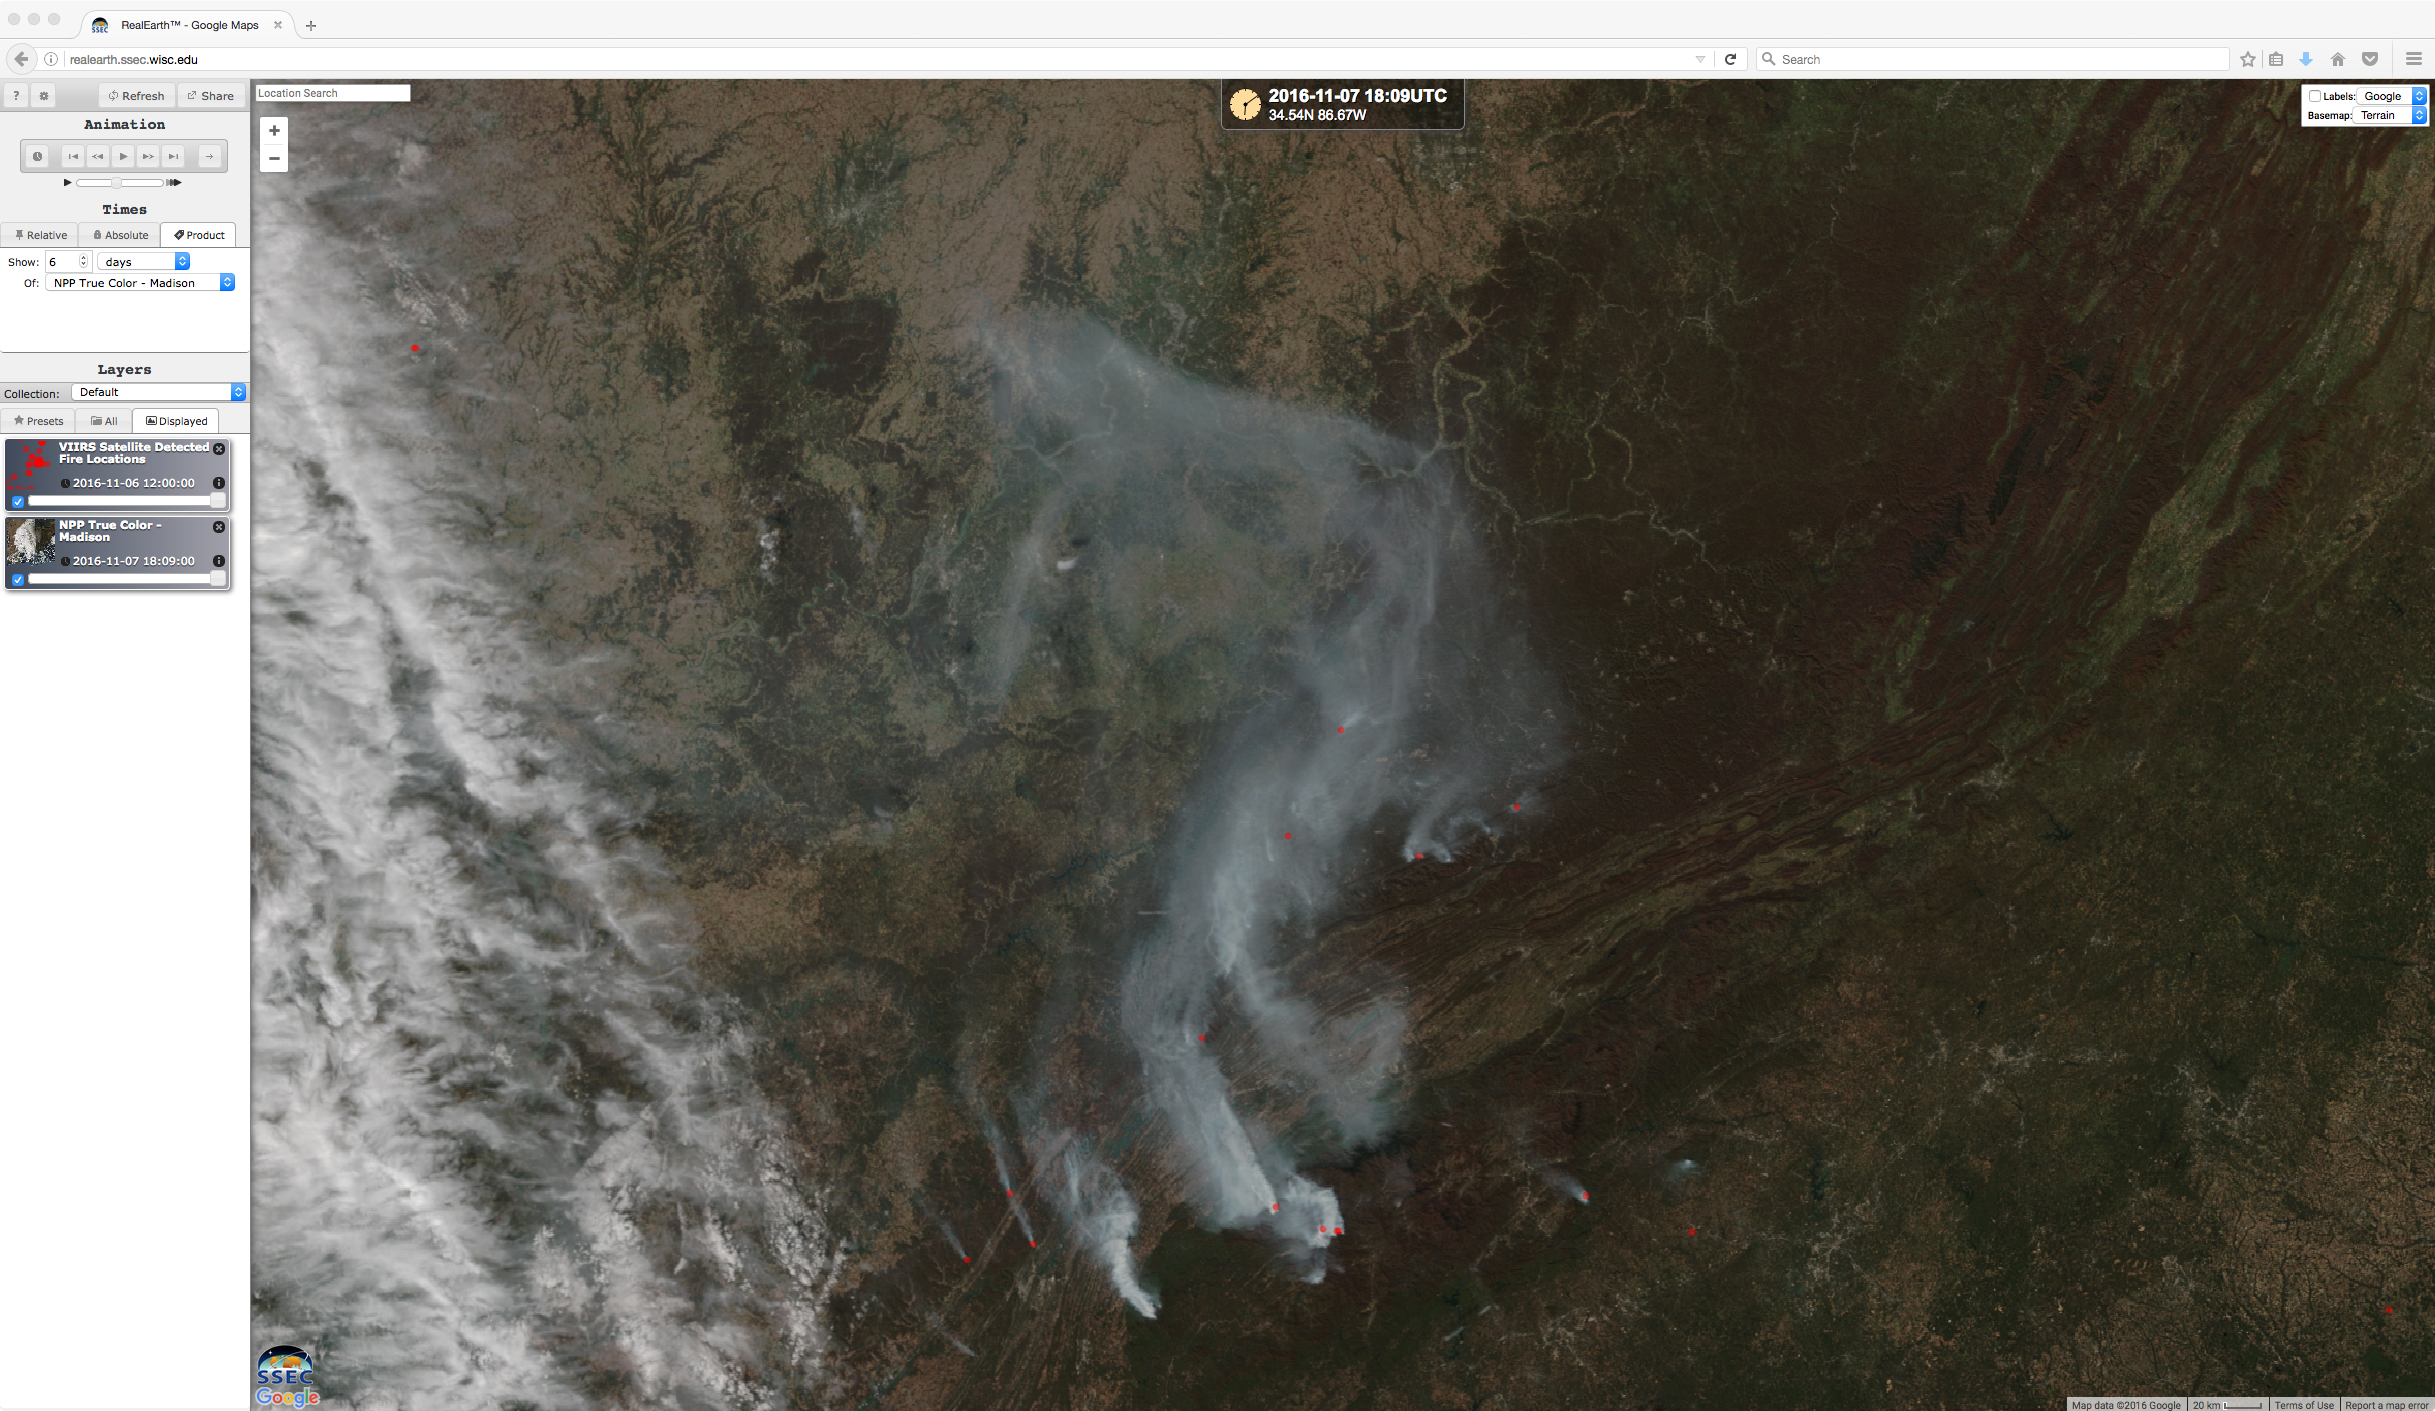
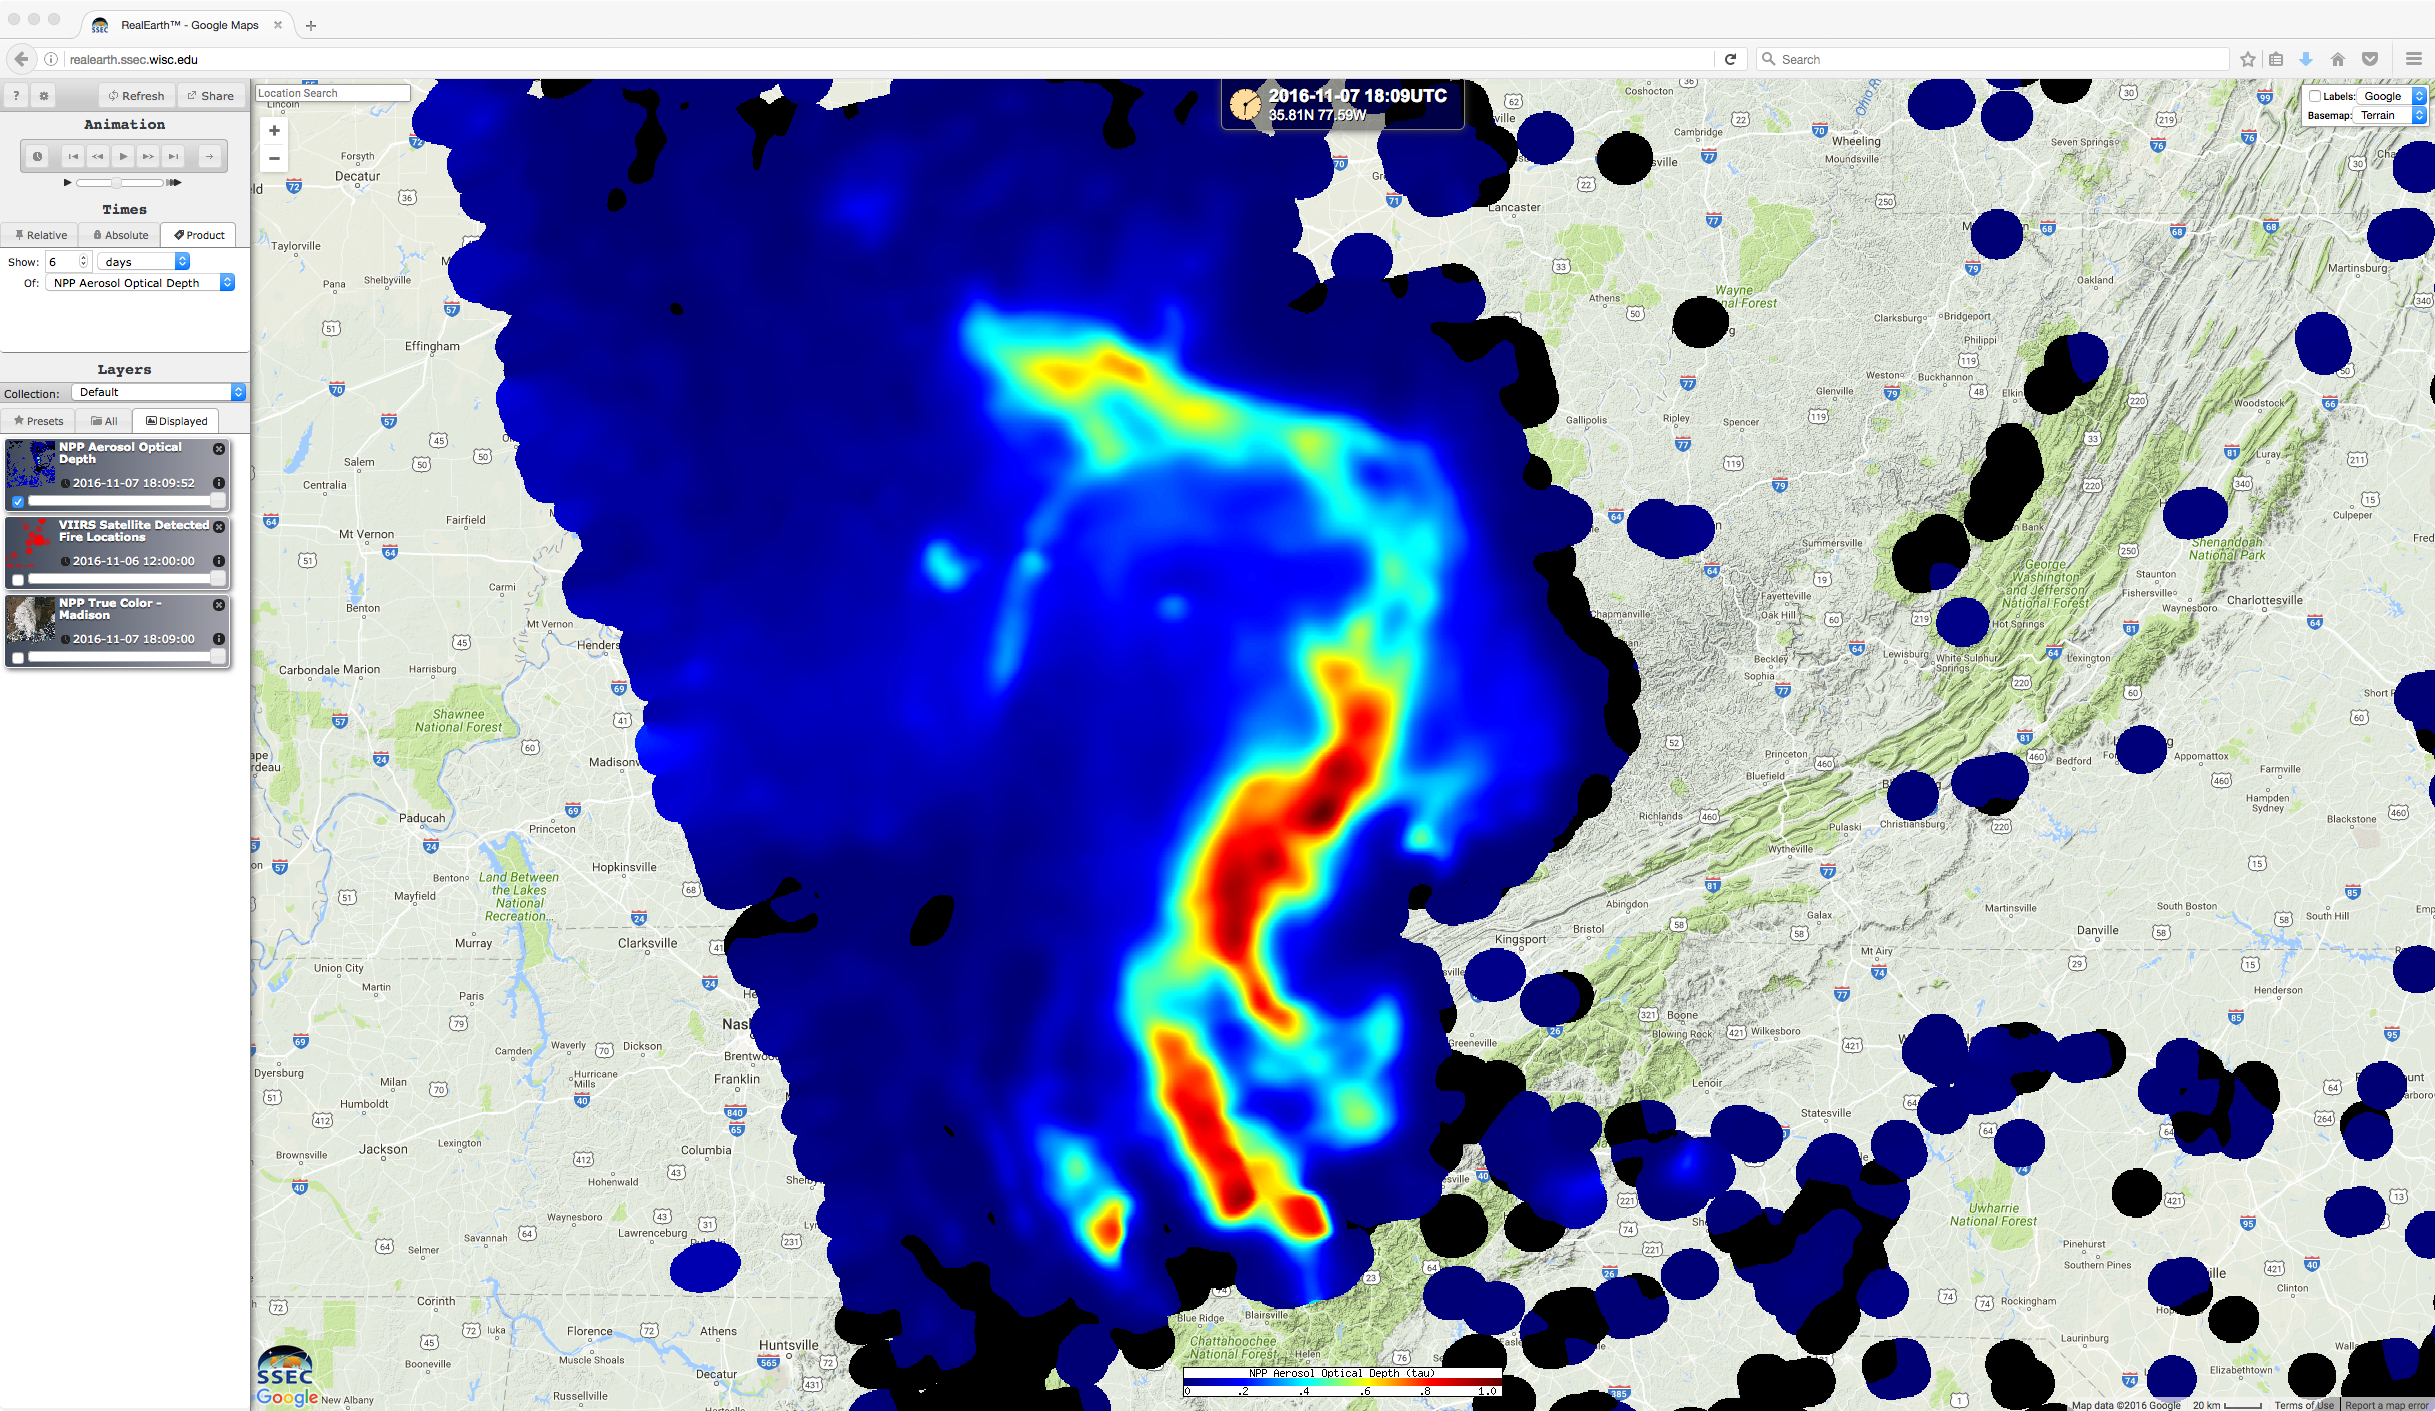
![Suomi NPP VIIRS true-color image with fire detection locations (red dots), and VIIRS Aerosol Optical Depth product [click to enlarge]](https://cimss.ssec.wisc.edu/satellite-blog/wp-content/uploads/sites/5/2016/11/161107_1809utc_suomi_npp_viirs_truecolor_fire_detection_aerosol_optical_depth_anim.gif)
![Terra MODIS, Suomi NPP VIIRS and Aqua MODIS true-color images [click to enlarge]](https://cimss.ssec.wisc.edu/satellite-blog/wp-content/uploads/sites/5/2016/11/161107_modis_VIIRS_truecolor_Southeast_US_fires_anim.gif)
![GOES-13 Visible (0.63 µm) images; hourly surface weather symbols are plotted in yellow, with surface visibility (statute miles) plotted in cyan [click to play animation]](https://cimss.ssec.wisc.edu/satellite-blog/wp-content/uploads/sites/5/2016/11/161107_goes13_visible_surface_weather_visibility_Southeast_US_fires_anim.gif)
![GOES-13 Visible (0.63 µm) images; hourly surface weather symbols are plotted in yellow, with surface visibility (statute miles) plotted in cyan [click to play animation]](https://cimss.ssec.wisc.edu/satellite-blog/wp-content/uploads/sites/5/2016/11/161110_goes13_visible_surface_weather_visibility_Southeast_US_fires_anim.gif)
![GOES-13 Visible (0.63 µm) image, with cloud ceiling (hundreds of feet above ground level) and visibility (statute miles) plotted in cyan and a Pilot Report in yellow [click to enlarge]](https://cimss.ssec.wisc.edu/satellite-blog/wp-content/uploads/sites/5/2016/11/161110_1545utc_goes13_visible_pirep.png)
![Aqua MODIS true-color image [click to enlarge]](https://cimss.ssec.wisc.edu/satellite-blog/wp-content/uploads/sites/5/2016/11/AQUA_TrueColor_10Nov2016.1000m.png)
![Suomi NPP VIIRS true-color image (with fire detection locations in red) and Aerosol Optical Depth product [click to enlarge]](https://cimss.ssec.wisc.edu/satellite-blog/wp-content/uploads/sites/5/2016/11/161110_1858utc_suomi_npp_viirs_truecolor_fire_detections_aod_Southeast_US_fires_anim.gif)

![EUMETSAT Meteosat-10 Infrared Window (10.8 um) images [click to play MP4 animation]](https://cimss.ssec.wisc.edu/satellite-blog/wp-content/uploads/sites/5/2016/10/960x1280_MSG_B9_MET10_IR_MEDICANE_28-31OCT2016_2016304_120000_0001PANEL.GIF)
![EUMETSAT Meteosat-10 Visible (0.64um) images [click to play MP4 animation]](https://cimss.ssec.wisc.edu/satellite-blog/wp-content/uploads/sites/5/2016/10/960x1280_MSG_B12_MET10_VIS_MEDICANE_30OCT2016_2016304_120000_0001PANEL.GIF)
![Suomi NPP VIIRS true-color images [click to enlarge]](https://cimss.ssec.wisc.edu/satellite-blog/wp-content/uploads/sites/5/2016/10/161028-31_suomi_npp_viirs_truecolor_Medicane_anim.gif)
![MIMIC Total Precipitable Water product [click to play animation]](https://cimss.ssec.wisc.edu/satellite-blog/wp-content/uploads/sites/5/2016/10/161028-31_mimic_tpw_anim.gif)
![Metop-A and Metop-B ASCAT surface scatterometer winds, 28-31 October [click to play animation]](https://cimss.ssec.wisc.edu/satellite-blog/wp-content/uploads/sites/5/2016/10/161028-31_metop_ascat_medicane_anim.gif)
![Suomi NPP ATMS Channel 8 (54.94 GHz) image, 31 October at 0037 UTC [click to enlarge]](https://cimss.ssec.wisc.edu/satellite-blog/wp-content/uploads/sites/5/2016/10/atms_201699A_161031_0037utc_ch8.gif)
![Suomi NPP ATMS Channel 7 (53.596 GHz) image, 31 October at 0037 UTC [click to enlarge]](https://cimss.ssec.wisc.edu/satellite-blog/wp-content/uploads/sites/5/2016/10/atms_201699A_161031_0037utc_ch7.gif)
![North-to-south vertical cross section of Suomi NPP ATMS brightness temperature anomaly [click to enlarge]](https://cimss.ssec.wisc.edu/satellite-blog/wp-content/uploads/sites/5/2016/10/atms_201699A_161031_0037utc_xsection.gif)
![GOES-15 Visible (0.63 µm) images, 23 through 25 October 2016, with hourly surface observations [click to play animation]](https://cimss.ssec.wisc.edu/satellite-blog/wp-content/uploads/sites/5/2016/10/161023-25_goes15_visible_Copper_River_glacial_silt_anim.gif)
