GOES-16 data posted on this page are preliminary, non-operational data that are undergoing testing.The visible animation from late afternoon over west Texas, above, shows a characteristic signature of a shroud of dust around El Paso, TX behind a dryline associated with a developing cyclone in the lee of the Rocky Mountains. This pall of dust... Read More
![GOES-16 Visible (0.64 µm) images, 2132-2232 UTC on 23 March [click to play animated gif]](https://cimss.ssec.wisc.edu/satellite-blog/wp-content/uploads/sites/5/2017/03/GOES16_REDVIS_23MARCH2016_2207.GIF)
GOES-16 Visible (0.64 µm) images, 2132-2232 UTC on 23 March [click to play animated gif]
The visible animation from late afternoon over west Texas, above, shows a characteristic signature of a shroud of dust around El Paso, TX behind a dryline associated with a developing cyclone in the lee of the Rocky Mountains. This pall of dust was visible in many of the 16 channels on the Advanced Baseline Imager (ABI) that sits on GOES-16. The toggle below cycles through the Red visible (0.64 µm), the Blue visible (0.47 µm), the Cirrus channel (1.38 µm), the Snow/ice channel (1.61 µm) and the Upper-Level and Lower-Level water vapor channels (6.19 µm and 7.34 µm, respectively) (Click here for a faster image toggle). In addition, a 2-panel comparison of GOES-16 Visible and Cirrus band imagery is available here.
![GOES-16 Visible (0.64 µm and 0.47 µm), Cirrus (1.38 µm), Snow/Ice (1.61 µm), Upper level Water Vapor (6.19 µm) and Lower Level Water Vapor (7.34 µm) images, 2132 UTC on 23 March [click to enlarge]](https://cimss.ssec.wisc.edu/satellite-blog/wp-content/uploads/sites/5/2017/03/GOES16_2137UTC_23MARCH2017_6channeltoggleslow.gif)
GOES-16 Visible (0.64 µm and 0.47 µm), Cirrus (1.38 µm), Snow/Ice (1.61 µm), Upper level Water Vapor (6.19 µm) and Lower Level Water Vapor (7.34 µm) images, 2132 UTC on 23 March [click to enlarge]
Several aspects of the toggle above bear comment. Note that the
blue channel (0.47 µm) has in general a ‘hazier’ appearance than the 0.64 µm
red channel. Atmospheric scattering is more important at shorter wavelengths, and that is picked up by the satellite. The
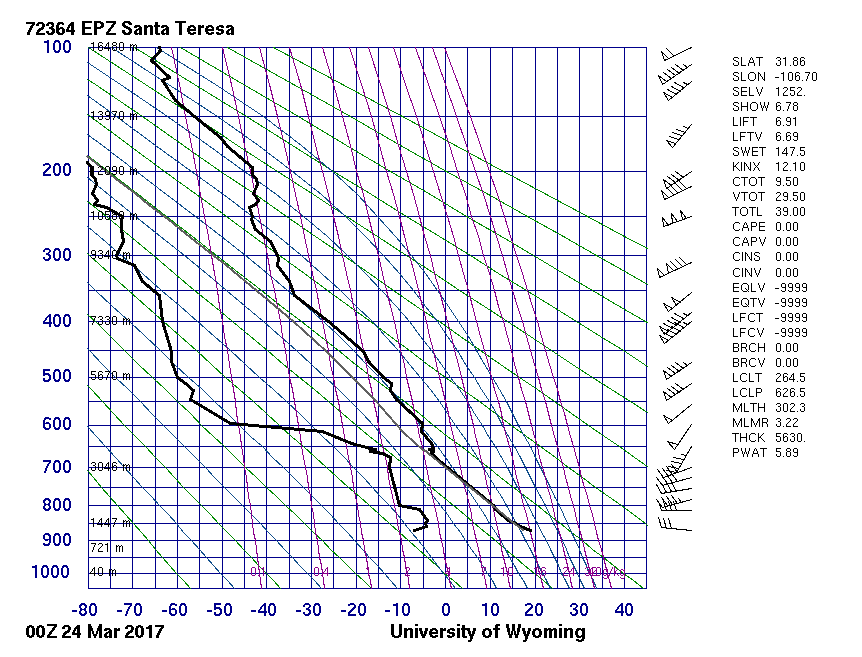
1.38 µm ‘Cirrus’ Channel generally does not see the surface because of water vapor absorption at that wavelength. However, the atmosphere behind the dry line is sufficiently parched (total Precipitable Water in
the El Paso sounding on 0000 UTC 24 March is less than 6 mm; sounding from
this site) that complete attenuation by water vapor is not occurring; dust is highly reflective at 1.38 µm and a signal becomes apparent in the dry air from west Texas southwestward into central Mexico.
Thin dust is very difficult to detect in the 1.61 µm snow/ice channel because solar energy at that wavelength reflected from the surface moves unimpeded through thin dust; thus you can generally see the surface in dusty regions in the 1.61 µm channel. On this date the 1.61 µm channel nimbly discriminated between water clouds (over central Mexico) and ice clouds (over much of the rest of the domain, as shown in this toggle between 0.64 µm and 1.61 µm : only the clouds composed of water are reflective (white) in both channels.
The atmosphere was sufficiently dry on this date that the lower-level (7.34 µm) water vapor channel detected surface features (horizontal convective rolls) associated with the blowing dust. (click here for the 6.19 µm image; surface features are not so apparent). Weighting functions computed at those wavelengths show a significant contribution from the surface at 7.4 µm (the red line), and also at 7.0 µm, (the green line), so the mid-level water vapor imagery from GOES-16 likely also shows surface influences); the 6.5 µm weighting function (the blue line) does not extend to the surface (These GOES-13 Sounder Weighting Functions that are similar to those from the GOES-16 ABI are from this site) so it’s unlikely that the 6.19 µm imagery shows surface features.
The GOES-R Website has fact sheets on the 0.47 µm, 0.64 µm, 1.38 µm, 1.61 µm, 6.19 µm and 7.34 µm channels.
Added: The RAMSDIS GOES-16 Loop of the Day from 23 March showed the Dust RGB product.
View only this post
Read Less
![Himawari-8 Visible (0.64 µm) and Infrared Window (10.4 µm) images [Click to play animation]](https://cimss.ssec.wisc.edu/satellite-blog/wp-content/uploads/sites/5/2017/03/170324_himawari8_visible_infrared_Kambalny_volcano_anim.gif)
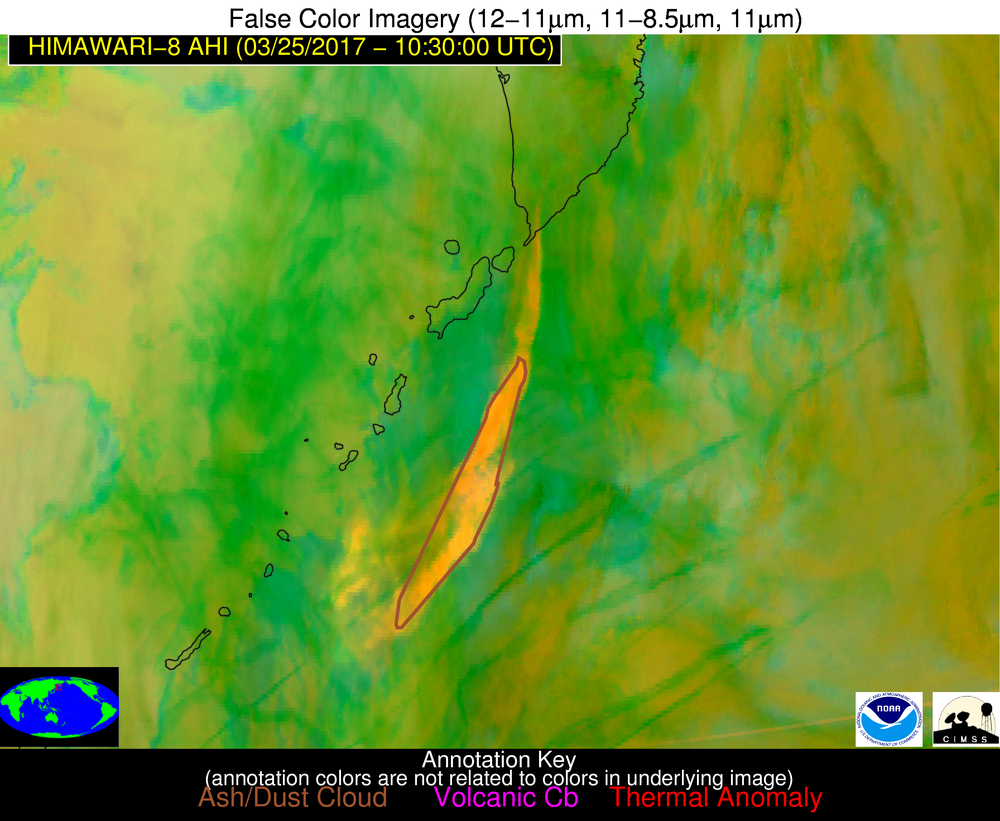
![Himarari-8 false-color RGB images [click to play animation]](https://cimss.ssec.wisc.edu/satellite-blog/wp-content/uploads/sites/5/2017/03/170325_himawari8_rgb_Kambalny_volcano_anim.gif)
![Terra MODIS, Suomi NPP VIIRS and Aqua MODIS true-color RGB images [Click to enlarge]](https://cimss.ssec.wisc.edu/satellite-blog/wp-content/uploads/sites/5/2017/03/170325_modis_viirs_truecolor_Kambalnyash_plume_anim.gif)
![Terra MODIS truecolor RGB images from 25 and 26 March, with arrows indicating the perimeter of surface ash fall signatures on each day [Click to enlarge]](https://cimss.ssec.wisc.edu/satellite-blog/wp-content/uploads/sites/5/2017/03/170325-26_terra_modis_truecolor_Kambalny_surface_ash_fall_anim.gif)
![GOES-16 Visible (0.64 µm) images, 2132-2232 UTC on 23 March [click to play animated gif]](https://cimss.ssec.wisc.edu/satellite-blog/wp-content/uploads/sites/5/2017/03/GOES16_REDVIS_23MARCH2016_2132_2232anim.gif)
![GOES-16 Visible (0.64 µm) images, 1202-1732 UTC on 21 March [click to play animated gif]](https://cimss.ssec.wisc.edu/satellite-blog/wp-content/uploads/sites/5/2017/03/GOES16_B2_21MARCH2017_1202_1732anim.gif)
![GOES-16 Cirrus Channel (1.38 µm) images, 1202-1732 UTC on 21 March [click to play animated gif]](https://cimss.ssec.wisc.edu/satellite-blog/wp-content/uploads/sites/5/2017/03/GOES16_B4_21MARCH2017_1202_1732anim.gif)
![Terra MODIS Visible (0.65 µm) and Cirrus (1.375 µm) images [click to enlarge]](https://cimss.ssec.wisc.edu/satellite-blog/wp-content/uploads/sites/5/2017/03/170321_1607utc_modis_visible_cirrus_OH_valley_anim.gif)
![GOES-16 Visible (0.64 µm) images, with SPC storm reports of hail size [click to play MP4 animation]](https://cimss.ssec.wisc.edu/satellite-blog/wp-content/uploads/sites/5/2017/03/960x1280_GOES16FL_B2_GOES16_VIS_IL_IN_HAIL_20MAR2017_2017079_173028_0001PANEL.GIF)
![GOES-16 Visible (0.64 µm) images, with SPC storm reports of hail (red) and wind damage (cyan) [click to play MP4 animation]](https://cimss.ssec.wisc.edu/satellite-blog/wp-content/uploads/sites/5/2017/03/960x1280_GOES16FL_B2_GOES16_VIS_TN_GA_SC_HAIL_WIND_21MAR2017_2017080_231259_0001PANEL.GIF)
