![GOES-16 Shortwave Infrared (3.9 µm, left) and GOES-13 Shortwave Infrared (3.9 µm, right) images [click to play MP4 animation]](https://cimss.ssec.wisc.edu/satellite-blog/wp-content/uploads/sites/5/2017/03/G16_G13_SWIR_SC_FIRE_19MAR2017_958x638_B72_00065_2017078_154658_154500_0002PANELS.GIF)
GOES-16 Shortwave Infrared (3.9 µm, left) and GOES-13 Shortwave Infrared (3.9 µm, right) images [click to play MP4 animation]
The ABI instrument on GOES-16 is able to scan 2 Mesoscale Sectors, each of which provides images at 1-minute intervals. For what was likely a prescribed burn in the Francis Marion National Forest (near the coast of South Carolina) on 19 March 2017, a comparison of 1 minute Mesoscale Sector GOES-16 and 15-30 minute Routine Scan GOES-13 Shortwave Infrared (3.9 µm) images (above; also available as a 50 Mbyte animated GIF) demonstrated the clear advantage of 1-minute imagery in terms of monitoring the short-term intensity fluctuations that are often exhibited by fire activity. In this case, the intensity of the fire began to increase during 15:15-15:45 UTC — a time period when there was a 30-minute gap in routine scan imagery from GOES-13. The GOES-16 shortwave infrared brightness temperature then became very hot (red enhancement) beginning at 15:46:58 UTC, which again was not captured by GOES-13 — even on the 16:00 UTC and later images (however, this might be due to the more coarse 4-km spatial resolution of GOES-13, compared to the 2-km resolution of the shortwave infrared band on GOES-16). Similar short-term intensity fluctuations of a smaller fire (burning just to the southwest) were not adequately captured by GOES-13.
The corresponding GOES-16 vs GOES-13 Visible image comparison (below; also available as a 72 Mbyte animated GIF) also showed the advantage of 1-minute scans, along with the improved 0.5-km spatial resolution of the 0.64 µm spectral band on GOES-16 (which allowed brief pulses of pyrocumulus clouds to be seen developing over the fire source region).
![GOES-16 Visible (0.64 µm, left) and GOES-13 Visible (0.63 µm, right) images [click to play MP4 animation]](https://cimss.ssec.wisc.edu/satellite-blog/wp-content/uploads/sites/5/2017/03/G16_G13_VIS_SC_FIRE_19MAR2017_958x638_B21_00186_2017078_175558_174500_0002PANELS.GIF)
GOES-16 Visible (0.64 µm, left) and GOES-13 Visible (0.63 µm, right) images [click to play MP4 animation]
![Terra MODIS, Aqua MODIS and Suomi NPP VIIRS true-color images [click to enlarge]](https://cimss.ssec.wisc.edu/satellite-blog/wp-content/uploads/sites/5/2017/03/170319_modis_viirs_truecolor_SC_fire_anim.gif)
Terra MODIS, Aqua MODIS and Suomi NPP VIIRS true-color images [click to enlarge]
View only this post Read Less

![GOES-16 Visible (0.64 µm, left), Near-Infrared (1.61 µm, center) and Shortwave Infrared (3.9 µm, right) images [click to enlarge]](https://cimss.ssec.wisc.edu/satellite-blog/wp-content/uploads/sites/5/2017/03/170316_goes16_visible_nearIR_shortwaveIR_SpaceX_launch_2_anim.gif)
![GOES-16 Lower-Level Water Vapor (7.3 µm, left), Mid-Level Water Vapor (6.9 µm, middle) and Upper-Level Water Vapor (6.2 µm, right) images [click to enlarge]](https://cimss.ssec.wisc.edu/satellite-blog/wp-content/uploads/sites/5/2017/03/170316_goes16_water_vapor_SpaceX_launch_2_anim.gif)
![GOES-16 Near-Infrared (1.61 µm and 2.2 µm) and Shortwave Infrared (3.9 µm) images [click to enlarge]](https://cimss.ssec.wisc.edu/satellite-blog/wp-content/uploads/sites/5/2017/03/170316_055933utc_goes16_bands_5_6_7_spacex_launch_anim.gif)
![GOES-16 Water Vapor (6.9 µm) images, with hourly plots of surface weather [click to play MP4 animation]](https://cimss.ssec.wisc.edu/satellite-blog/wp-content/uploads/sites/5/2017/03/960x1280_GOES16FL_B9_GOES16_WV_B9_EASTERN_US_13-15MAR2017_2017073_180251_0001PANEL.GIF)
![GOES-16 Water Vapor (6.9 um) images, with hourly surface weather symbols [click to play animation]](https://cimss.ssec.wisc.edu/satellite-blog/wp-content/uploads/sites/5/2017/03/170314_goes16_water_vapor_band_9_Northeast_US_anim.gif)
![GOES-16 Visible (0.64 µm) images, with hourly surface plots [click to play MP4 animation]](https://cimss.ssec.wisc.edu/satellite-blog/wp-content/uploads/sites/5/2017/03/960x1280_GOES16FL_B2_GOES16_VIS_B2_MESO_LMICH_14MAR2017_2017073_190328_0001PANEL.GIF)
![GOES-16 Water Vapor images: 6.2 µm (top), 6.9 µm (middle) and 7.3 µm (bottom) [click to play animation]](https://cimss.ssec.wisc.edu/satellite-blog/wp-content/uploads/sites/5/2017/03/170315_goes16_water_vapor_KAVL_mountain_waves_anim.gif)
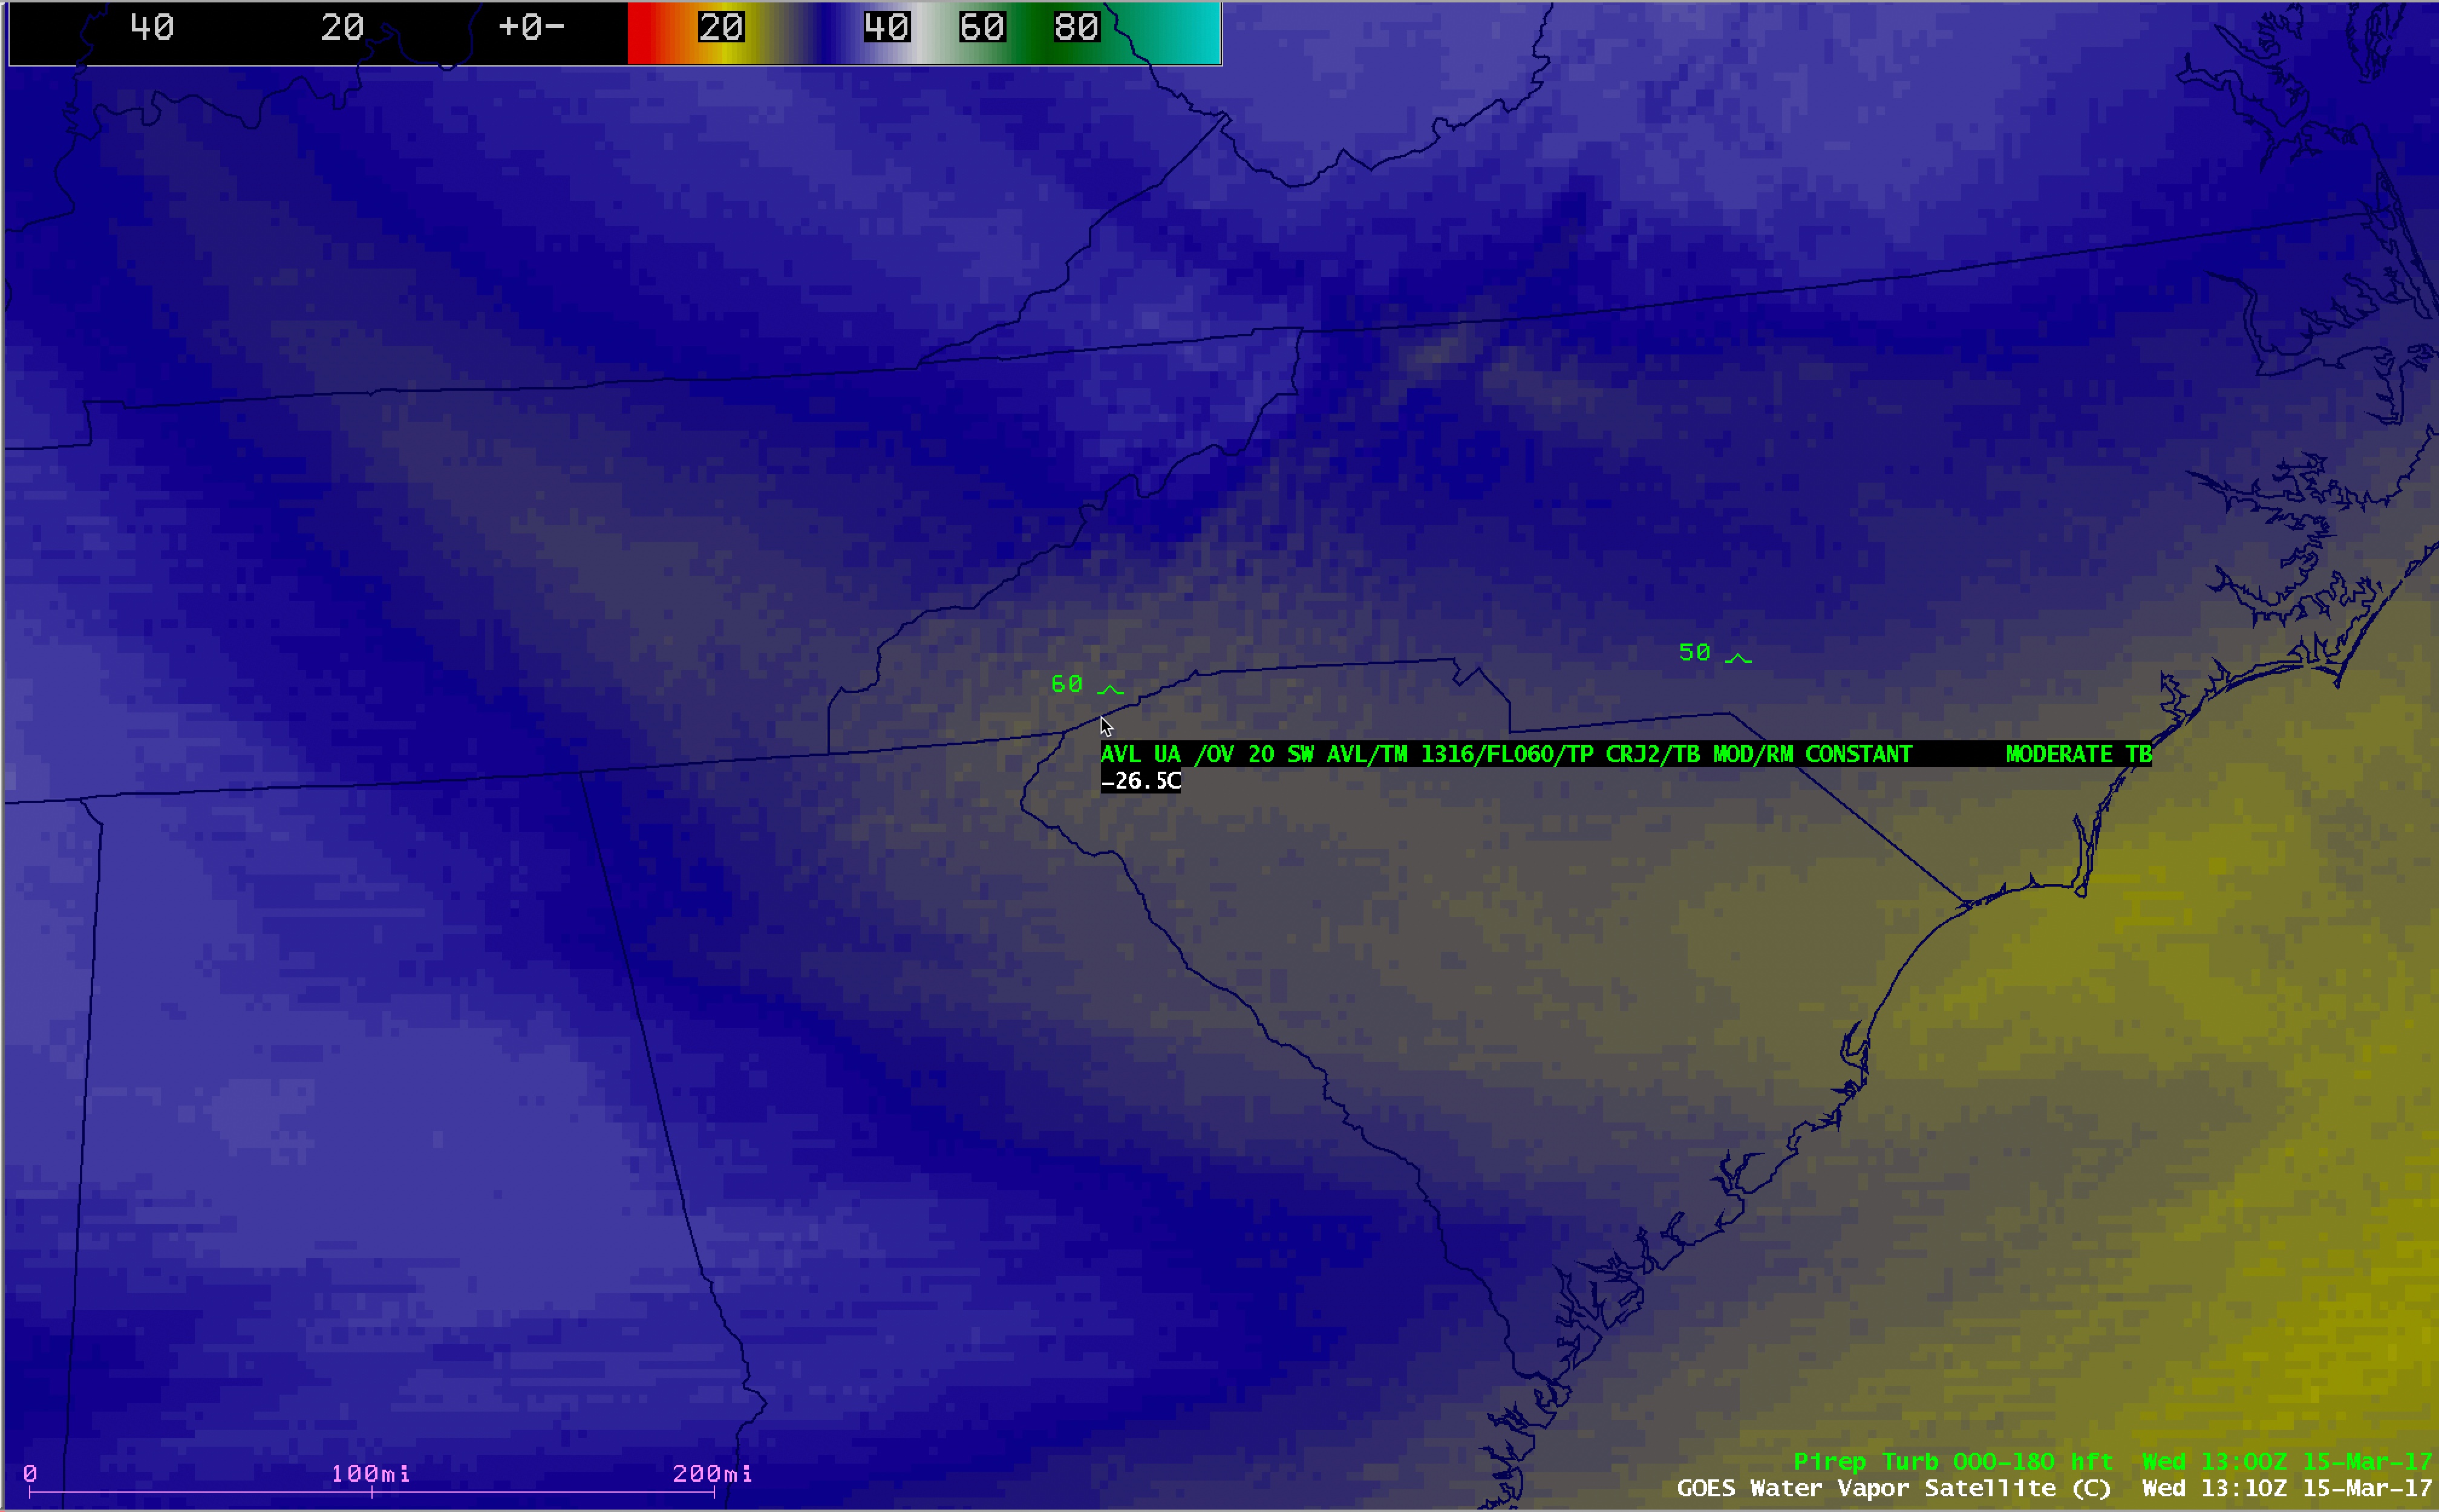
![GOES-13 Water Vapor (6.5 µm) image, with pilot report of turbulence [click to enlarge]](https://cimss.ssec.wisc.edu/satellite-blog/wp-content/uploads/sites/5/2017/03/170315_1400utc_goes13_water_vapor_pirep.jpeg)
