
A NOAA-18 AVHRR Infrared Window (10.8 µm) image (above) showed the signature of cold air (violet colors) settling into river valleys and other low-elevation terrain areas across the cloud-free interior of Alaska at 1916 UTC (10:16 am local time) on 18 January 2017. Note that there was a layer of... Read More
![NOAA-18 AVHRR Infrared Window (10.8 µm) image, with surface air temperatures and corresponding station identifications [click to enlarge]](https://cimss.ssec.wisc.edu/satellite-blog/wp-content/uploads/sites/5/2017/01/170118_1916utc_noaa18_avhrr_infrared_surface_air_temperatures_AK_large_anim.gif)
NOAA-18 AVHRR Infrared Window (10.8 µm) image, with surface air temperatures and corresponding station identifications [click to enlarge]
A NOAA-18 AVHRR Infrared Window (10.8 µm) image
(above) showed the signature of cold air
(violet colors) settling into river valleys and other low-elevation terrain areas across the cloud-free interior of Alaska at 1916 UTC (10:16 am local time) on 18 January 2017. Note that there was a layer of clouds
(warmer cyan colors) over much of the North Slope of Alaska; these clouds were acting to limit strong surface radiational cooling, with resulting surface air temperatures only as cold as the -20s F. This AVHRR image was about 1 hour before the low temperature at Fairbanks International Airport (PAFA) dropped to -51ºF (-46ºC) — the first low of -50ºF or colder at that location since 31 December 1999 (-53ºF). While these were certainly cold temperatures, in general most were several degrees warmer than the daily record lows for 18 January:
![NOAA-18 AVHRR Infrared Window (10.8 µm) image centered on Bettles (PABT), with surface air temperatures and corresponding station identifications [click to enlarge]](https://cimss.ssec.wisc.edu/satellite-blog/wp-content/uploads/sites/5/2017/01/170118_1916utc_noaa18_avhrr_infrared_surface_air_temperatures_AK_PABT_anim.gif)
NOAA-18 AVHRR Infrared Window (10.8 µm) image centered on Bettles (PABT), with surface air temperatures and corresponding station identifications [click to enlarge]
Closer views centered on Bettles
(above) and on Tanana
(below) further highlighted the influence of terrain on the pattern of surface infrared brightness temperatures.
![NOAA-18 AVHRR Infrared Window (10.8 µm) image centered on Tanana (PATA), with surface air temperatures and corresponding station identifications [click to enlarge]](https://cimss.ssec.wisc.edu/satellite-blog/wp-content/uploads/sites/5/2017/01/170118_1916utc_noaa18_avhrr_infrared_surface_air_temperatures_AK_PATA_anim.gif)
NOAA-18 AVHRR Infrared Window (10.8 µm) image centered on Tanana (PATA), with surface air temperatures and corresponding station identifications [click to enlarge]
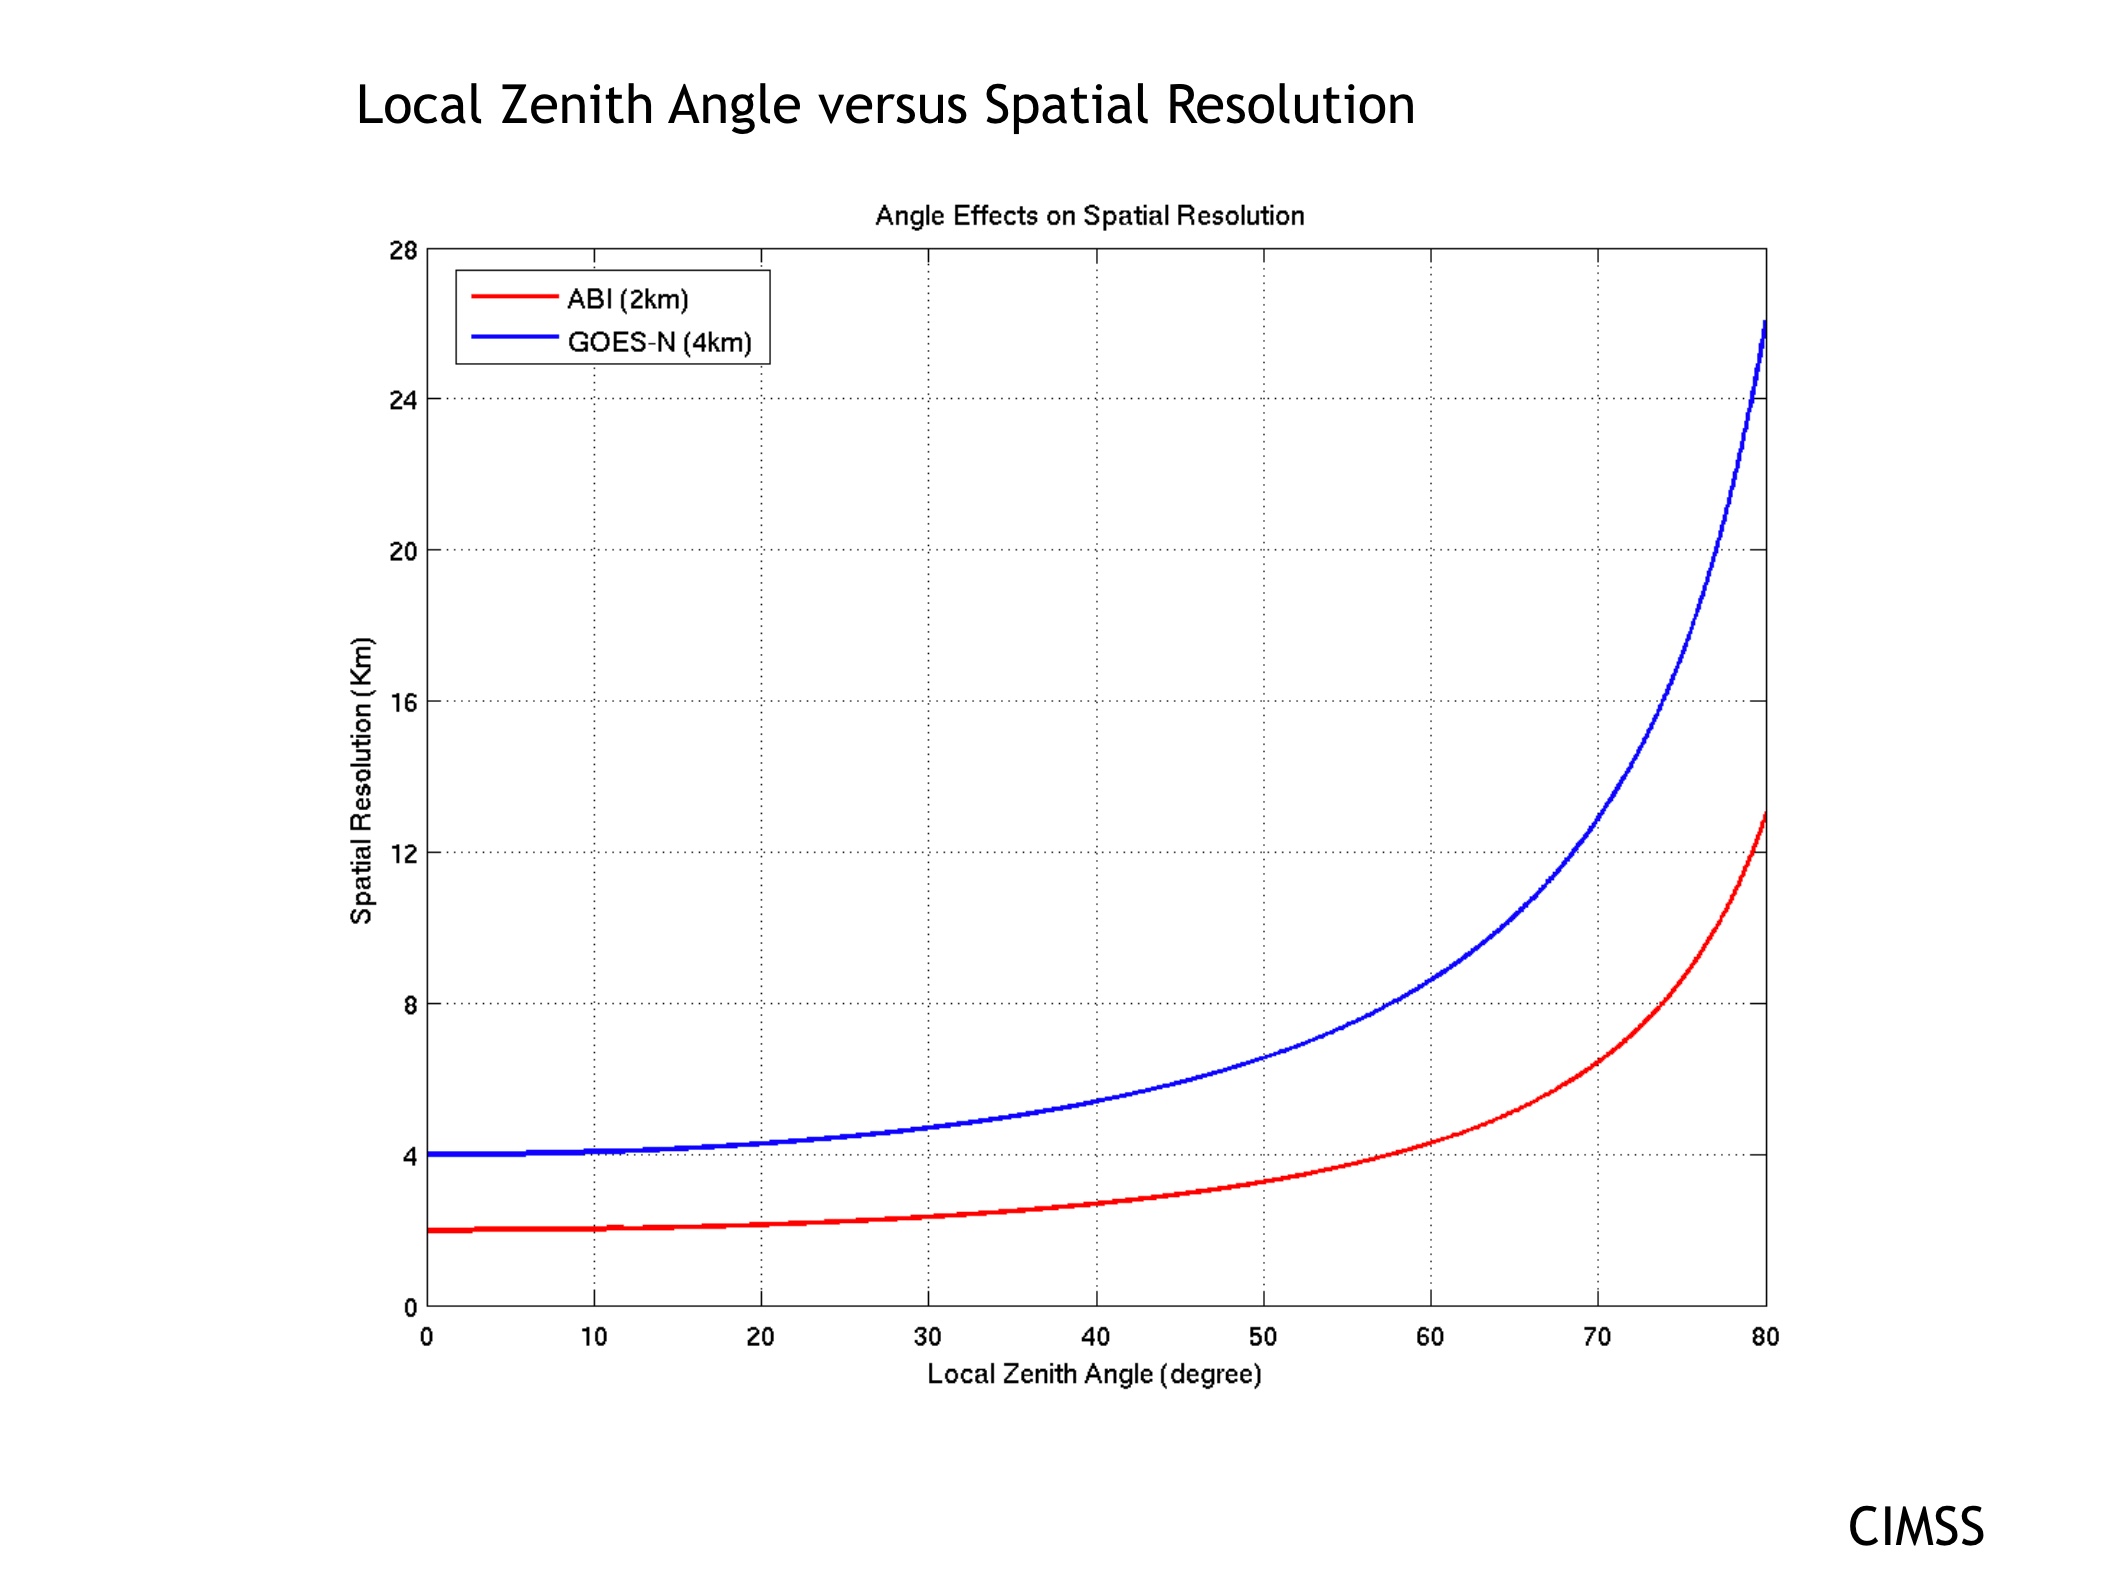
A comparison of re-mapped 1-km resolution NOAA-18 and “4-km” resolution GOES-15
(GOES-West) Infrared Window imagery
(below) demonstrated the spatial resolution advantage of “Low Earth Orbit” (Polar-orbiting) satellites over Geostationary satellites, especially for high-latitude regions such as Alaska. As
this plot shows, the true spatial resolution of a “4-km” GOES-15 Infrared image pixel over the interior of Alaska — where that satellite’s viewing angle or “zenith angle” from the Equator is about 74 degrees — is actually closer to 16 km. For the “2-km” Infrared imagery that will be provided by the
GOES-R series
ABI instrument, the spatial resolution over the interior of Alaska will be closer to 8 km.
![NOAA-18 vs GOES-15 Infrared Window images [click to enlarge]](https://cimss.ssec.wisc.edu/satellite-blog/wp-content/uploads/sites/5/2017/01/170118_0915utc_noaa18_goes15_infrared_Alaska_cold_anim.gif)
NOAA-18 vs GOES-15 Infrared Window images [click to enlarge]
=================================================================
![NOAA-19 AVHRR Infrared Window (10.8 µm) image, with surface air temperatures and corresponding station identifications [click to enlarge]](https://cimss.ssec.wisc.edu/satellite-blog/wp-content/uploads/sites/5/2017/01/170119_1518utc_noaa19_avhrr_infrared_surface_air_temperatures_AK_LARGE_anim.gif)
NOAA-19 AVHRR Infrared Window (10.8 µm) image, with surface air temperatures and corresponding station identifications [click to enlarge]
The cold continued across much of Alaska on 19 January, as seen on a NOAA-19 AVHRR Infrared Window (10.8 µm) image at 1519 UTC or 4:19 am local time
(above). However with a lack of cloud cover over the central portion of the North Slope, surface air temperatures were much colder (in the -40s F) compared to the -20s F that were seen there on the previous day.
NOAA-19 AVHRR Infrared Window (10.8 µm) image centered on Bettles (PABT), with surface air temperatures and corresponding station identifications [click to enlarge]
As was shown on the previous day, closer views centered on Bettles
(above) and on Tanana
(below) further highlighted the influence of terrain on the pattern of surface infrared brightness temperatures. On this day a layer of clouds
(highlighted by the warmer cyan colors) covered the far eastern portion of the Tanana image below — note that surface temperatures in the Fairbanks area beneath these clouds were only as cold as the -30s F. Farther to the west, which remained cloud-free, the minimum temperature at Tanana was -59ºF.
![NOAA-19 AVHRR Infrared Window (10.8 µm) images centered on Tanana (PATA), with surface air temperatures and corresponding station identifications [click to enlarge]](https://cimss.ssec.wisc.edu/satellite-blog/wp-content/uploads/sites/5/2017/01/170119_1518utc_noaa19_avhrr_infrared_surface_air_temperatures_AK_PATA_anim.gif)
NOAA-19 AVHRR Infrared Window (10.8 µm) images centered on Tanana (PATA), with surface air temperatures and corresponding station identifications [click to enlarge]
Time series plots of surface weather conditions at Fairbanks, Tanana and Bettles during the 18-19 January period are shown below. Note that the surface visibility was periodically restricted 1 statute mile or less, due to ice fog, at all 3 locations.
![Surface weather conditions at Fairbanks [click to enlarge]](https://cimss.ssec.wisc.edu/satellite-blog/wp-content/uploads/sites/5/2017/01/170118-19_PAFA_SFCMG.GIF)
Surface weather conditions at Fairbanks [click to enlarge]
![Surface weather conditions at Tanana [click to enlarge]](https://cimss.ssec.wisc.edu/satellite-blog/wp-content/uploads/sites/5/2017/01/170118-19_PATA_SFCMG.GIF)
Surface weather conditions at Tanana [click to enlarge]
![Surface weather conditions at Bettles [click to enlarge]](https://cimss.ssec.wisc.edu/satellite-blog/wp-content/uploads/sites/5/2017/01/170118-19_PABT_SFCMG.GIF)
Surface weather conditions at Bettles [click to enlarge]
View only this post
Read Less
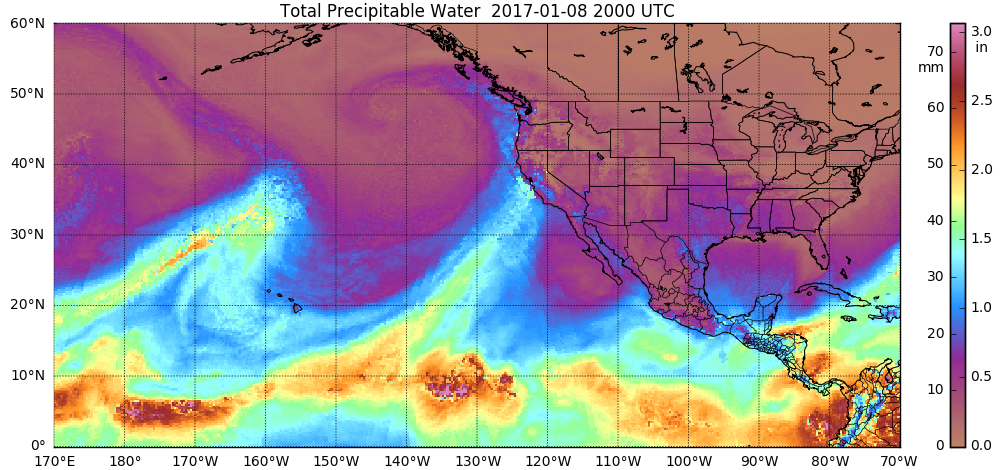
![MIMIC Total Precipatable Water product [click to play MP4 animation]](https://cimss.ssec.wisc.edu/satellite-blog/wp-content/uploads/sites/5/2017/01/comp20170108.200000_tpw.png)

![Terra MODIS true-color and false-color RGB images [click to enlarge]](https://cimss.ssec.wisc.edu/satellite-blog/wp-content/uploads/sites/5/2017/01/170113_modis_truecolor_falsecolor_Sacramento_Valley_CA_flooding_zoom_anim.gif)
![GOES-15 Infrared Window (10.7 µm) images, with hourly reports of surface weather type [click to play animation]](https://cimss.ssec.wisc.edu/satellite-blog/wp-content/uploads/sites/5/2017/01/170110-11_goes15_infrared_PDX_snow_event_anim.gif)
![GOES-15 Water Vapor (6.5 µm) images, with hourly reports of surface weather type [click to play animation]](https://cimss.ssec.wisc.edu/satellite-blog/wp-content/uploads/sites/5/2017/01/170110-11_goes15_water_vapor_PDX_snow_event_anim.gif)
![GOES-15 Visible (0.63 µm) images, with hourly reports of surface weather type [click to play animation]](https://cimss.ssec.wisc.edu/satellite-blog/wp-content/uploads/sites/5/2017/01/170110-11_goes15_visible_PDX_snow_event_anim.gif)
![Suomi NPP VIIRS true-color and false-color RGB images [click to enlarge]](https://cimss.ssec.wisc.edu/satellite-blog/wp-content/uploads/sites/5/2017/01/170112_2053utc_suomi_npp_viirs_truecolor_falsecolor_Portland_OR_snow_cover_anim.gif)
![Landsat-8 false-color RGB image [click to play zoom-in animation]](https://cimss.ssec.wisc.edu/satellite-blog/wp-content/uploads/sites/5/2017/01/170112_1851utc_landsat8_falsecolor_Mt_Hood_OR_anim.gif)

![GOES-15 Visible (0.63 µm) images, with hourly surface reports [click to play animation]](https://cimss.ssec.wisc.edu/satellite-blog/wp-content/uploads/sites/5/2017/01/170106_goes15_visible_Utah_black_cloud_anim.gif)
![GOES-13 Visible (0.63 µm) images, with hourly surface reports [click to play animation]](https://cimss.ssec.wisc.edu/satellite-blog/wp-content/uploads/sites/5/2017/01/170106_goes13_visible_Utah_black_cloud_anim.gif)
![Aqua MODIS Visible (0.645 µm) and Shortwave Infrared (3.7 µm) images at 2036 UTC [click to enlarge]](https://cimss.ssec.wisc.edu/satellite-blog/wp-content/uploads/sites/5/2017/01/170106_2036utc_aqua_modis_visible_shortwaveIR_IRwindow_UT_fire_anim_2.gif)
![Aqua MODIS true-color image at 2036 UTC [click to enlarge]](https://cimss.ssec.wisc.edu/satellite-blog/wp-content/uploads/sites/5/2017/01/170106_2036utc_aqua_modis_truecolor_Utah_well_fire_anim.gif)

/na2017_01_06_006_aqua.gif)