
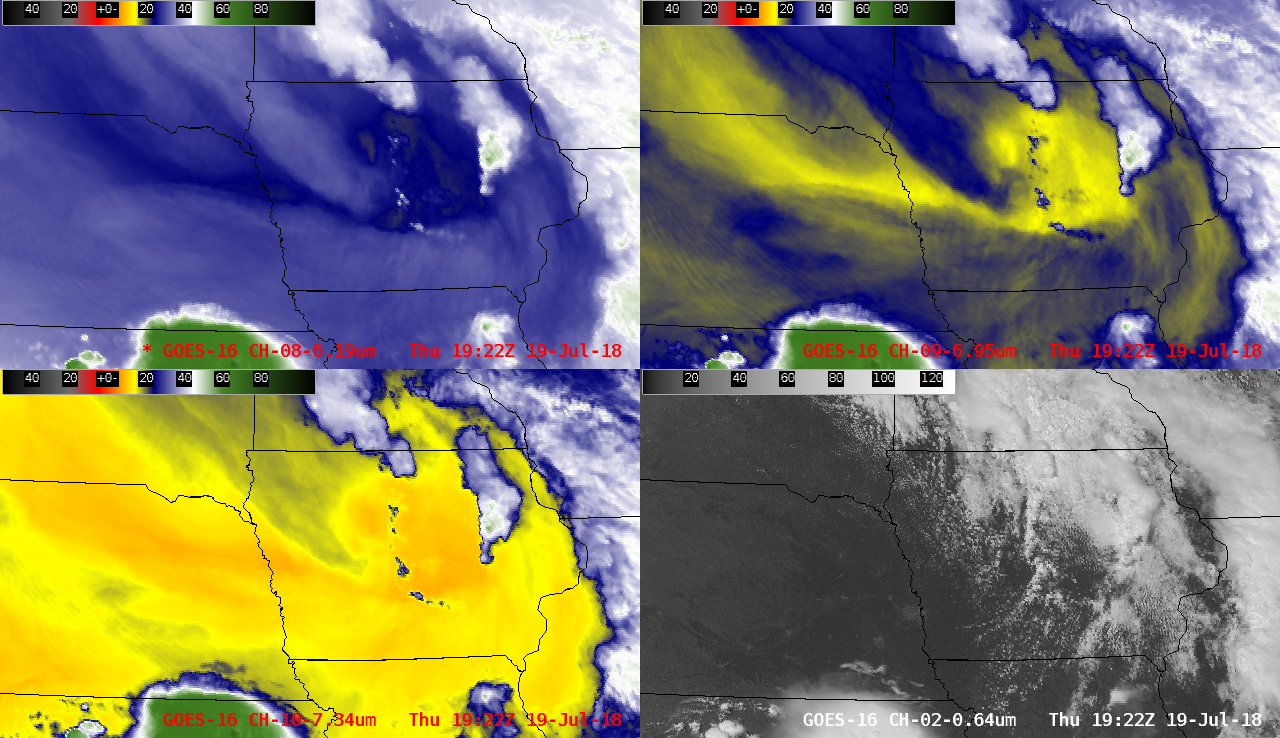
GOES-16 Upper-level Water Vapor (6.2 µm, top left), Mid-level Water Vapor (6.9 µm, top right), Low-level Water Vapor (7.3 µm, bottom left) and “Red” Visible (0.64 µm, bottom right) images [click to play MP4 animation]
GOES-16 “Red” Visible (0.64 µm) images, with SPC storm reports plotted in red [click to play MP4 animation]
The corresponding GOES-16 “Clean” Infrared Window (10.3 µm) images (below) showed cloud-top infrared brightness temperatures of -65ºC to -70ºC with the larger Pella storm, and around -55ºC with the smaller Marshalltown storm to the north.
GOES-16 “Clean” Infrared Window (10.3 µm) images, with SPC storm reports plotted in red [click to play MP4 animation]
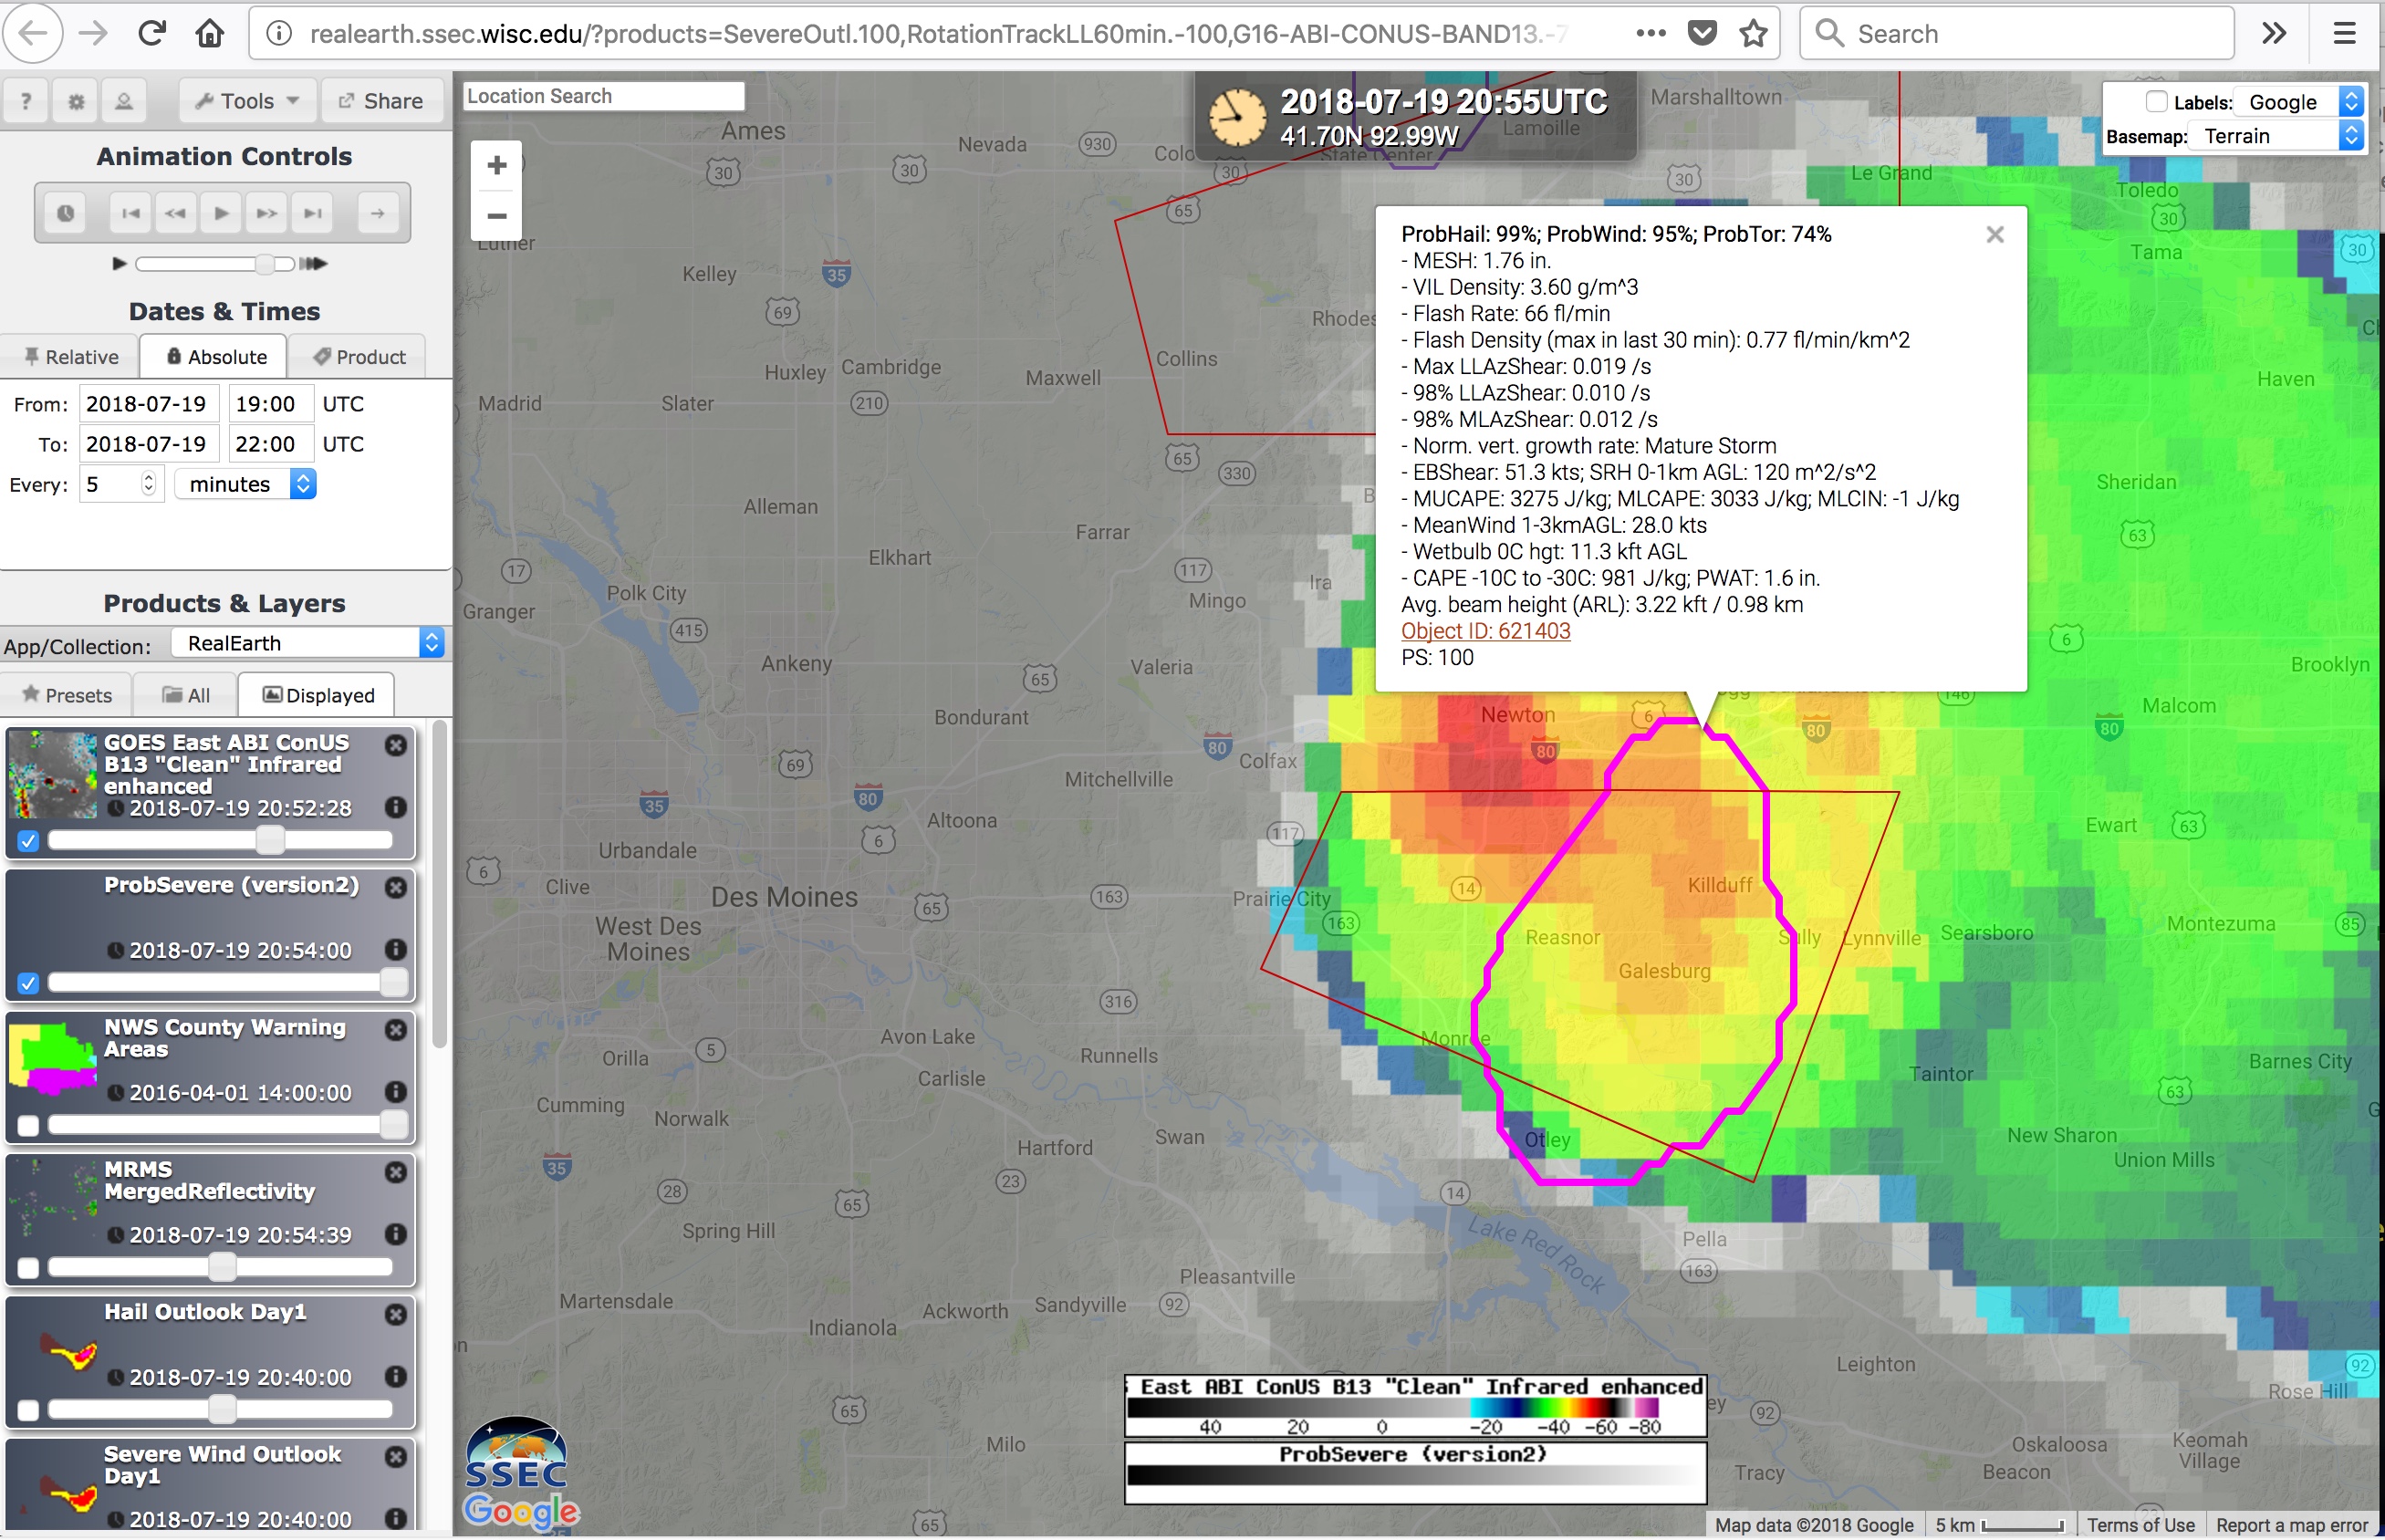
GOES-16 “Clean” Infrared Window (10.3 µm) image, with ProbSevere contour and parameters [click to enlarge]
![GOES-16 Infrared image, with ProbSevere parameters [click to enlarge]](https://cimss.ssec.wisc.edu/satellite-blog/wp-content/uploads/sites/5/2018/07/180719_2130utc_goes16_infrared_probsevere_Marshalltown_IA.jpeg)
GOES-16 “Clean” Infrared Window (10.3 µm) image, with ProbSevere contour and parameters [click to enlarge]
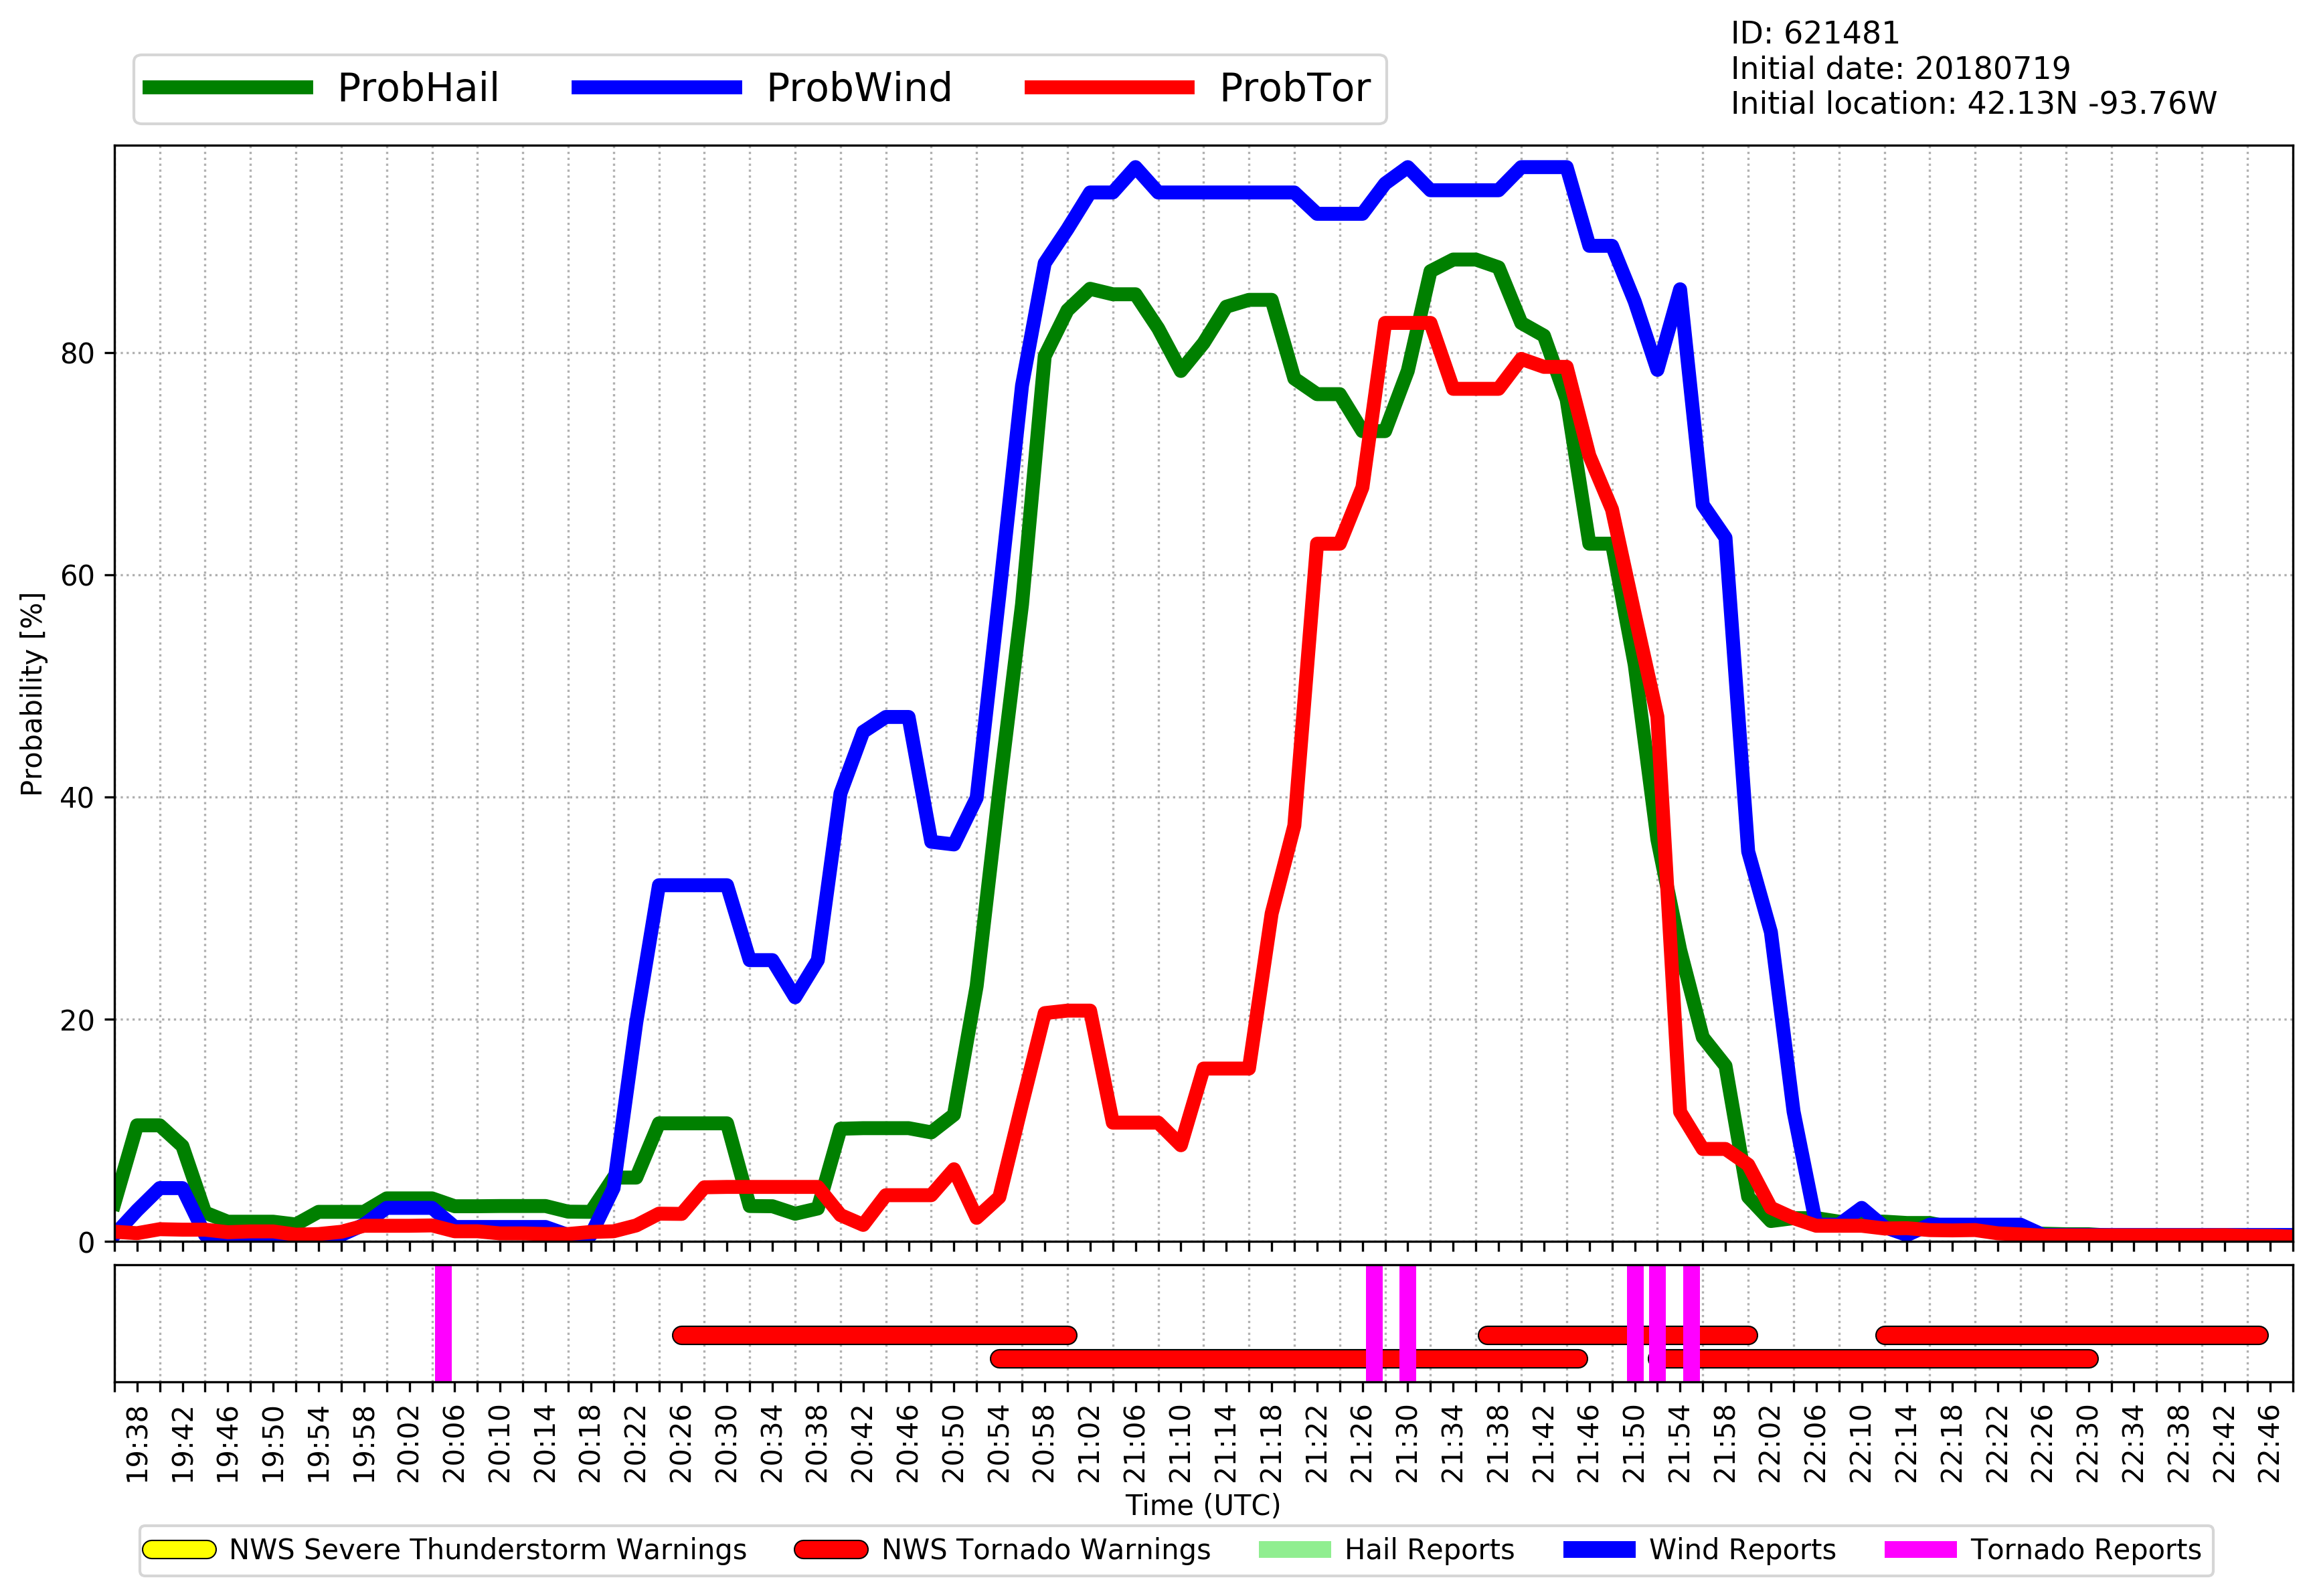
![NOAA/CIMSS ProbHail (Green), ProbWind (Blue) and ProbTor (Red) for the cell that produced the Pella IA tornado. [click to enlarge]](https://cimss.ssec.wisc.edu/satellite-blog/wp-content/uploads/sites/5/2018/07/180719_probsevere_Pella_IA.png)
NOAA/CIMSS ProbHail (Green), ProbWind (Blue) and ProbTor (Red) for the cell that produced the Pella IA tornado [click to enlarge]
NOAA/CIMSS ProbHail (Green), ProbWind (Blue) and ProbTor (Red) for the cell that produced the Marshalltown IA tornado [click to enlarge]
![Suomi NPP VIIRS Visible (0.64 µm) and Infrared Window (11.45 µm) images, with plots of SPC tornado reports within +/- 30 minutes of the images [click to enlarge]](https://cimss.ssec.wisc.edu/satellite-blog/wp-content/uploads/sites/5/2018/07/180719_1946utc_suomi_npp_viirs_visible_infrared_spc_storm_reports_IA_anim.gif)
Suomi NPP VIIRS Visible (0.64 µm) and Infrared Window (11.45 µm) images, with plots of SPC tornado reports within +/- 30 minutes of the images [click to enlarge]
The EF-3 damage at the Vermeer Plant in Pella. Preliminary estimated peak winds of 144 mph and a max tornado width of 400 yards. Tornado end time and path length still TBD. #iawx pic.twitter.com/aMMmhdn21N
— NWS Des Moines (@NWSDesMoines) July 21, 2018
Preliminary damage survey…Lennox Warehouse in Marshalltown where the EF-3 damage occurred caused by 144 mph estimated peak winds. #iawx pic.twitter.com/egcNJqBSOE
— NWS Des Moines (@NWSDesMoines) July 21, 2018
As of 4:09 CDT, a tornado debris signature was about 3 miles NE of Pella, IA moving southeast. Radar and webcam shot from @akrherz. #iawx pic.twitter.com/y8erooTml7
— U.S. Tornadoes (@USTornadoes) July 19, 2018
Tornado Emergency for Marshalltown, IA. A damaging tornado is now making it’s way through Marshalltown. Debris from the tornado is being seen by the radar up to 11,000 ft. Indicating a strong tornado is ongoing! #iawx pic.twitter.com/2eKqFlpe2N
— U.S. Tornadoes (@USTornadoes) July 19, 2018
View only this post Read Less
![Visible images from GOES-15 (0.63 µm, left), GOES-17 (0.64 µm, center) and GOES-16 (0.64 µm, right) [click to play animation | MP4]](https://cimss.ssec.wisc.edu/satellite-blog/wp-content/uploads/sites/5/2018/07/180717_goes15_goes17_goes16_visible_PacNW_anim.gif)
![Visible images from GOES-15 (0.63 µm, left), GOES-17 (0.64 µm, center) and GOES-16 (0.64 µm, right) [click to play animation | MP4]](https://cimss.ssec.wisc.edu/satellite-blog/wp-content/uploads/sites/5/2018/07/180717_goes15_goes17_goes16_visible_Montana_convection_anim.gif)
![Visible images from GOES-15 (0.63 µm, left), GOES-17 (0.64 µm, center) and GOES-16 (0.64 µm, right) [click to play animation | MP4]](https://cimss.ssec.wisc.edu/satellite-blog/wp-content/uploads/sites/5/2018/07/180717_goes15_goes17_goes16_visible_CO_severe_anim.gif)
![Visible images from GOES-15 (0.63 µm, left), GOES-17 (0.64 µm, center) and GOES-16 (0.64 µm, right) [click to play animation]](https://cimss.ssec.wisc.edu/satellite-blog/wp-content/uploads/sites/5/2018/07/180715_goes15_goes17_goes16_visible_Ferguson_Fire_CA_pyrocb_anim.gif)
![NOAA-19 Visible (0.63 µm), Shortwave Infrared (3.7 µm) and Infrared Window (10.8 µm) images [click to enlarge]](https://cimss.ssec.wisc.edu/satellite-blog/wp-content/uploads/sites/5/2018/07/180715_2327utc_noaa19_visible_shortwaveIR_IRwindow_Ferguson_Fire_CA_pyrocb_anim.gif)
![Time lapse [click to play YouTube video]](https://cimss.ssec.wisc.edu/satellite-blog/wp-content/uploads/sites/5/2018/07/180715_Ferguson_Fire_time_lapse_capture.jpeg)
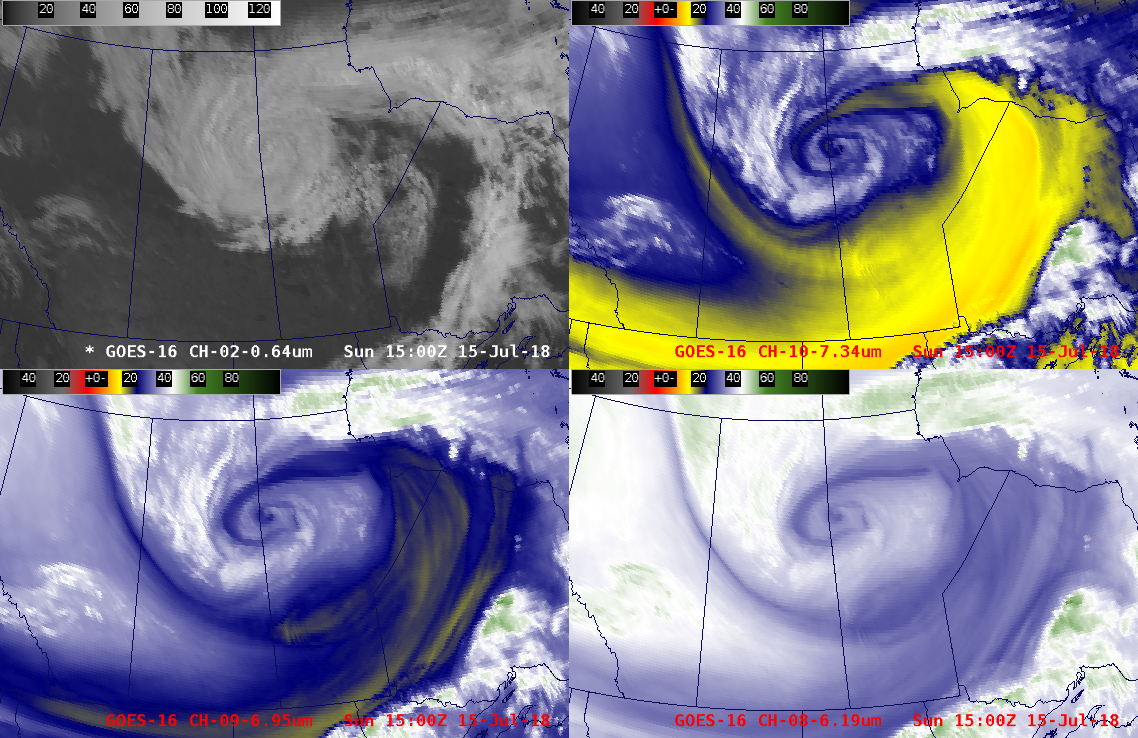
![GOES-16 "Red" Visible (0.64 µm, upper left), Low-level Water Vapor (7.3 µm, upper right), Mid-level Water Vapor (6.9 µm, lower left) and Upper-level Water Vapor (6.2 µm, lower right) images [click to play animation]](https://cimss.ssec.wisc.edu/satellite-blog/wp-content/uploads/sites/5/2018/07/180715_goes16_visible_water_vapor_Canada_cyclone_zoom_anim.gif)
![NOAA-20 VIIRS True Color RGB image [click to enlarge]](https://cimss.ssec.wisc.edu/satellite-blog/wp-content/uploads/sites/5/2018/07/180715_1827utc_noaa20_truecolor.jpg)
