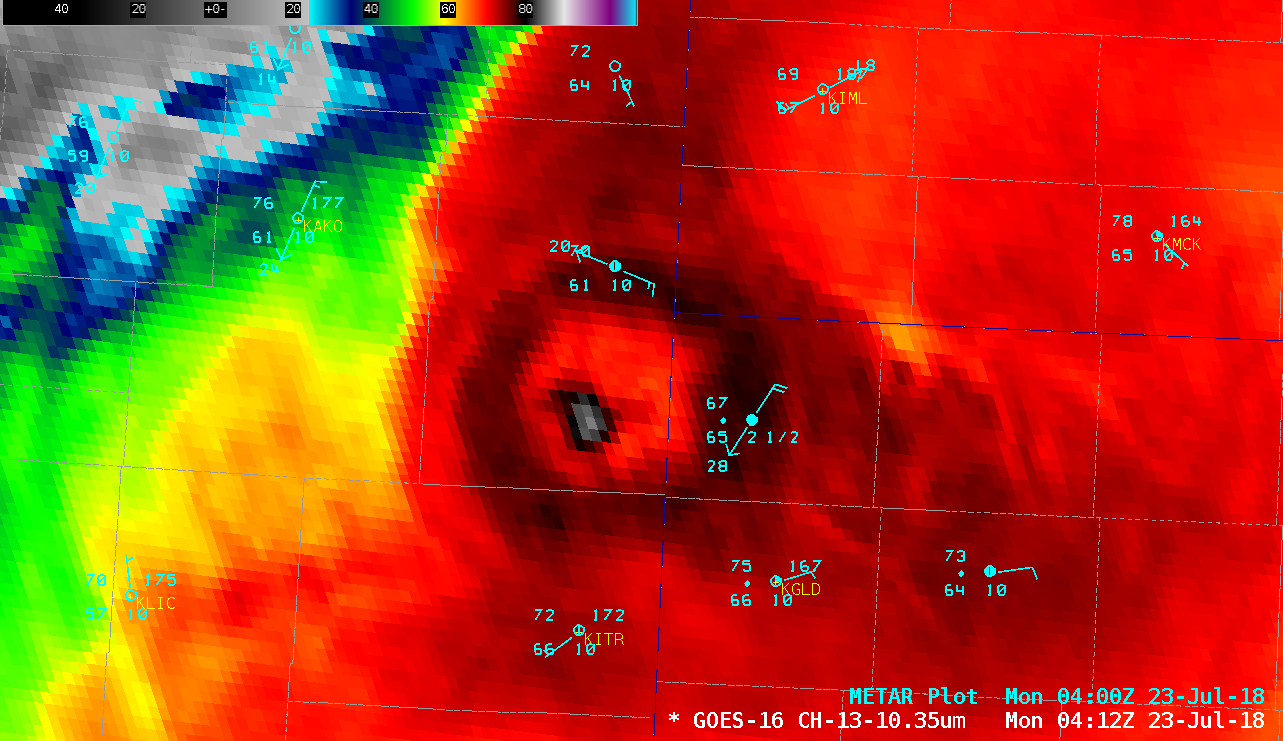
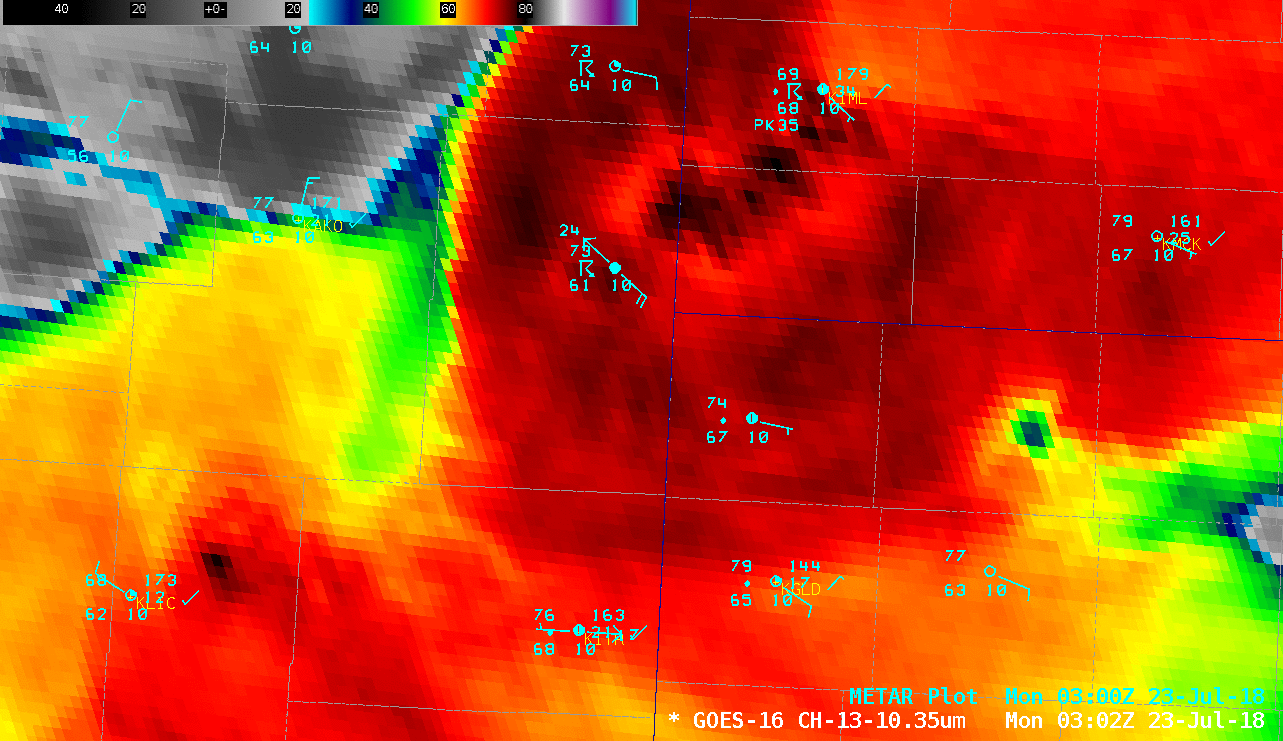
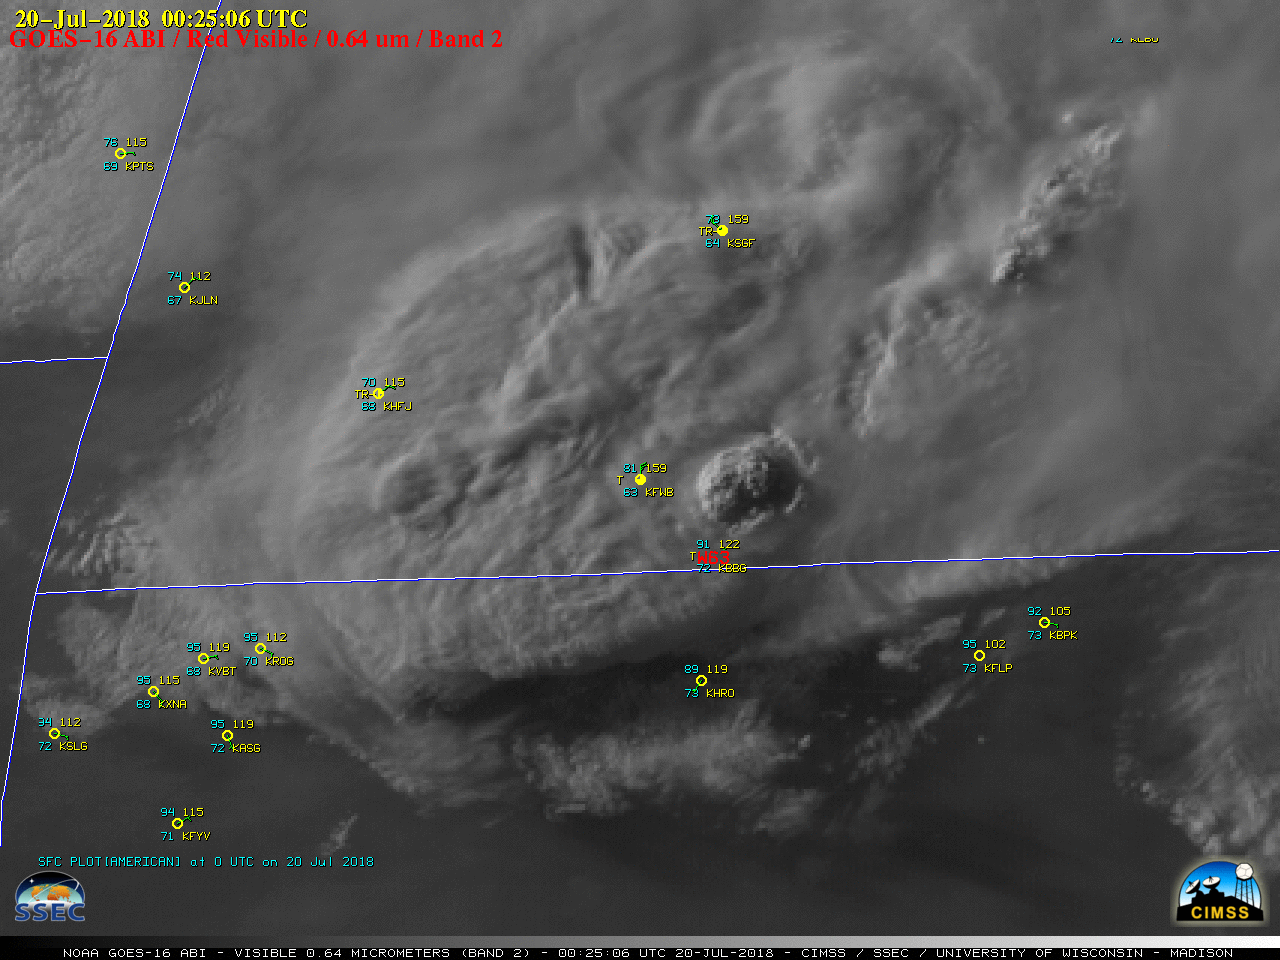
GOES-16 “Clean” Infrared Window (10.3 µm) images (above) revealed a well-defined “warm trench” signature (ring of brighter red enhancement) surrounding the cold overshooting top (cluster of pixels enhanced as black to lighter shades of gray) of a thunderstorm in far eastern Colorado during the nighttime hours on 22 July 2018. This warm trench... Read More

GOES-16 “Clean” Infrared Window (10.3 µm) images, with plots of surface reports [click to play animation | MP4]
GOES-16 “Clean” Infrared Window (
10.3 µm) images
(above) revealed a well-defined “warm trench” signature
(ring of brighter red enhancement) surrounding the cold overshooting top
(cluster of pixels enhanced as black to lighter shades of gray) of a thunderstorm in far eastern Colorado during the nighttime hours on
22 July 2018. This warm trench appears to be a ring of compensating subsidence immediately surrounding the vigorous overshooting top; the cold/warm
(overshooting_top/warm_trench) “delta-T” on the
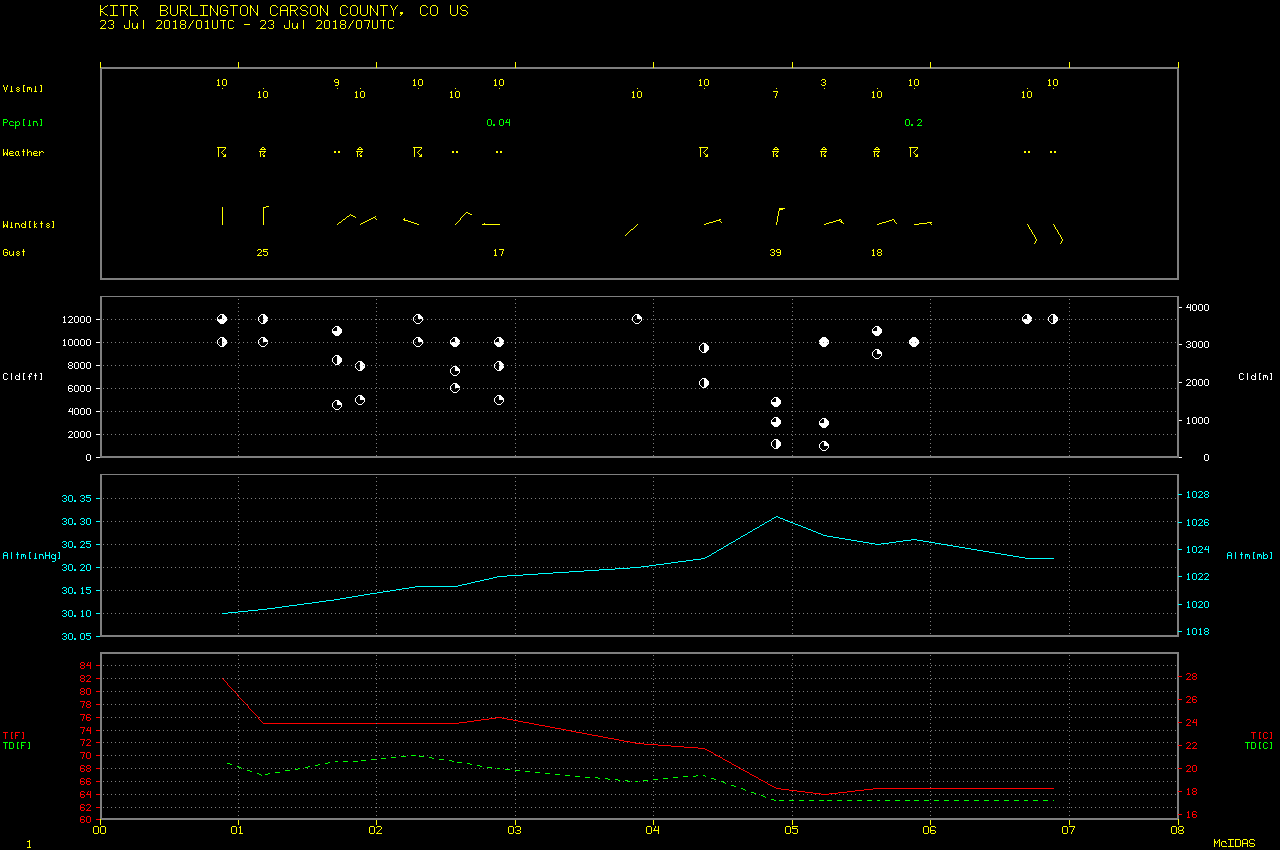
0412 UTC image was 16.4ºC (-85.5ºC / -67.1ºC). Just to the south, at 0453 UTC there was a northerly peak wind gust to 45 knots or 52 mph at KITR (Burlington Colorado:
plot |
text) as the updraft supporting the overshooting top collapsed — but no other
SPC storm reports were seen in that area.
A 250-meter resolution Terra MODIS Infrared Window (11.0 µm) imageat 0402 UTC (below) with a slightly different color enhancement showed similar delta-T values (-81ºC/-67ºC) with the overshooting top / warm trench. The diameter of the warm trench was approximately 30-40 miles.
![Terra MODIS Infrared Window (11.0 µm) image, with plots of surface reports [click to enlarge]](https://cimss.ssec.wisc.edu/satellite-blog/wp-content/uploads/sites/5/2018/07/MODIS_IR_20180723_0402.png)
Terra MODIS Infrared Window (11.0 µm) image, with plots of surface reports [click to enlarge]
A plot of 00 UTC rawinsonde data from North Platte, Nebraska
(below) showed a tropopause temperature of -73ºC at an altitude of 15.7 km or 51,500 feet — so the much colder infrared brightness temperatures seen on GOES and MODIS imagery were indicative of a very robust overshooting top that penetrated the tropopause a significant distance.
![Plot of 00 UTC rawinsonde data from North Platte, Nebraska [click to enlarge]](https://cimss.ssec.wisc.edu/satellite-blog/wp-content/uploads/sites/5/2018/07/180723_00UTC_KLBF_RAOB.GIF)
Plot of 00 UTC rawinsonde data from North Platte, Nebraska [click to enlarge]
The GOES-16 Cloud Top Height product at 0412 UTC
(below) indicated values of 54,000 ft / 49,000 ft for the cold overshooting top / warm trench features — however, note that the resolution of this
infrared-derived product is 10 km (and the accuracy is within 1500 feet).
![GOES-16 Cloud Top Height derived product at 0412 UTC [click to enlarge]](https://cimss.ssec.wisc.edu/satellite-blog/wp-content/uploads/sites/5/2018/07/CO_cth-20180723_041229.png)
GOES-16 Cloud Top Height derived product at 0412 UTC [click to enlarge]
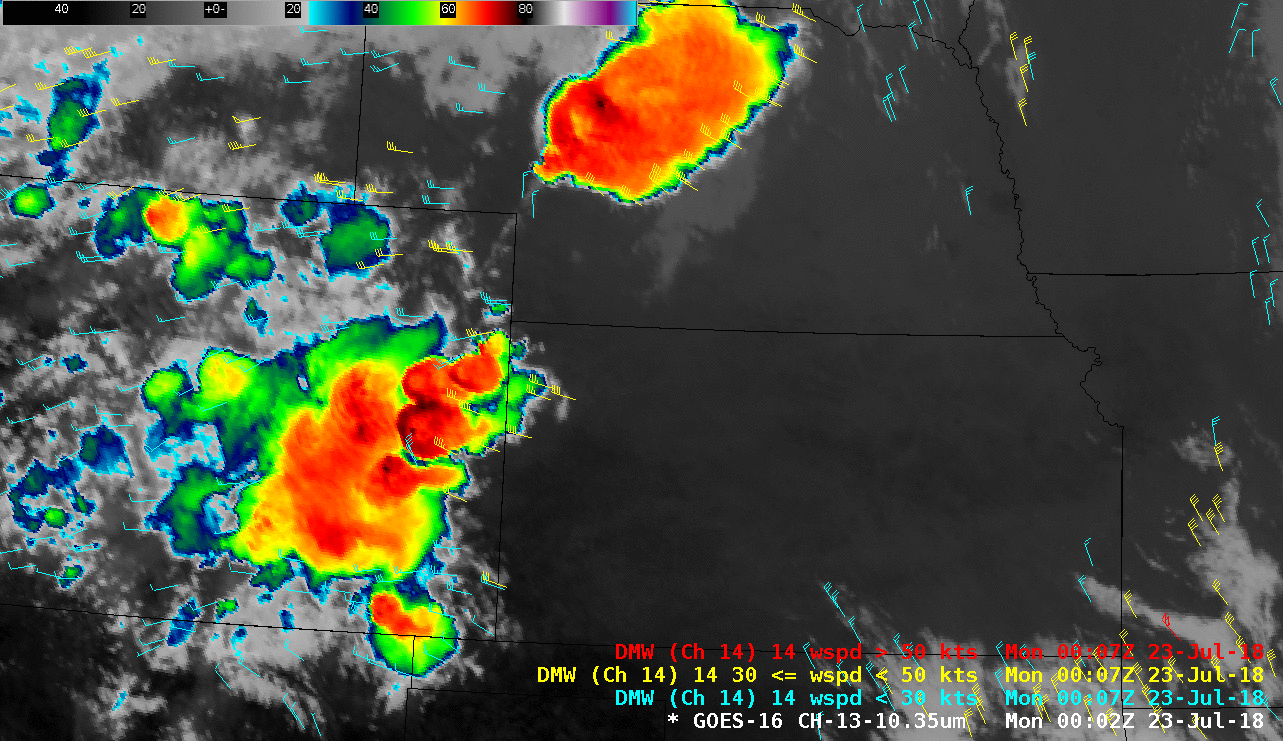
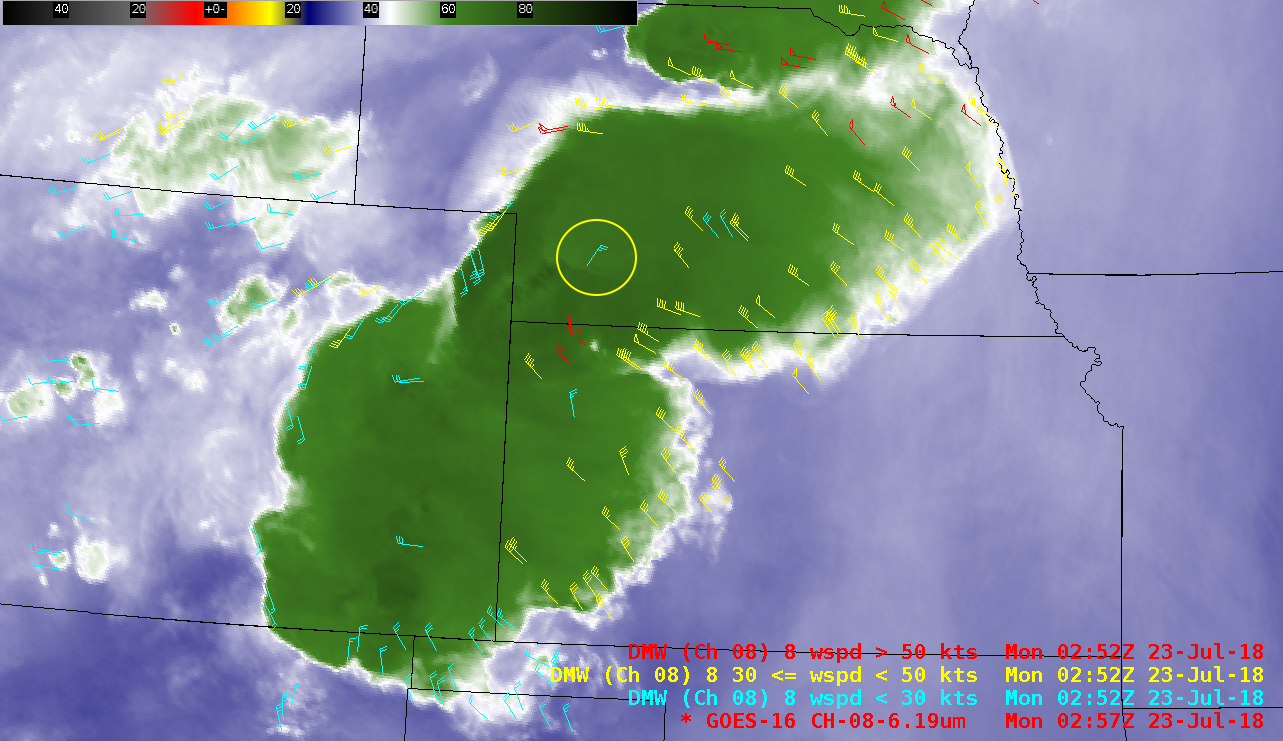
Another interesting (and yet-to-be-explained) feature was an arc of
warming cloud-top infrared brightness temperatures that was seen propagating southwestward toward the overshooting top / warm trench signature. A larger-scale view
(below) showed this wave feature moving from southwestern Nebraska at around 02 UTC to southern Colorado/Kansas by 10 UTC.

GOES-16 “Clean” Infrared Window (10.3 µm) images, with 11.2 µm infrared Derived Motion Winds [click to play animation | MP4]
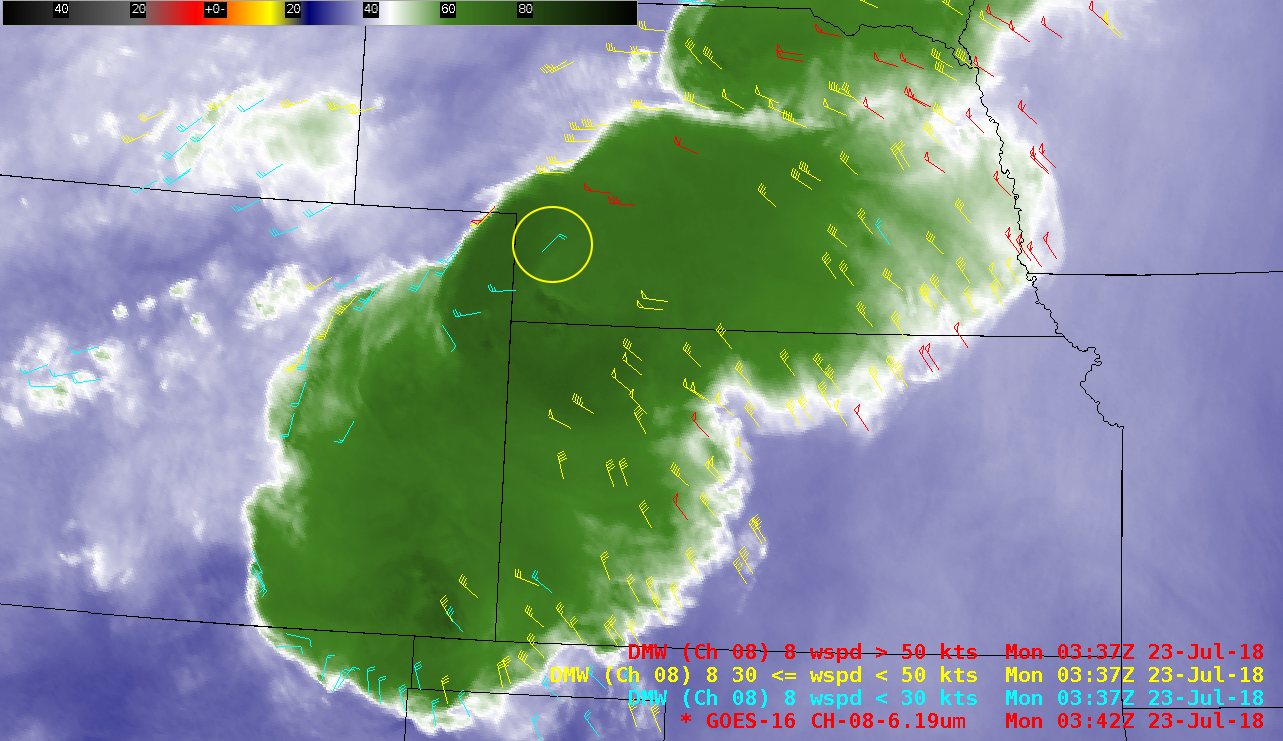
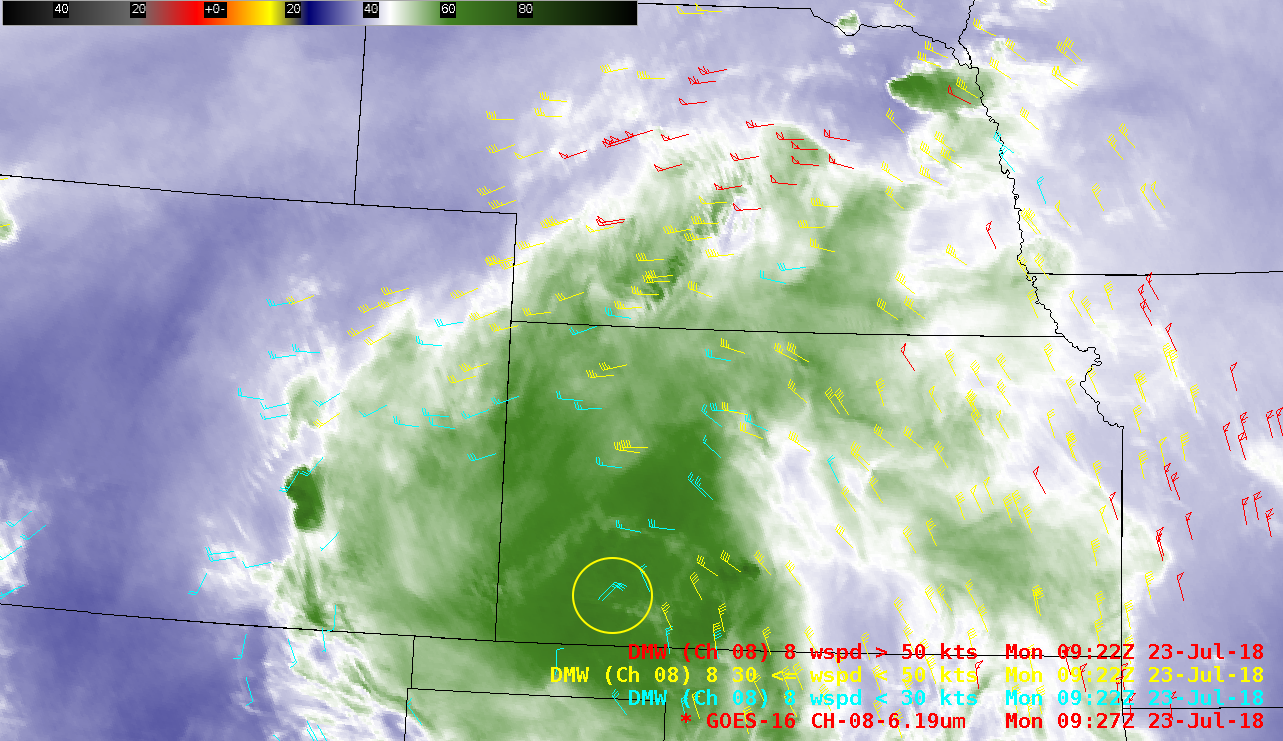
This cloud-top wave feature was also apparent on GOES-16 Upper-level Water Vapor (
6.2 µm) images
(below) — at times the wave was tracked by Derived Motion Winds at speeds of 20-30 knots (
0252 UTC |
0337 UTC |
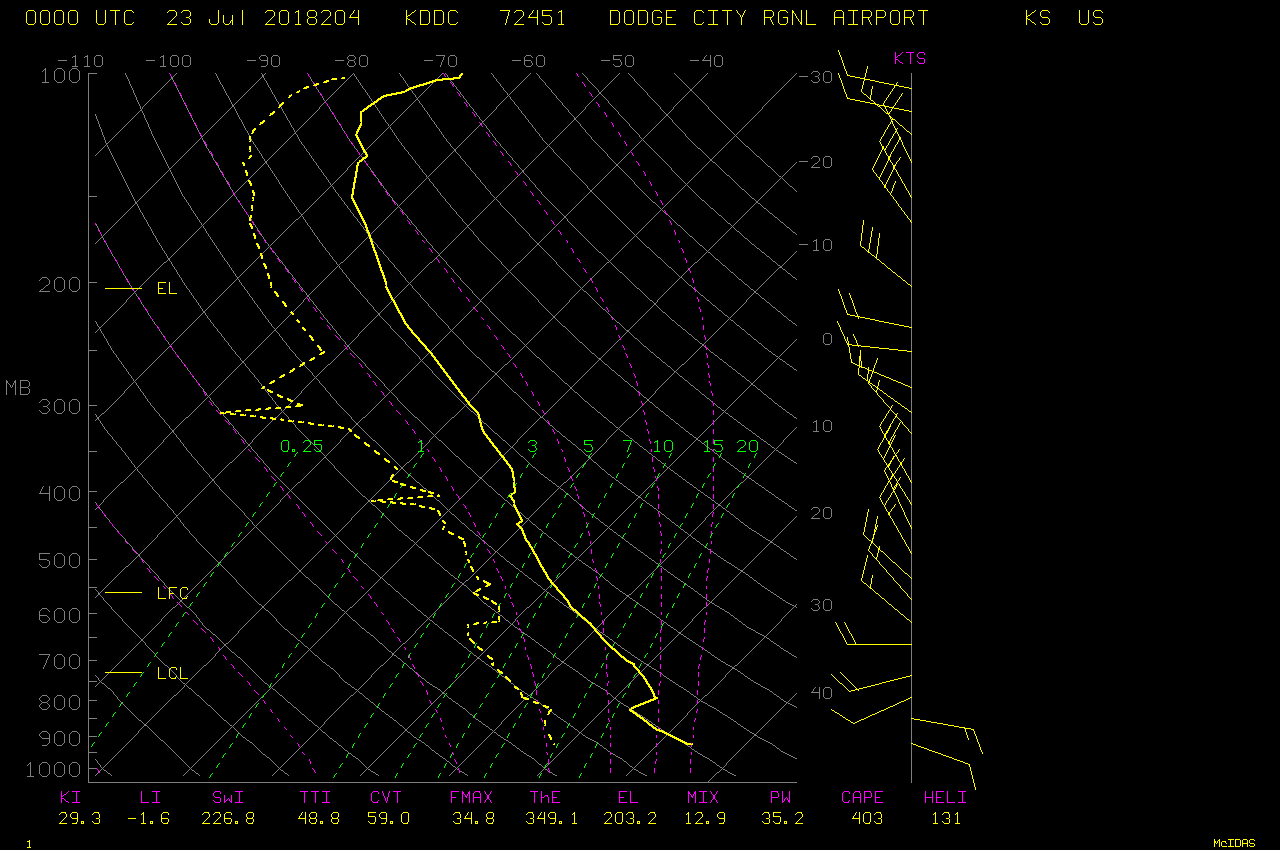
0922 UTC). According to rawinsonde data from Dodge City, Kansas (
plot |
data) as well as North Platte, winds with a northerly to easterly component were only found at altitudes of 20 km or higher!
![GOES-16 Upper-level Water Vapor (6.2 µm) images, with 6.2 µm water vapor Derived Motion Winds [click to play animation | MP4]](https://cimss.ssec.wisc.edu/satellite-blog/wp-content/uploads/sites/5/2018/07/CO_wv_dmw-20180723_025229.png)
GOES-16 Upper-level Water Vapor (6.2 µm) images, with 6.2 µm water vapor Derived Motion Winds [click to play animation | MP4]
Special thanks to
NWS Grand Rapids forecasters Brett Borchardt and TJ Turnage for bringing this case to our attention!
View only this post
Read Less
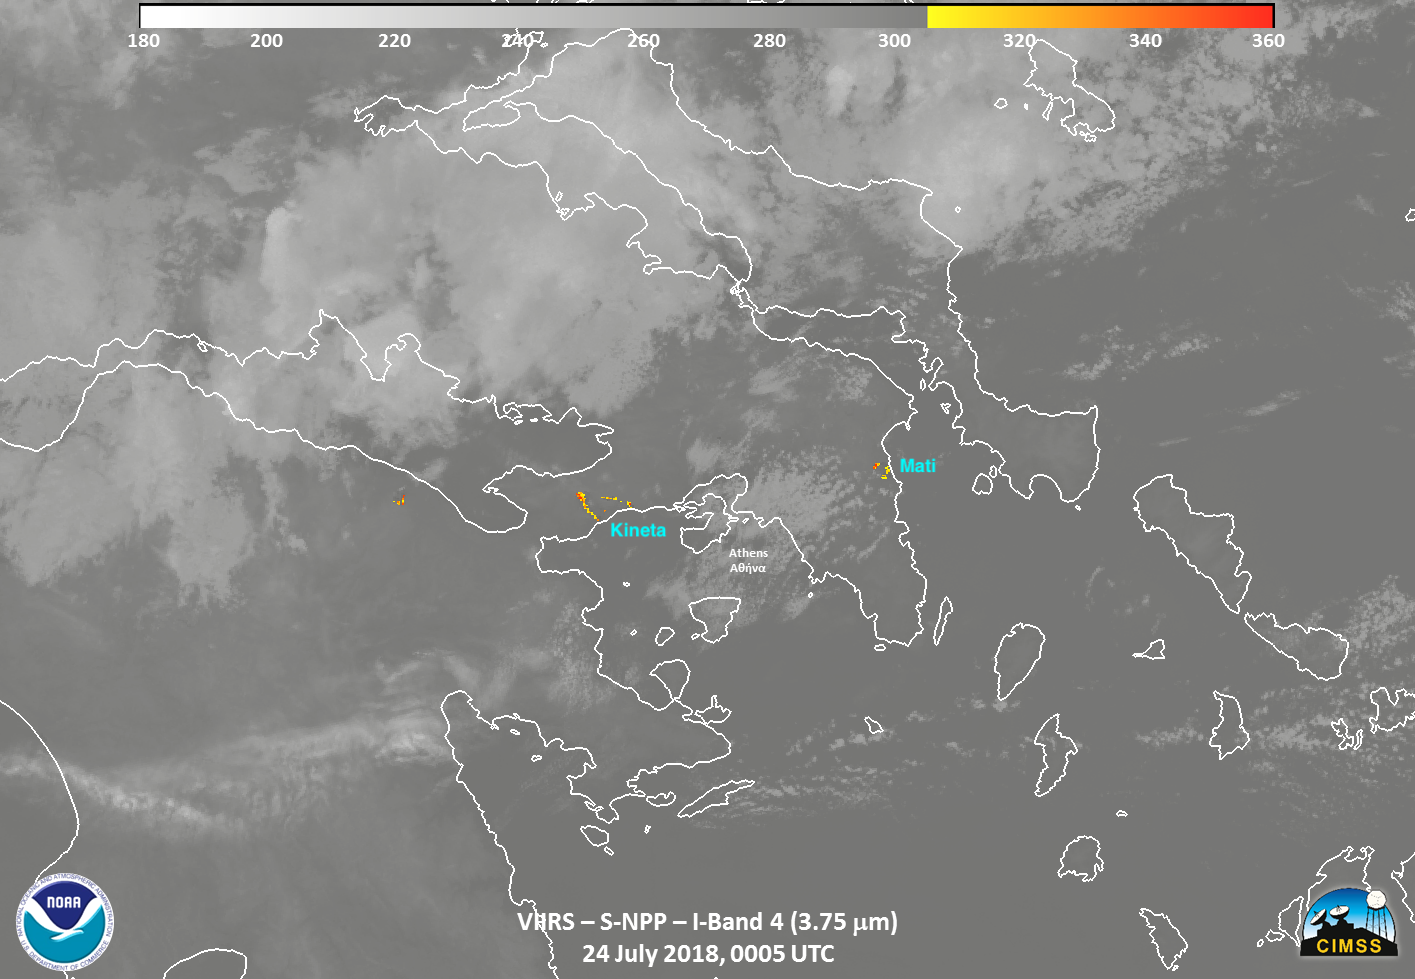
![Suomi NPP VIIRS Shortwave Infrared (3.75 µm), Near-Infrared (1.61 and 2.25 µm) and Day/Night Band (0.7 µm) images [click to enlarge]](https://cimss.ssec.wisc.edu/satellite-blog/wp-content/uploads/sites/5/2018/07/180724_0005utc_suomi_npp_viirs_Athens_Greece_fires_anim.gif)
![NOAA-20 Shortwave Infrared (3.75 µm), Near-Infrared (1.61 and 2.25 µm) and Day/Night Band (0.7 µm) images [click to enlarge]](https://cimss.ssec.wisc.edu/satellite-blog/wp-content/uploads/sites/5/2018/07/180724_0055utc_noaa20_viirs_Athens_Greece_fires_anim.gif)
![Time series of surface observations at Athens, Greece [click to enlarge]](https://cimss.ssec.wisc.edu/satellite-blog/wp-content/uploads/sites/5/2018/07/180723_LGAV_SFCMG.GIF)
![GOES-16 Upper-level Water Vapor (6.2 µm) images, with 6.2 µm water vapor Derived Motion Winds [click to play animation | MP4]](https://cimss.ssec.wisc.edu/satellite-blog/wp-content/uploads/sites/5/2018/07/180723_goes16_waterVapor_derivedMotionWinds_CO_warm_trench_awips_anim.gif)
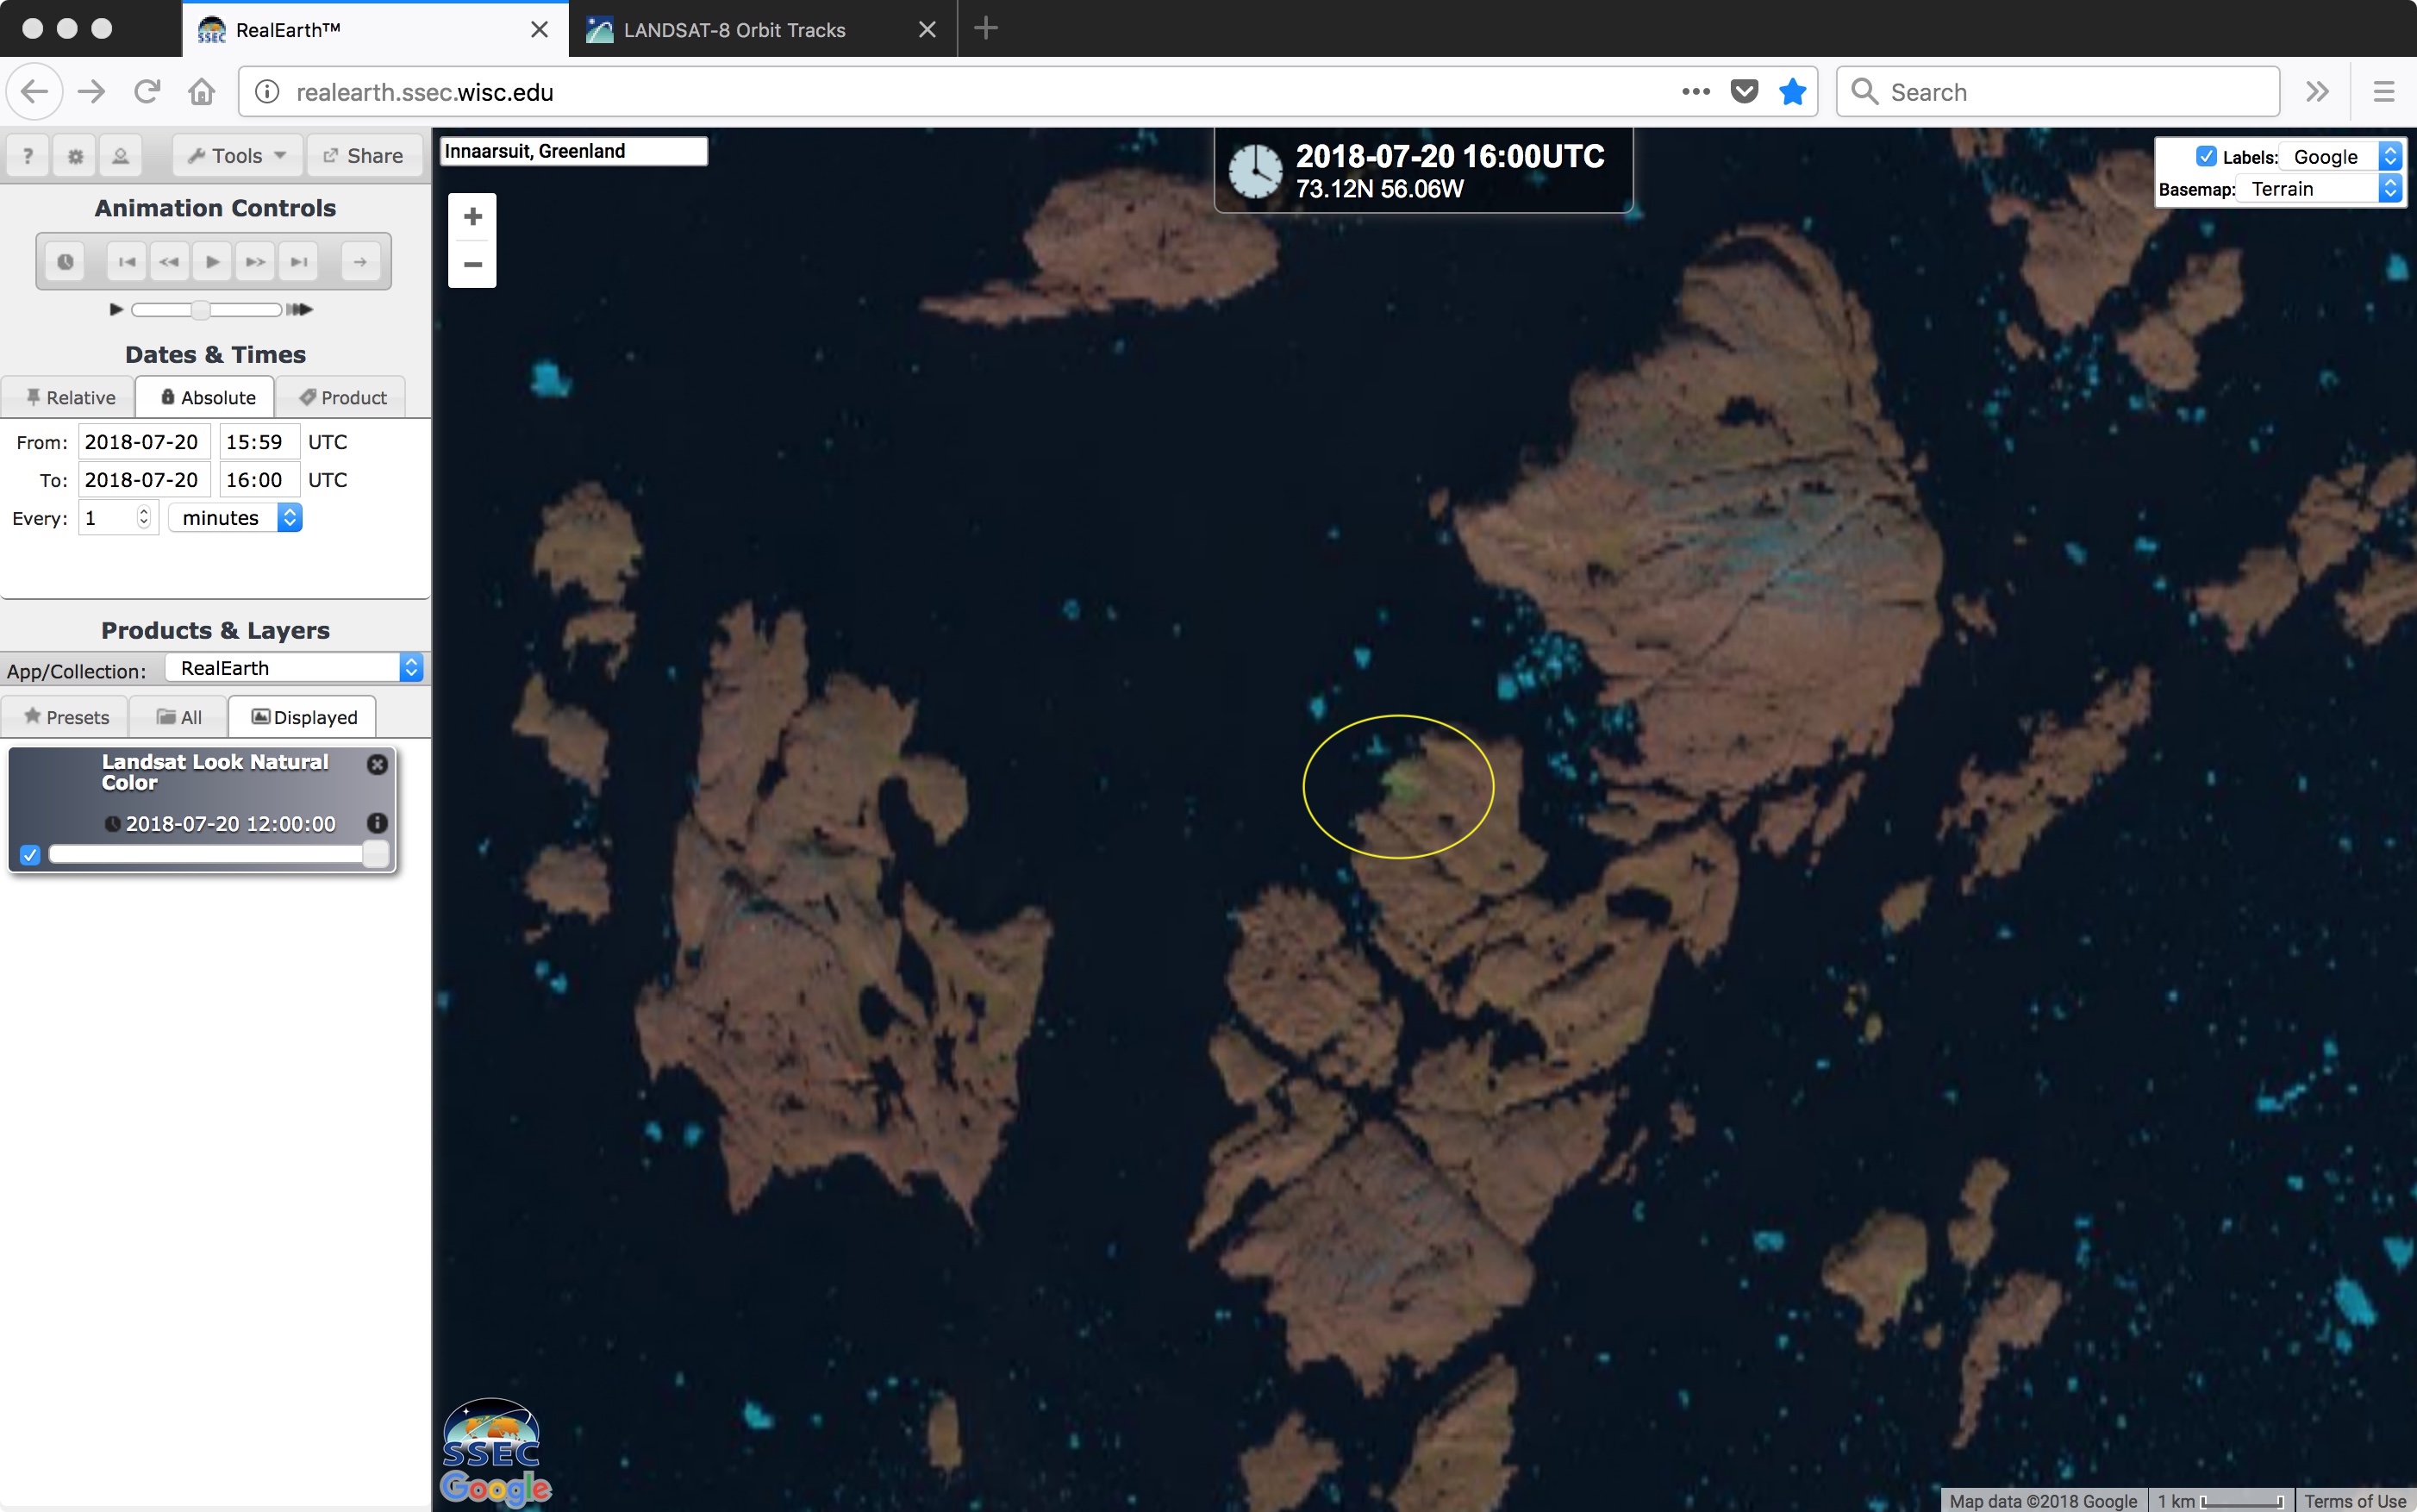
![Landsat-8 False Color RGB image swaths, zoomed in to show the iceberg near Innaarsuit, Greenland [click to enlarge]](https://cimss.ssec.wisc.edu/satellite-blog/wp-content/uploads/sites/5/2018/07/180720_1600utc_landsat8_falsecolor_Innaarsuit_Greenland_iceberg_anim.gif)

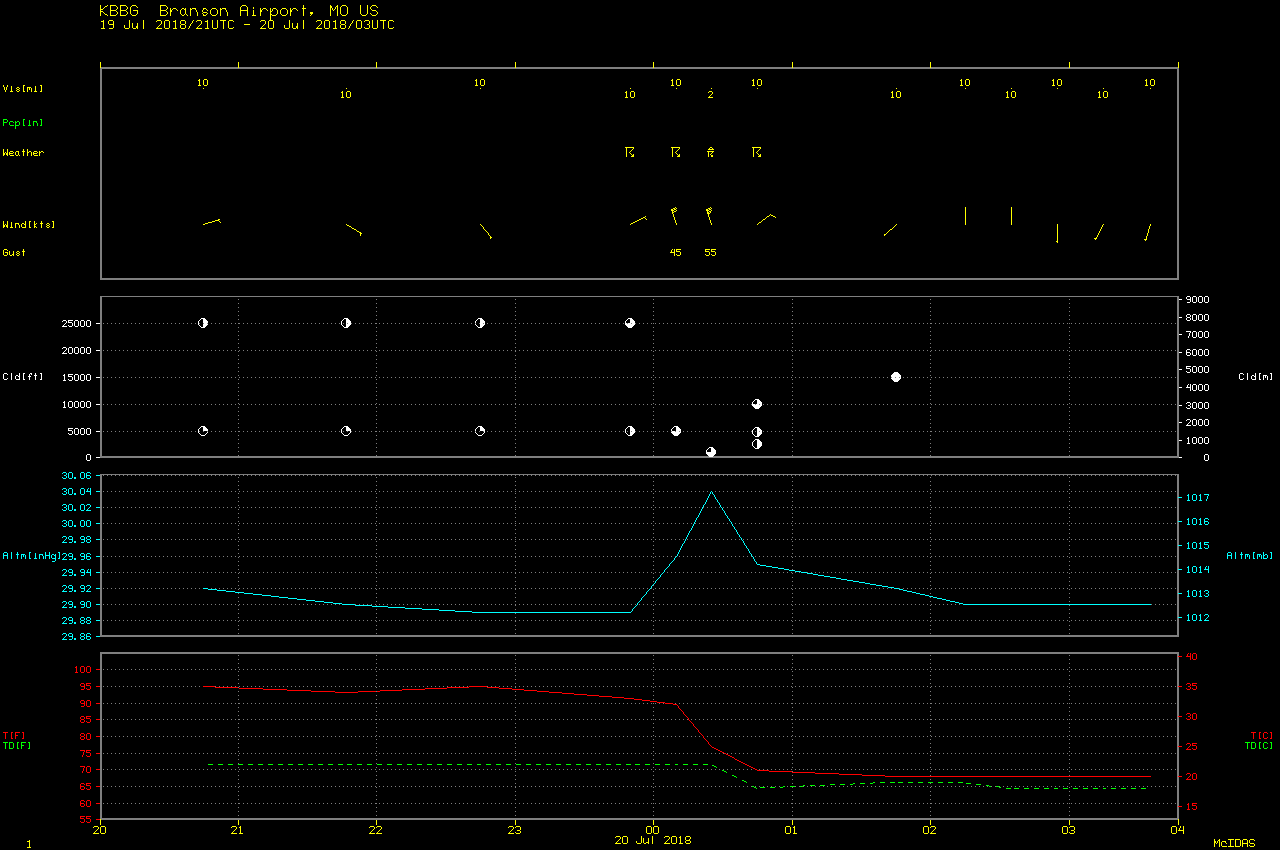
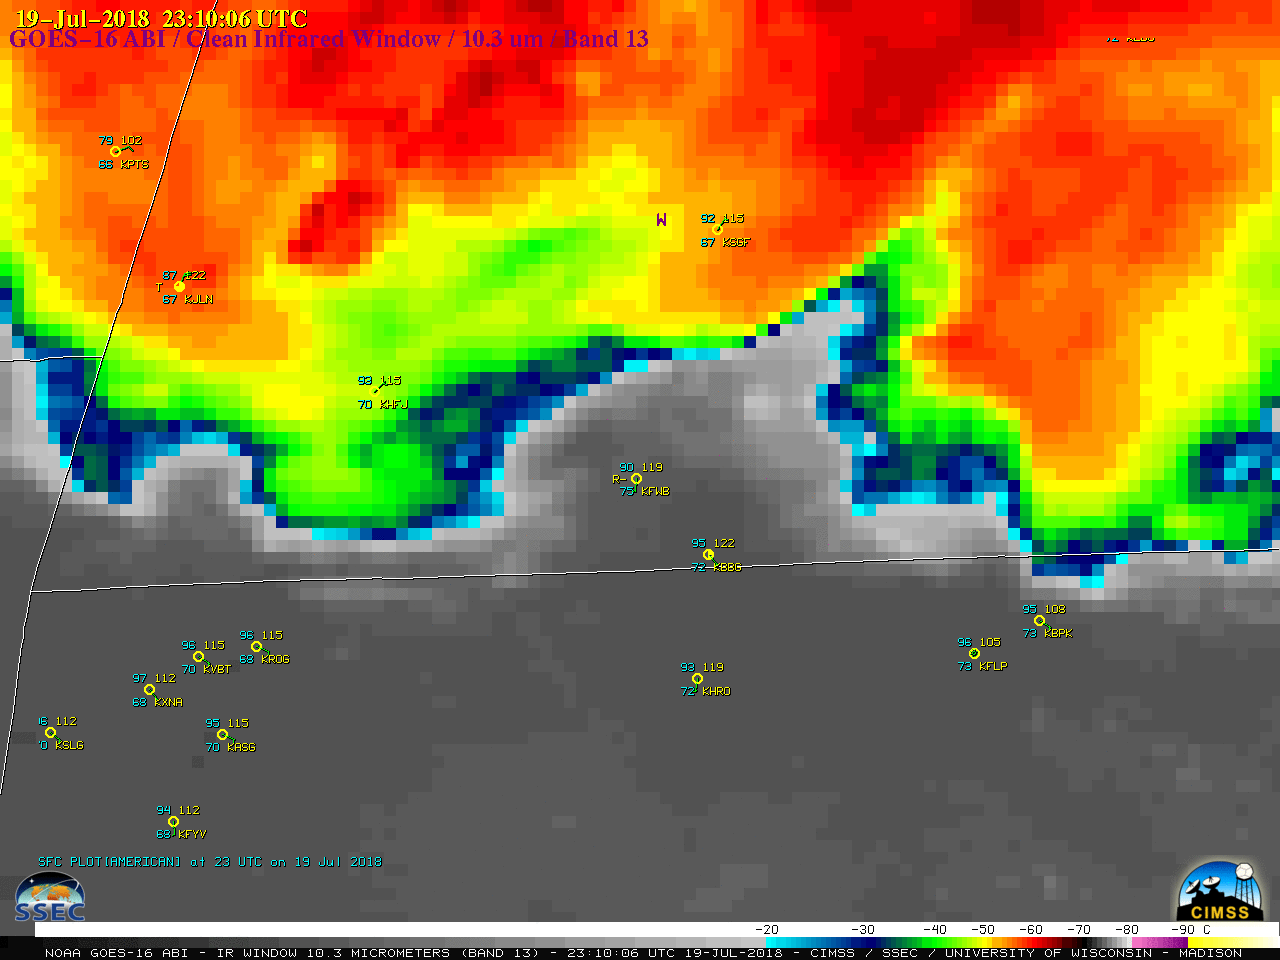
![GOES-16 "Clean" Infrared Window (10.3 µm), with hourly surface plots plotted in cyan/yellow and SPC storm reports plotted in dark blue [click to play MP4 animation | Animated GIF]](https://cimss.ssec.wisc.edu/satellite-blog/wp-content/uploads/sites/5/2018/07/G16_IR_MO_SVR_19JUL2018_960x1280_B13_2018201_002506_0001PANEL_00056.GIF)
