Numerous wildfires burning in southwestern Canada (primarily British Columbia: NOAA HMS fire/smoke product) produced large amounts of smoke, which was subsequently transported eastward across southern Canada and then southward across the Midwestern US during the 09 August – 11 August 2018 period. GOES-16 (GOES-East) Natural Color Red-Green-Blue (RGB) images from the AOS site (above) showed this... Read More
![GOES-16 Natural Color RGB images [click to play MP4 animation]](https://cimss.ssec.wisc.edu/satellite-blog/wp-content/uploads/sites/5/2018/08/201808112307_mw.jpg)
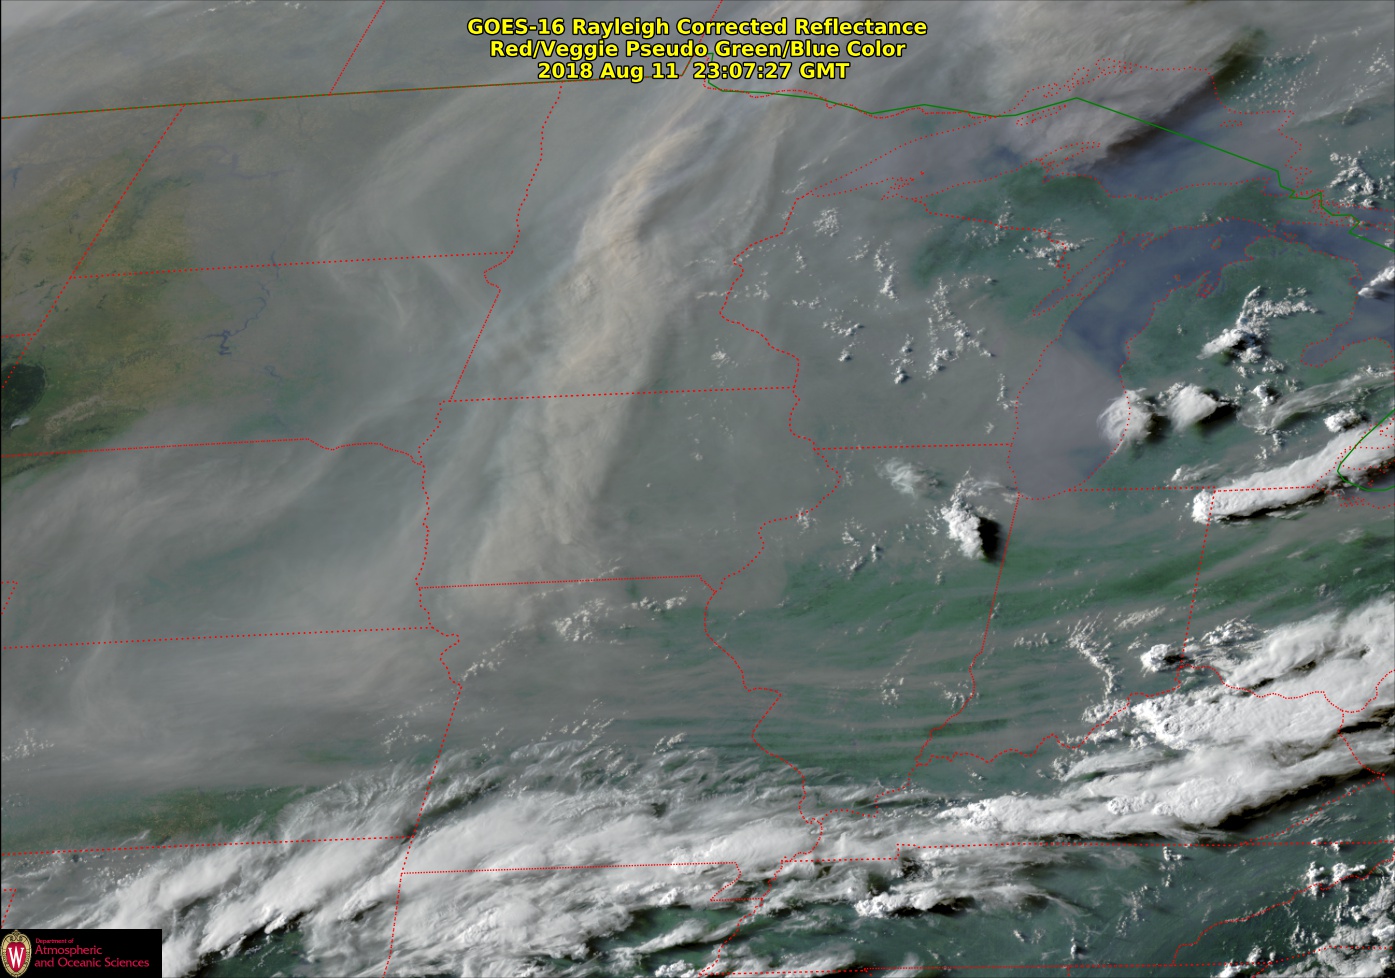
GOES-16 Natural Color RGB images, 09-11 August [click to play MP4 animation]
Numerous wildfires burning in southwestern Canada (primarily British Columbia:
NOAA HMS fire/smoke product) produced large amounts of smoke, which was subsequently transported eastward across southern Canada and then southward across the Midwestern US during the
09 August –
11 August 2018 period. GOES-16
(GOES-East) Natural Color Red-Green-Blue (RGB) images from the
AOS site
(above) showed this smoke, portions of which were optically very thick at times (and were able to cast shadows owing to its significant vertical depth).
On 09 August the smoke was most highly concentrated over the Dakotas, as shown in a comparison of GOES-16 Aerosol Optical Depth (AOD), Smoke Detection, “Blue” Visible (0.47 µm) and “Red” Visible (0.64 µm) images (below). While much of the smoke was likely aloft within the middle troposphere, some had been mixed downward into the boundary layer and was restricting the surface visibility to 3-5 miles at many locations.
Note that the hazy signature of the widespread smoke was a bit more apparent in the 0.47 µm Visible imagery than the 0.64 µm Visible imagery, especially during mid-day when the sun-satellite “forward scattering angle” was at a minimum. The AOD and Smoke Detection derived products use data from Visible and Near-Infrared bands — so it they are only available during daytime hours (and only at solar zenith angles less than 60 degrees). The Smoke Detection product was more effective during times of enhanced forward scattering (early and late in the day) — but it also was susceptible to false alarms due to solar reflectance off water surfaces. Additional information on GOES-R Aerosol Detection Products in AWIPS is available here and here.
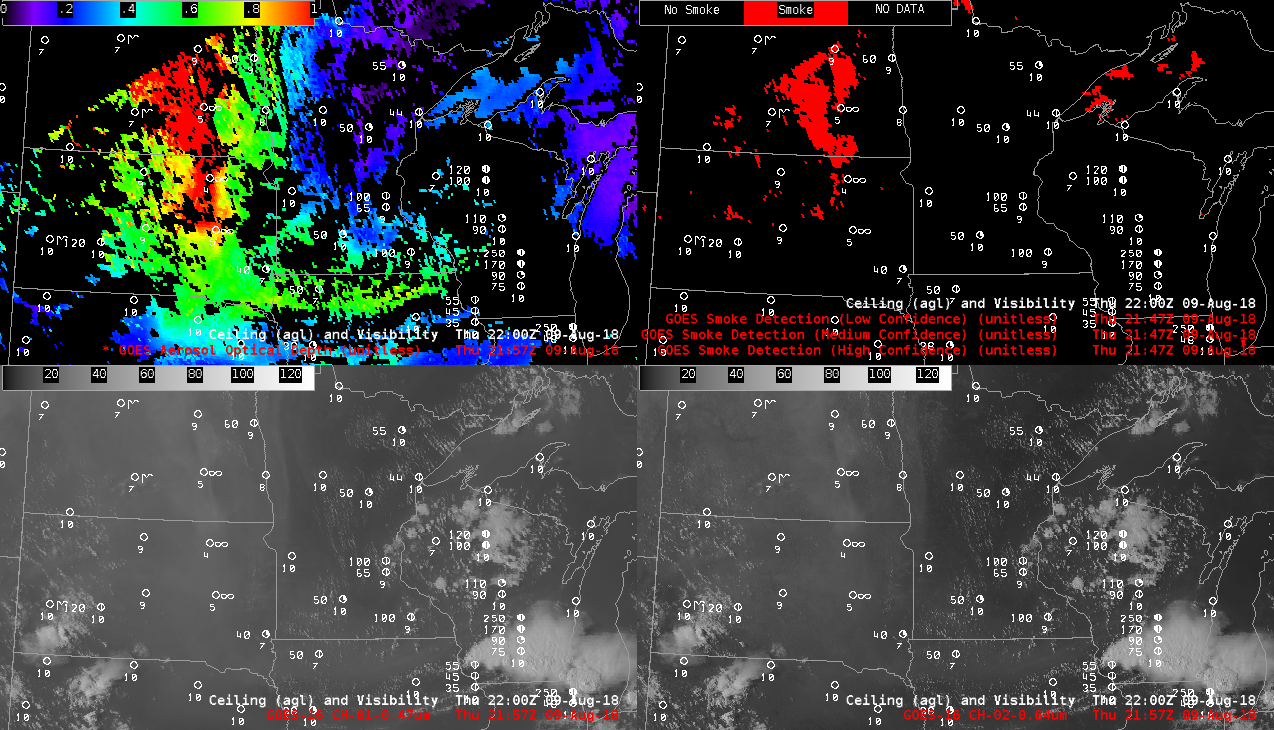
GOES-16 Aerosol Optical Depth (top left), Smoke Detection product (top right). “Blue” Visible (0.47 µm, bottom left) and “Red” Visible (0.64 µm, bottom right) [click to play animation | MP4]
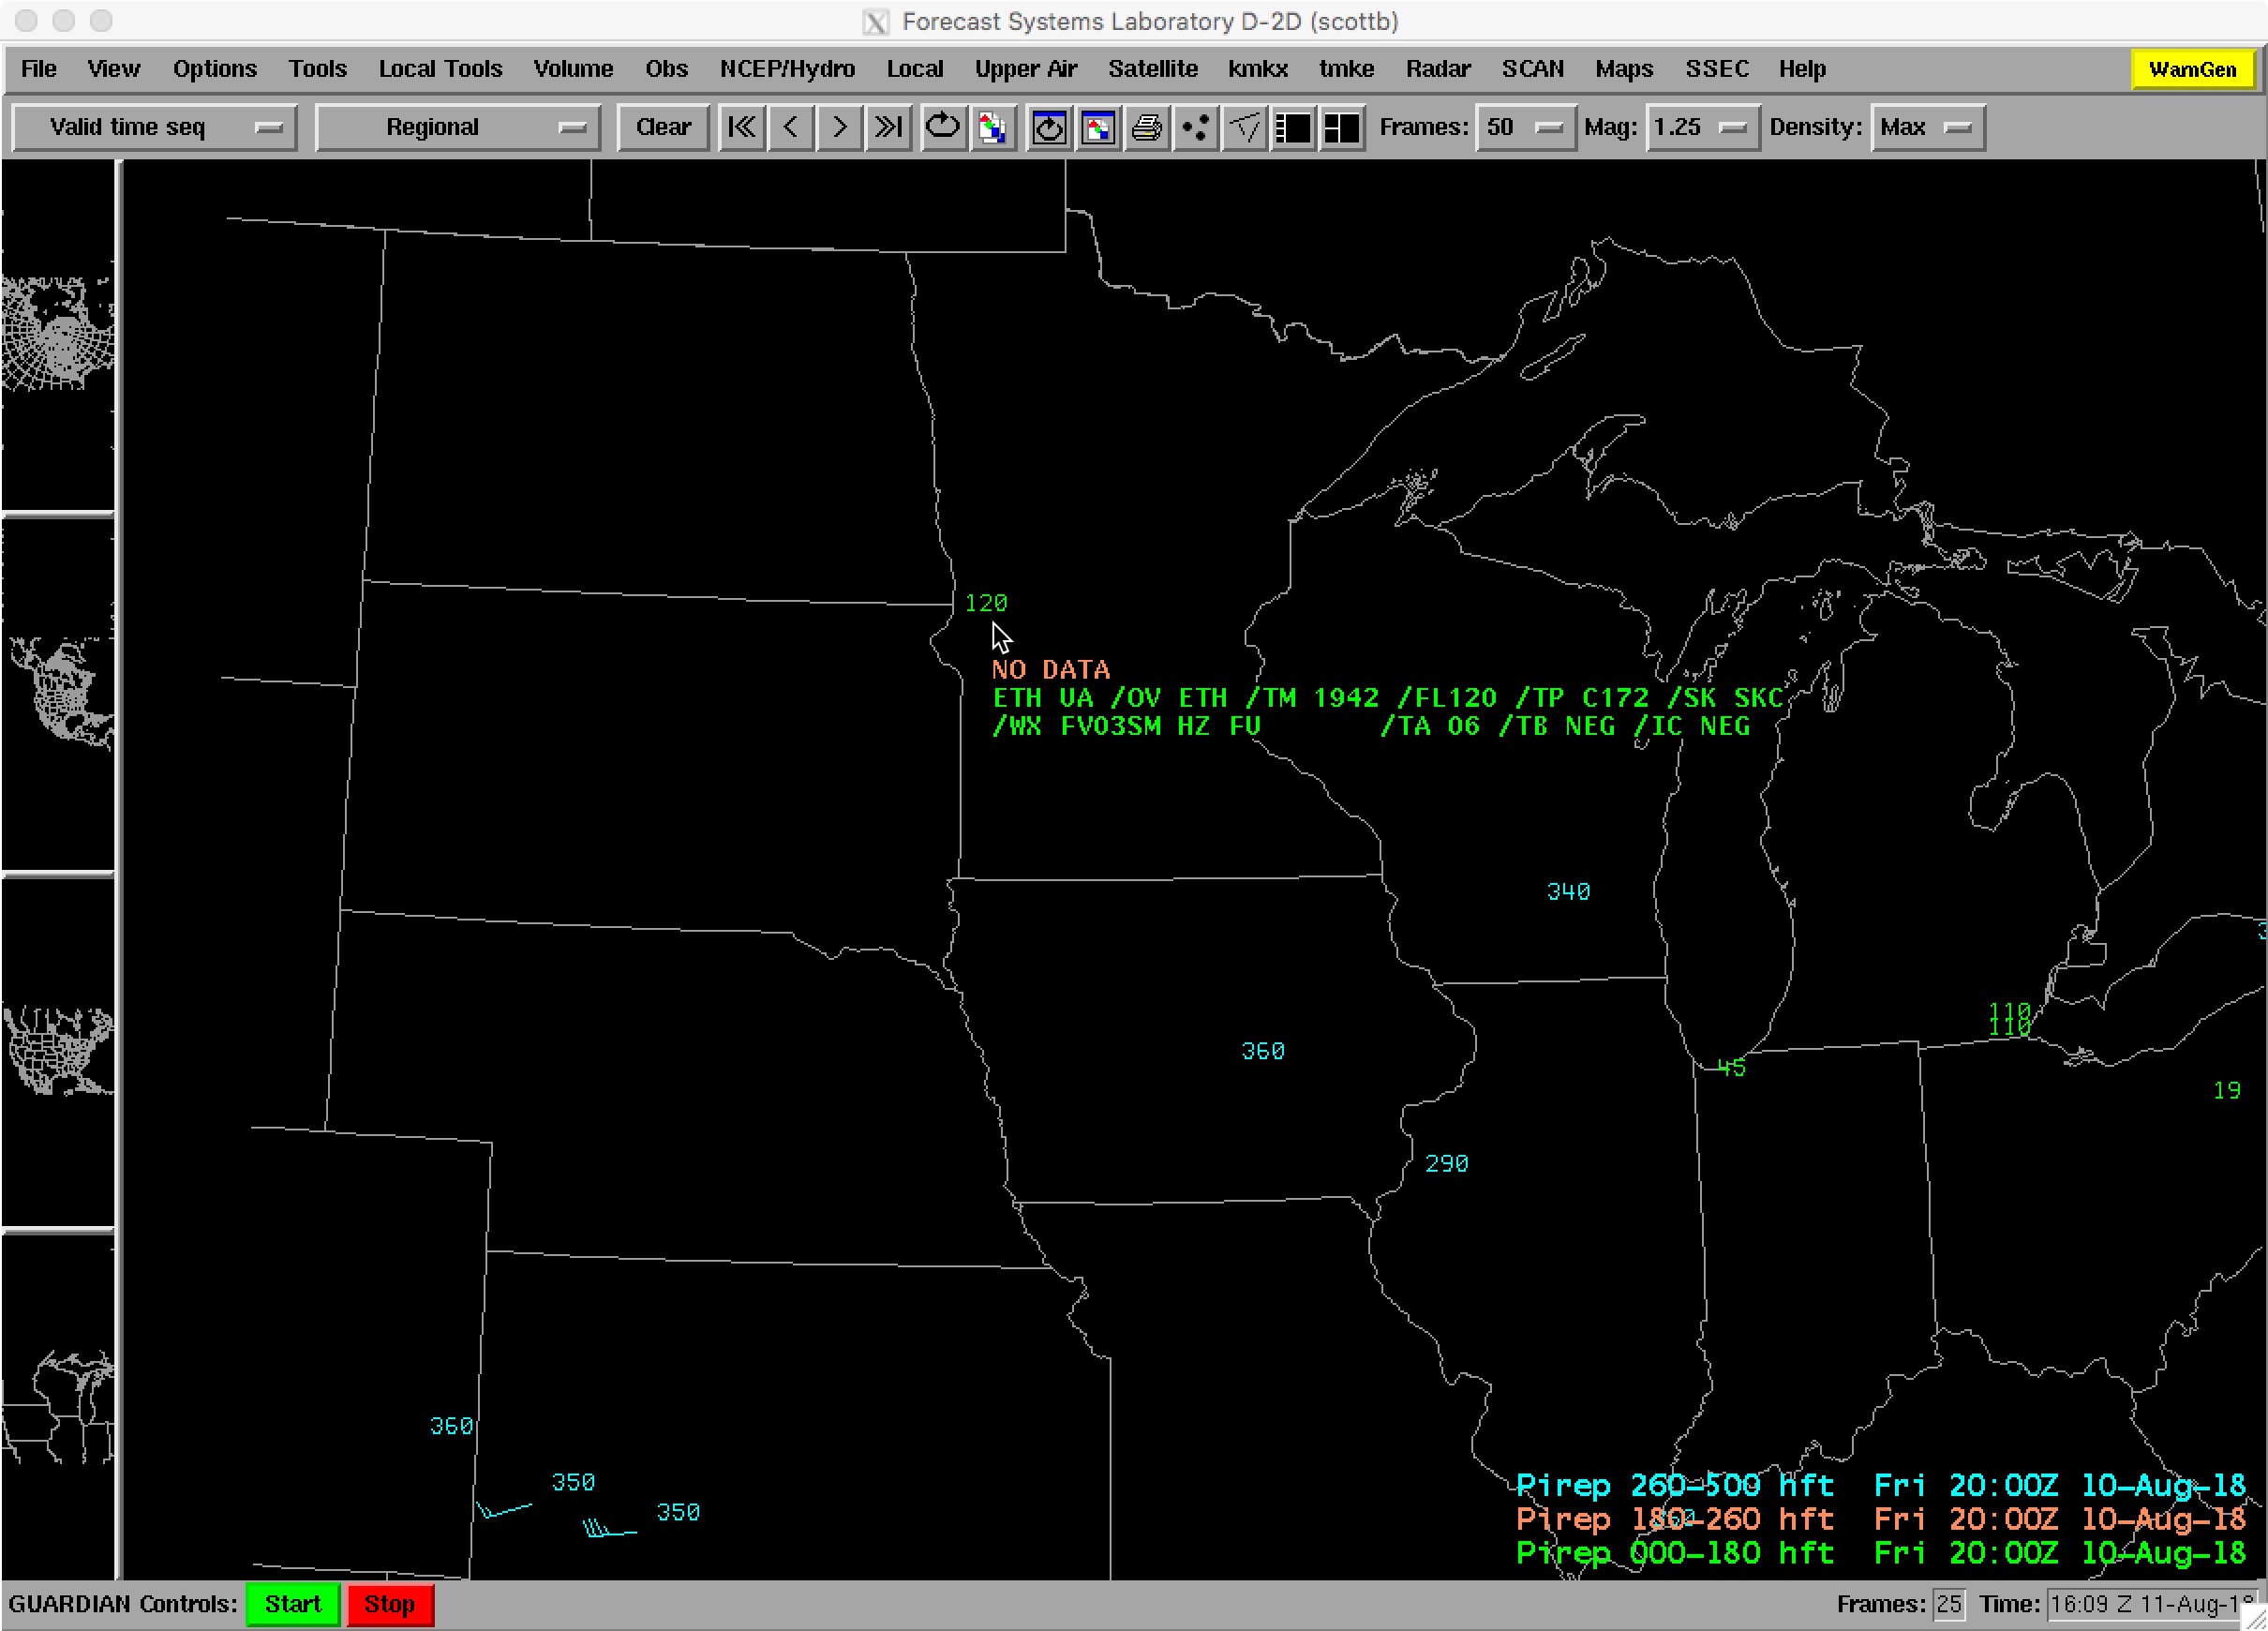
On 10 August, the smoke was most dense across the eastern Dakotas and Minnesota
(below) — and once again, surface visibilities were restricted to 3-5 miles at some locations. On this day pilot reports mentioned flight visibility being restricted to 3 miles at altitudes as high as
12,000 feet.
![GOES-16 Aerosol Optical Depth (top left), Smoke Detection product (top right). "Blue" Visible (0.47 µm, bottom left) and "Red" Visible (0.64 µm, bottom right) [click to play animation | MP4]](https://cimss.ssec.wisc.edu/satellite-blog/wp-content/uploads/sites/5/2018/08/midwest_smoke_4panel-20180810_220227.png)
GOES-16 Aerosol Optical Depth (top left), Smoke Detection product (top right). “Blue” Visible (0.47 µm, bottom left) and “Red” Visible (0.64 µm, bottom right) [click to play animation | MP4]
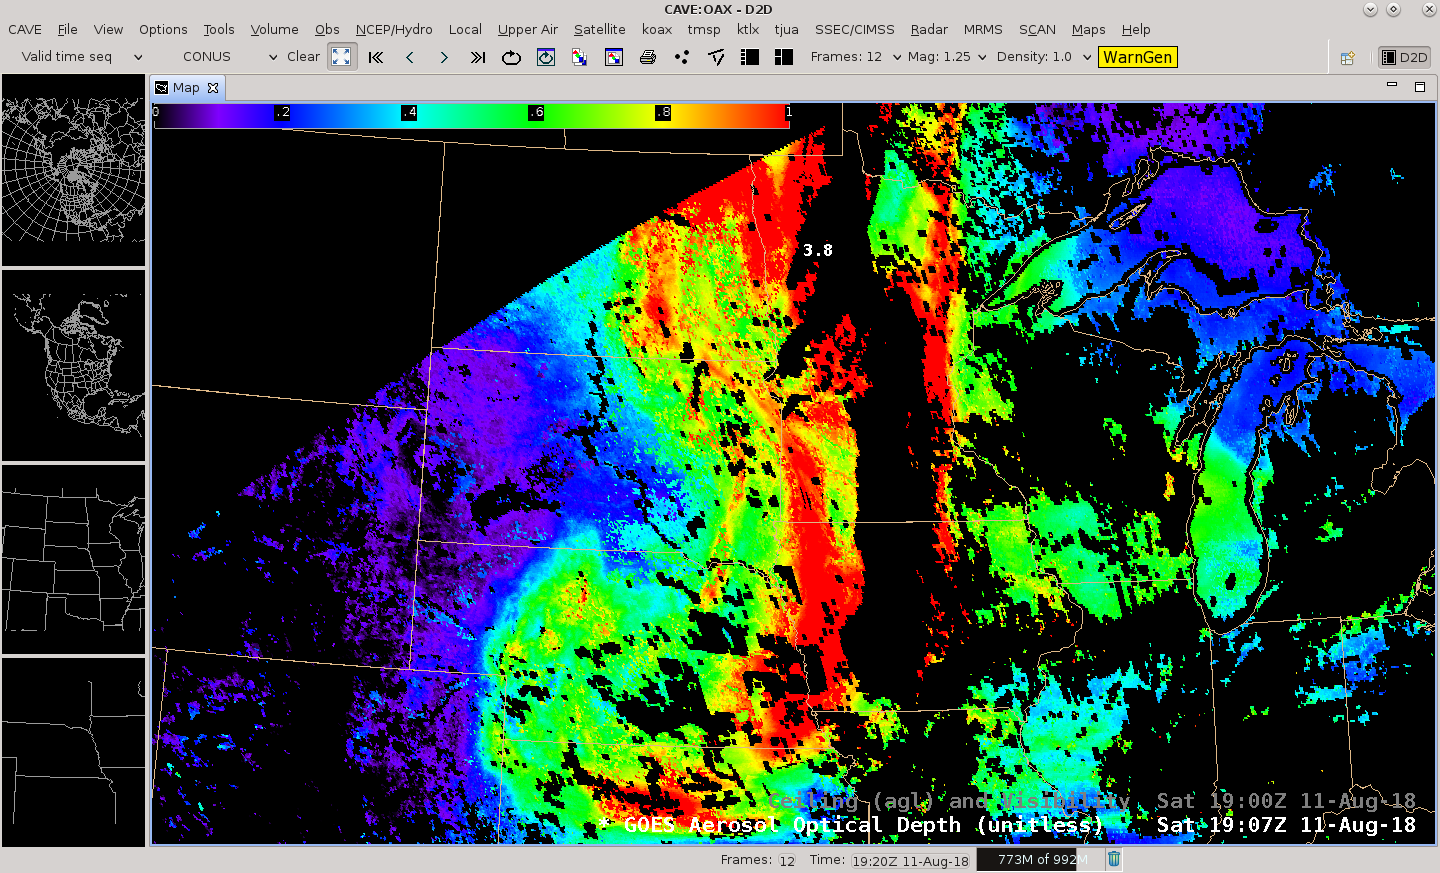
Finally, on 11 August a north-to-south plume of particularly dense smoke drifted southward across Minnesota and Iowa, as seen in a comparison of GOES-16 Aerosol Optical Depth, “Red” Visible (0.64 µm). Near-Infrared “Cirrus” (1.37 µm) and “Clean” Infrared Window (10.3 µm) images
(below). In this case the AOD values were quite high (
in excess of 3.0 in northwestern Minnesota), beyond the range of values scaled for display in AWIPS — this led to the swath of black “No Data” values where the smoke was most dense. This plume of thick smoke also exhibited a signature in Near-Infrared “Cirrus” images; higher concentrations of airborne particles that are effective scatterers of light at the 1.37 µm wavelength
(such as ice crystals, smoke, volcanic ash, or dust) will be detected using this imagery. Note the lack of a well defined signature on the 10.3 µm imagery — smoke is effectively transparent to radiation at these longer infrared wavelengths.
![GOES-16 Aerosol Optical Depth (top left), "Red" Visible (0.64 µm, top right). Near-Infrared "Cirrus" (1.37 µm, bottom left) and "Clean" Infrared Window (10.3 µm, bottom right) [click to play animation | MP4]](https://cimss.ssec.wisc.edu/satellite-blog/wp-content/uploads/sites/5/2018/08/midwest_smoke_cirrus_2_4panel-20180811_221227.png)
GOES-16 Aerosol Optical Depth (top left), “Red” Visible (0.64 µm, top right). Near-Infrared “Cirrus” (1.37 µm, bottom left) and “Clean” Infrared Window (10.3 µm, bottom right) [click to play animation | MP4]
On a side note, the north-south plume of dense smoke over southcentral Canada and the Midwest US on 11 August was also very apparent from a distance of 983,269 miles (1,582,418.07 km) — 44 times the distance of the GOES-16 satellite — in
EPIC Natural Color imagery from the
DSCOVR satellite
(below).
![DSCOVR EPIC Natural Color images [click to enlarge]](https://cimss.ssec.wisc.edu/satellite-blog/wp-content/uploads/sites/5/2018/08/180811_dscovr_epic_natural_color_anim.gif)
DSCOVR EPIC Natural Color images [click to enlarge]
View only this post
Read Less
![GOES-15, GOES-14, GOES-17 and GOES-16 Shortwave Infrared (3.9 µm) images [click to play MP4 animation]](https://cimss.ssec.wisc.edu/satellite-blog/wp-content/uploads/sites/5/2018/08/G15_G14_G17_G16_SWIR_CARR_FIRE_CA_11AUG2017_960x320_B2277_2018223_191500_0004PANELS_00254.GIF)
![Landsat-8 False Color and Thermal Infrared (10.9 µm) images [click to enlarge]](https://cimss.ssec.wisc.edu/satellite-blog/wp-content/uploads/sites/5/2018/08/180811_1851utc_landsat8_falsecolor_thermalInfrared_Carr_Fire_anim.gif)
![GOES-16 Aerosol Optical Depth (top left), Smoke Detection product (top right). "Blue" Visible (0.47 µm, bottom left) and "Red" Visible (0.64 µm, bottom right) [click to play animation | MP4]](https://cimss.ssec.wisc.edu/satellite-blog/wp-content/uploads/sites/5/2018/08/180810_goes16_aod_smoke_visible_surface_obs_Midwest_smoke_anim.gif)
![GOES-16 Aerosol Optical Depth (top left), "Red" Visible (0.64 µm, top right). Near-Infrared "Cirrus" (1.37 µm, bottom left) and "Clean" Infrared Window (10.3 µm, bottom right) [click to play animation | MP4]](https://cimss.ssec.wisc.edu/satellite-blog/wp-content/uploads/sites/5/2018/08/180811_goes16_aod_visible_cirrus_infrared_midwest_smoke_anim.gif)
![Shortwave Infrared (3.9 µm) images from GOES-15, GOES-14, GOES-17 and GOES-16 [click to play MP4 animation]](https://cimss.ssec.wisc.edu/satellite-blog/wp-content/uploads/sites/5/2018/08/G15_G14_G17_G16_SWIR_HOLY_FIRE_CA_09AUG2017_960x320_B2277_2018221_144500_0004PANELS_00422.GIF)
![Landsat-8 False Color image [click to enlarge]](https://cimss.ssec.wisc.edu/satellite-blog/wp-content/uploads/sites/5/2018/08/180808_1822utc_landsat8_falsecolor_Holy_Fire_CA.jpeg)

