* GOES-17 images shown here are preliminary and non-operational *A toggle between NOAA-20 and Suomi NPP VIIRS Infrared Window (11.45 µm) images (above; courtesy of William Straka, CIMSS) showed the well-defined eye of Hurricane Hector after it had reached Category 4 intensity on 06 August 2018 (advisories: EPAC | CPAC).GOES-17... Read More
![NOAA-20 and Suomi NPP VIIRS Infrared Window (11.45 µm) images [click to enlarge]](https://cimss.ssec.wisc.edu/satellite-blog/wp-content/uploads/sites/5/2018/08/180806_1027utc_noaa20_1117utc_suomi_npp_viirs_InfraredWindow_Hurricane_Hector_anim.gif)
NOAA-20 and Suomi NPP VIIRS Infrared Window (11.45 µm) images [click to enlarge]
* GOES-17 images shown here are preliminary and non-operational *
A toggle between NOAA-20 and Suomi NPP VIIRS Infrared Window (11.45 µm) images (above; courtesy of William Straka, CIMSS) showed the well-defined eye of Hurricane Hector after it had reached Category 4 intensity on 06 August 2018 (advisories: EPAC | CPAC).
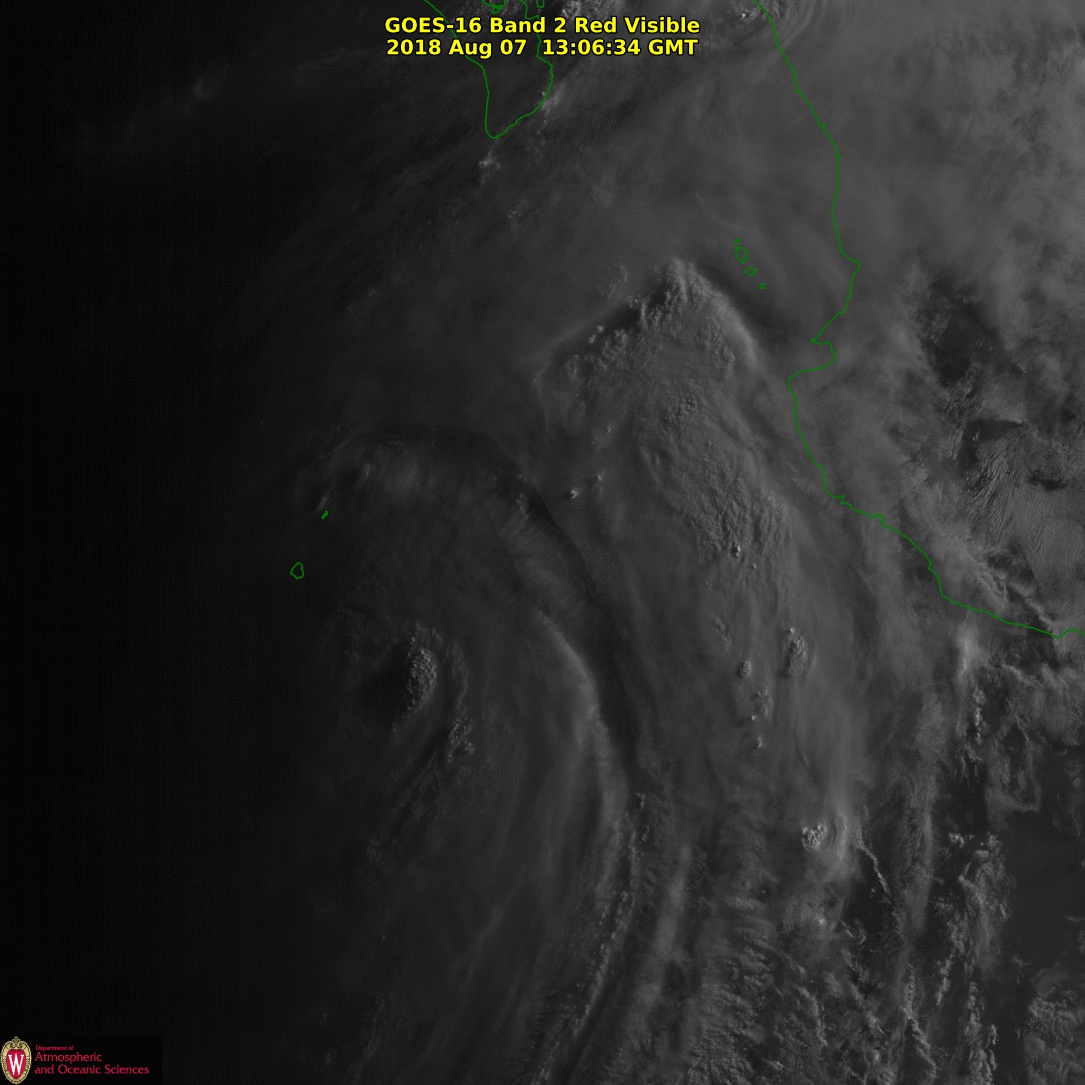
GOES-17 “Red” Visible (0.64 µm) images (below) revealed cloud-top gravity waves within the eyewall region of the storm, along with thin filaments of transverse banding in the northern semicircle farther from the eye.
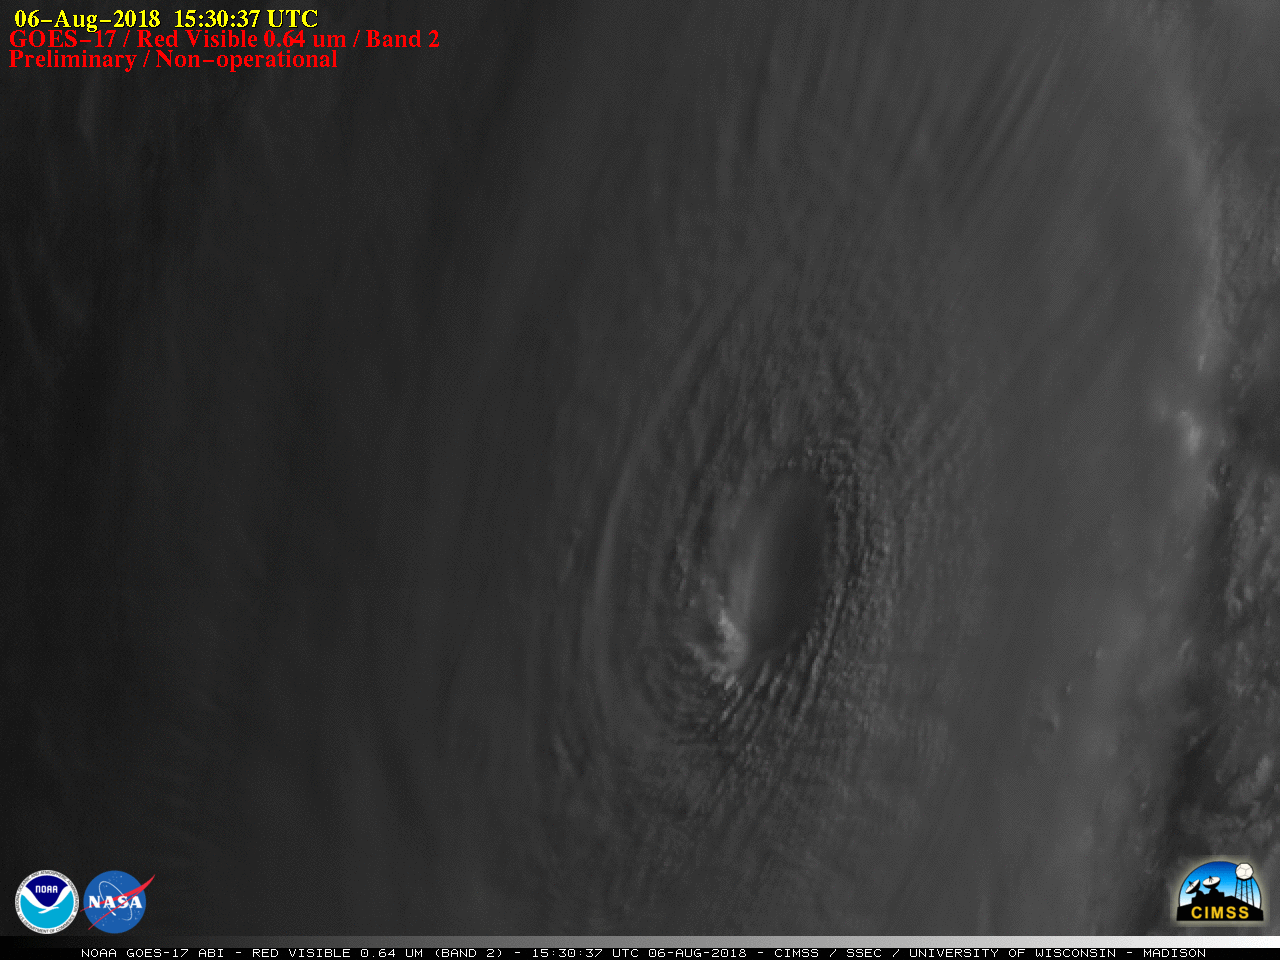
GOES-17 “Red” Visible (0.64 µm) images [click to play animation | MP4]
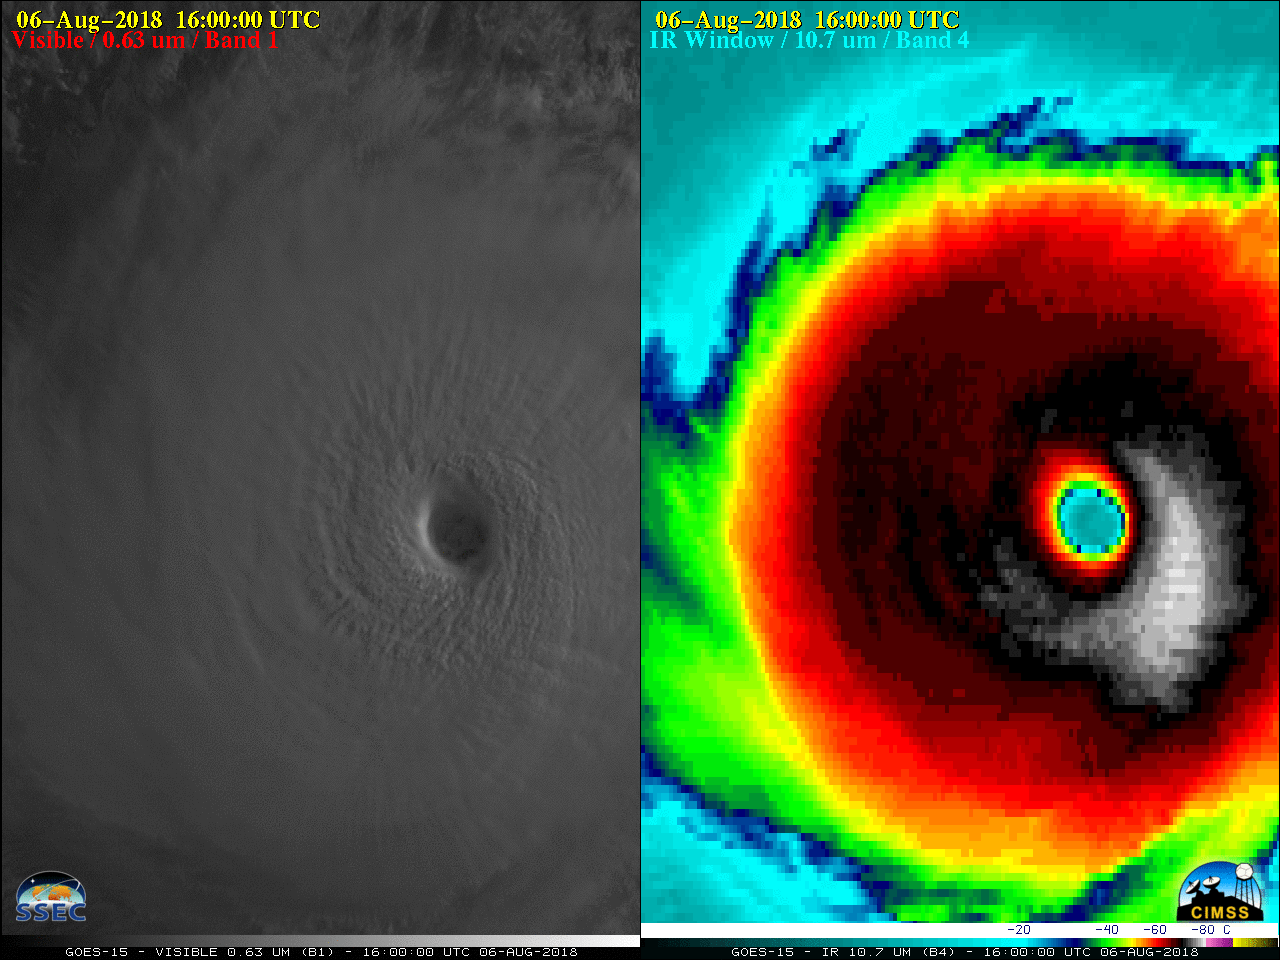
GOES-15
(GOES-West) Visible (0.63 µm) and Infrared Window (10.7 µm) images
(below) showed that eyewall cloud-top infrared brightness temperatures were in the -70 to -80ºC range
(black to white enhancement).
![GOES-15 Visible (0.63 µm, left) and Infrared Window (10.7 µm, right) images [click to play animation | MP4]](https://cimss.ssec.wisc.edu/satellite-blog/wp-content/uploads/sites/5/2018/08/G15_VIS_IR_HECTOR_06AUG2018_958x638_B14_2018218_160000_0002PANELS_00003.GIF)
GOES-15 Visible (0.63 µm, left) and Infrared Window (10.7 µm, right) images [click to play animation | MP4]
A magnified view of GOES-15 Visible images
(below) revealed mesovortices within the eye of Hector.
![GOES-15 Visible (0.63 µm) images [click to play animation | MP4]](https://cimss.ssec.wisc.edu/satellite-blog/wp-content/uploads/sites/5/2018/08/G15_VIS_HECTOR_06AUG2018_960x1280_B1_2018218_194500_0001PANEL_00017.GIF)
GOES-15 Visible (0.63 µm) images [click to play animation | MP4]
Metop ASCAT surface scatterometer winds
(below) surrounding the eye were near 70 knots around 1930 UTC.
![GOES-15 Infrared Window (10.7 µm) image and Metop ASCAT surface scatterometer winds [click to enlarge]](https://cimss.ssec.wisc.edu/satellite-blog/wp-content/uploads/sites/5/2018/08/180806_1930utc_goes15_ir_ascat_Hurricane_Hector_anim.gif)
GOES-15 Infrared Window (10.7 µm) image and Metop ASCAT surface scatterometer winds [click to enlarge]
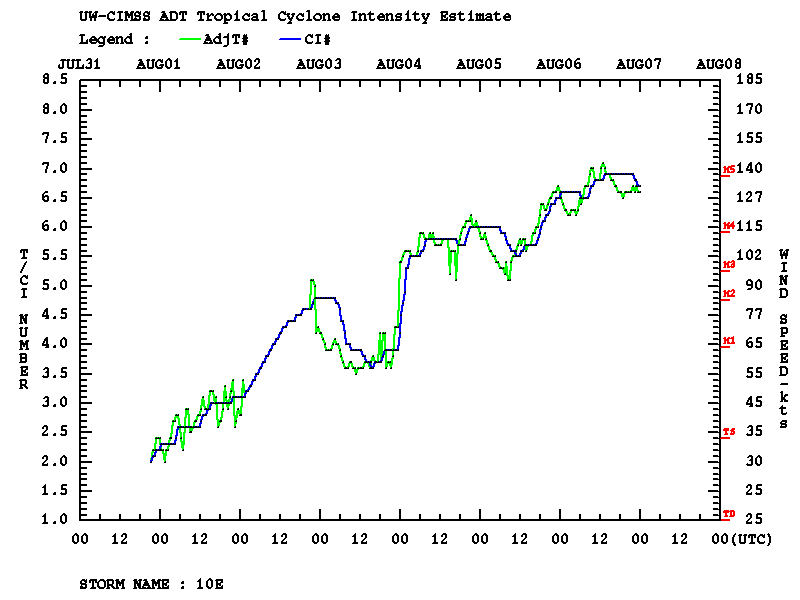
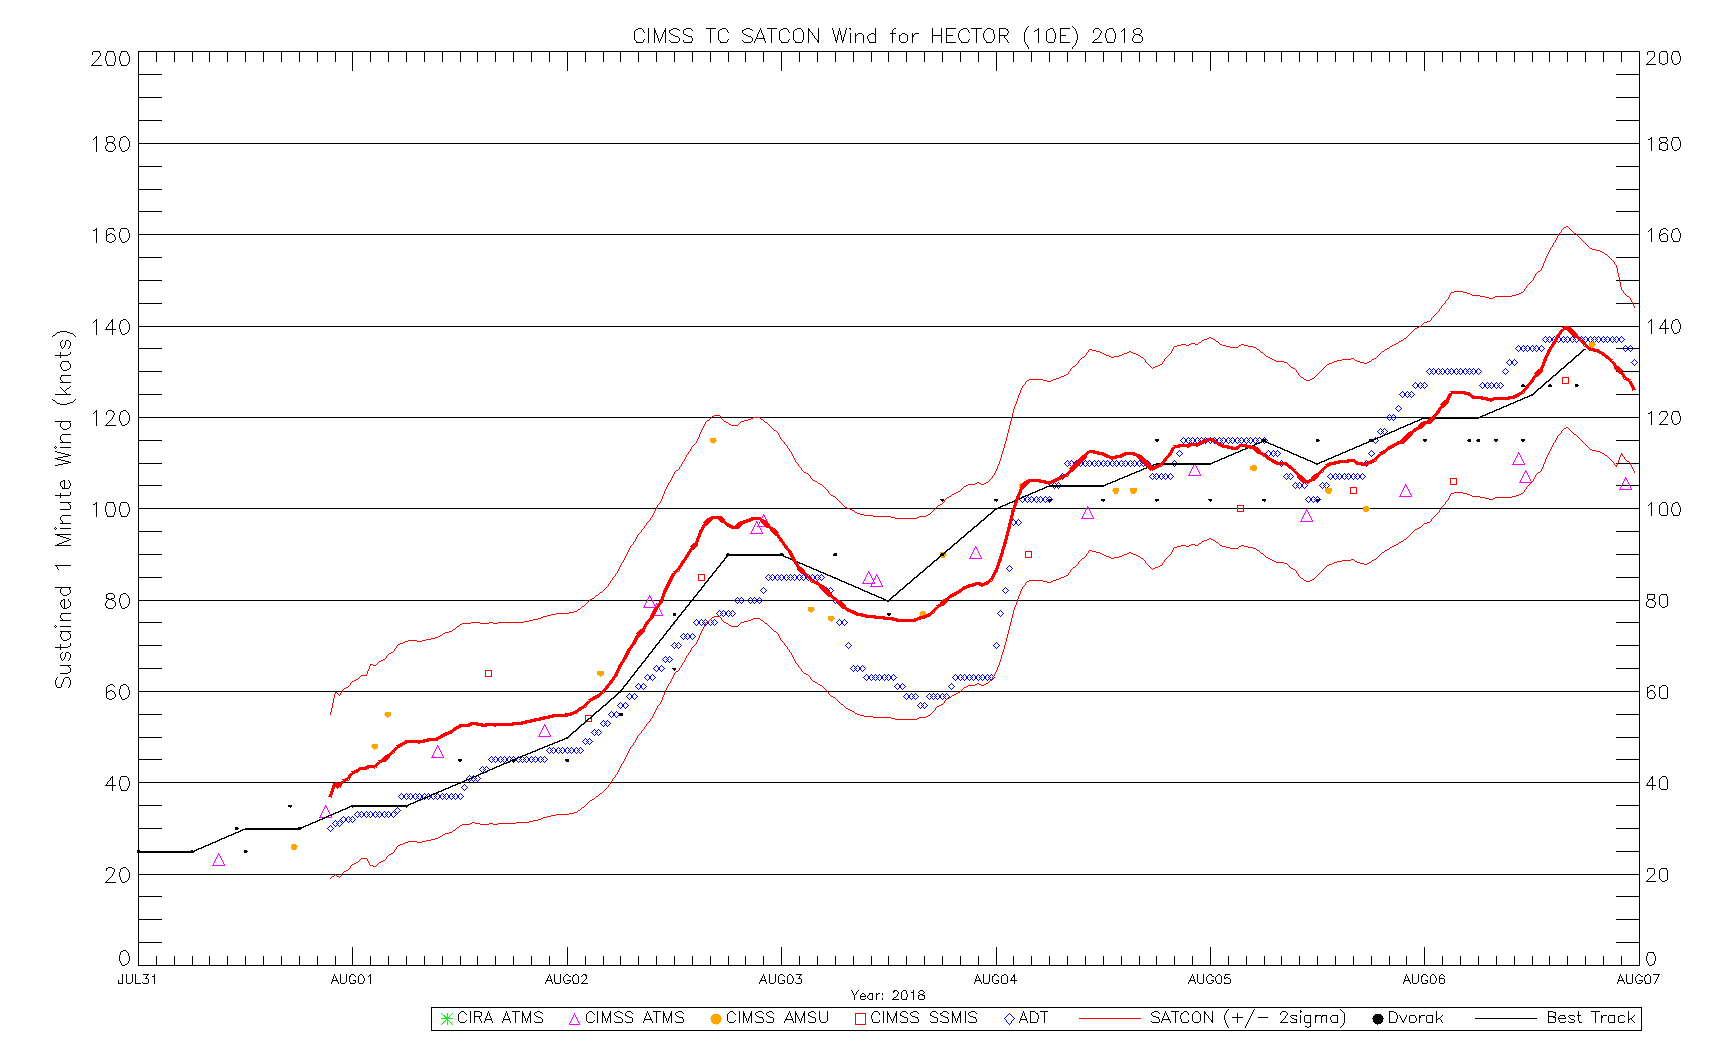
The
MIMIC-TC morphed microwave product
(below) showed that Hector underwent an eyewall replacement cycle early in the day on 05 August, and then maintained a well-defined eye as it subsequently strengthened to a high-end Category 4 intensity on 06 August (
ADT |
SATCON).
![MIMIC-TC morphed microwave product [click to play animation]](https://cimss.ssec.wisc.edu/satellite-blog/wp-content/uploads/sites/5/2018/08/180806_mimic_tc_Hector.jpeg)
MIMIC-TC morphed microwave product [click to play animation]
===== 07 August Update =====
![NOAA-20 VIIRS Day/Night Band (0.7 µm) and Infrared Window (11.45 µm) images [click to enlarge]](https://cimss.ssec.wisc.edu/satellite-blog/wp-content/uploads/sites/5/2018/08/180807_1148utc_noaa20_DayNightBand_InfraredWindow_Hurricane_Hector_anim.gif)
NOAA-20 VIIRS Day/Night Band (0.7 µm) and Infrared Window (11.45 µm) images [click to enlarge]
A nighttime NOAA-20 VIIRS Day/Night Band (0.7 µm) image
(above) revealed the presence of mesospheric airglow waves (
reference) propagating northwestward away from Category 4 Hurricane Hector on 07 August. Note that these high-altitude waves were not apparent on the corresponding Infrared Window (11.45 µm) image.
View only this post
Read Less


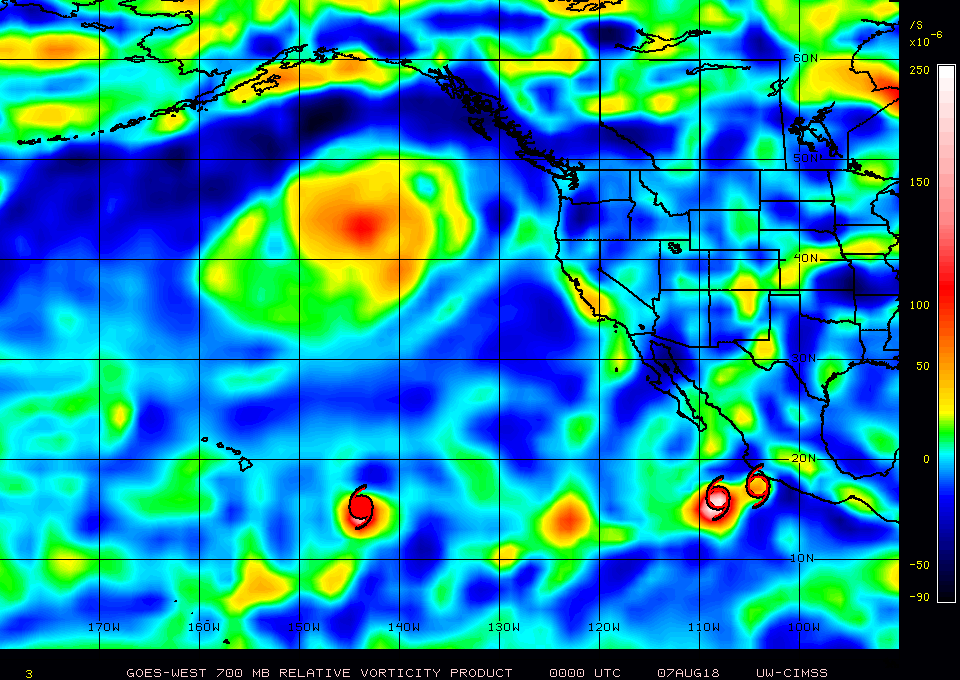
![3-hourly analyses of 850 hPa relative vorticity [click to enlarge]](https://cimss.ssec.wisc.edu/satellite-blog/wp-content/uploads/sites/5/2018/08/180807_TS_Ileana_Hurricane_John_850hPa_vorticity_anim.gif)
![Visible images from GOES-15, GOES-14, GOES-17 and GOES-16 [click to play animation | MP4]](https://cimss.ssec.wisc.edu/satellite-blog/wp-content/uploads/sites/5/2018/08/180808_goes15_goes14_goes17_goes16_visible_Hurricane_John_anim.gif)

![GOES-15 Visible (0.63 µm, left) and Infrared Window (10.7 µm, right) images [click to play animation | MP4]](https://cimss.ssec.wisc.edu/satellite-blog/wp-content/uploads/sites/5/2018/08/180806_goes15_visible_infrared_Hurricane_Hector_anim.gif)
![GOES-15 Visible (0.63 µm) images [click to play animation | MP4]](https://cimss.ssec.wisc.edu/satellite-blog/wp-content/uploads/sites/5/2018/08/180806_goes15_visible_Hurricane_Hector_anim.gif)
![MIMIC-TC morphed microwave product [click to play animation]](https://cimss.ssec.wisc.edu/satellite-blog/wp-content/uploads/sites/5/2018/08/180804_180806_mimic_tc_Hector_anim.gif)
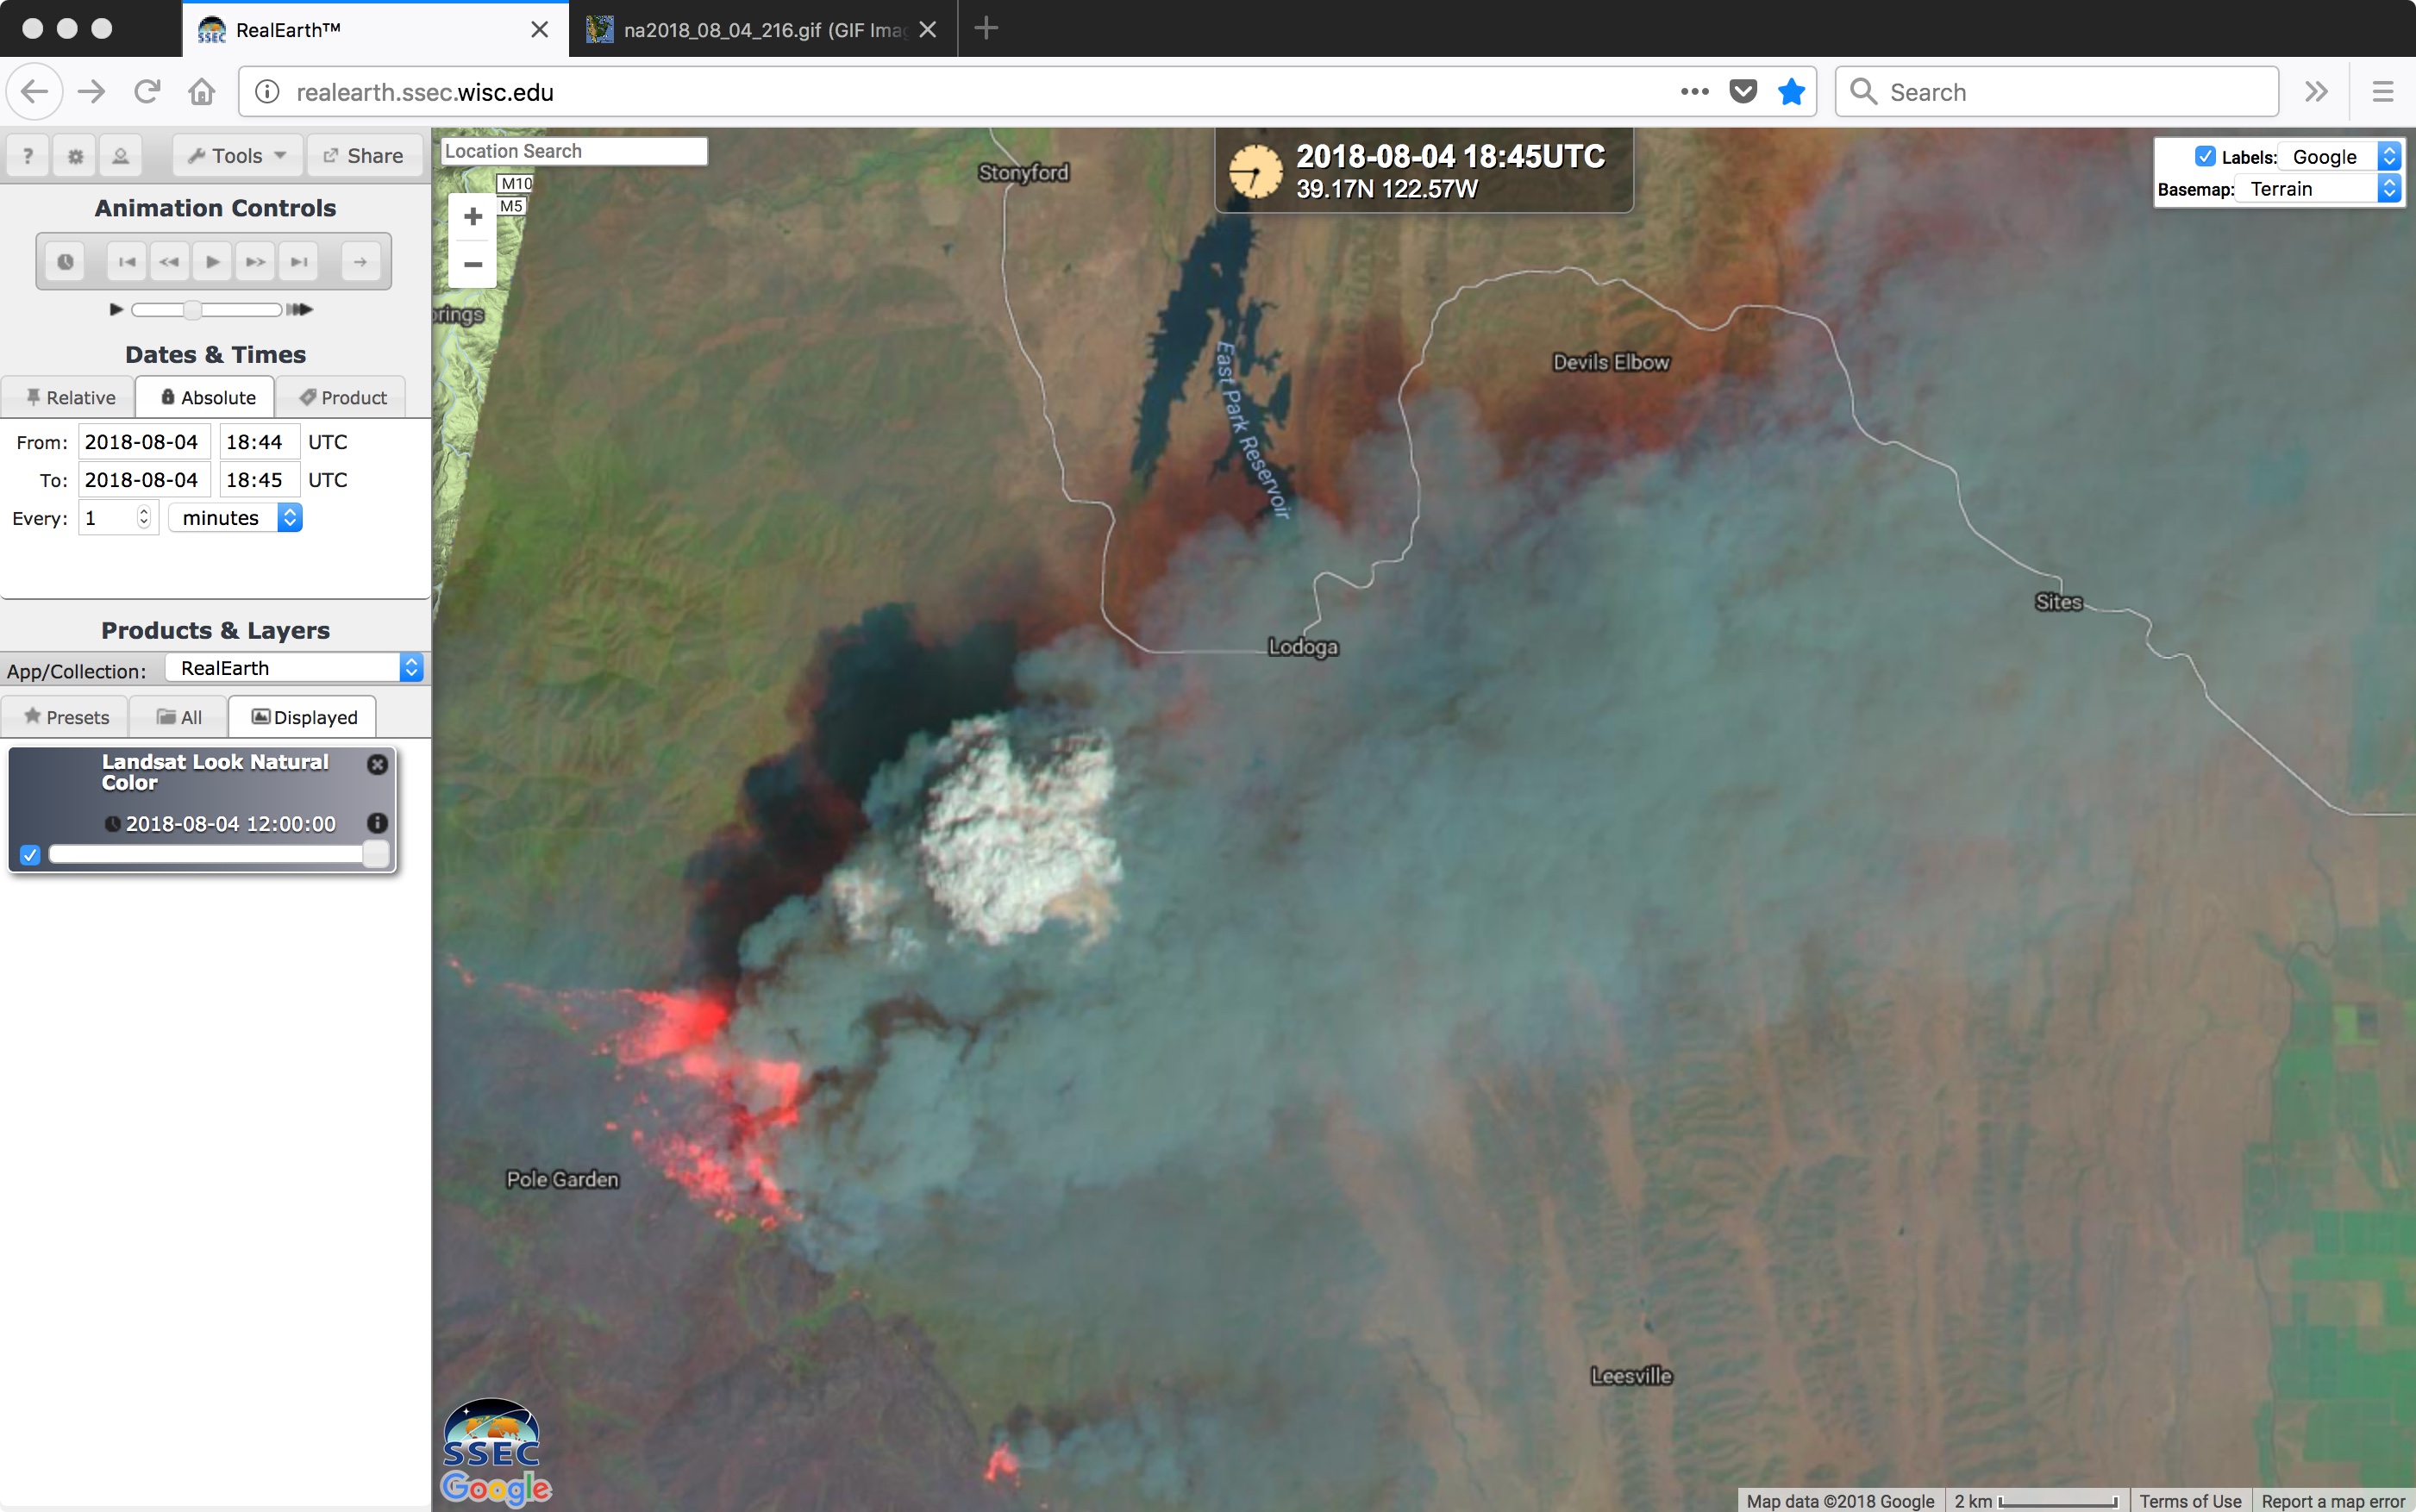
![Landsat-8 False Color image [click to enlarge]](https://cimss.ssec.wisc.edu/satellite-blog/wp-content/uploads/sites/5/2018/08/180804_1845utc_landsat8_falsecolor_Mendocino_Complex_CA_fire.jpeg)
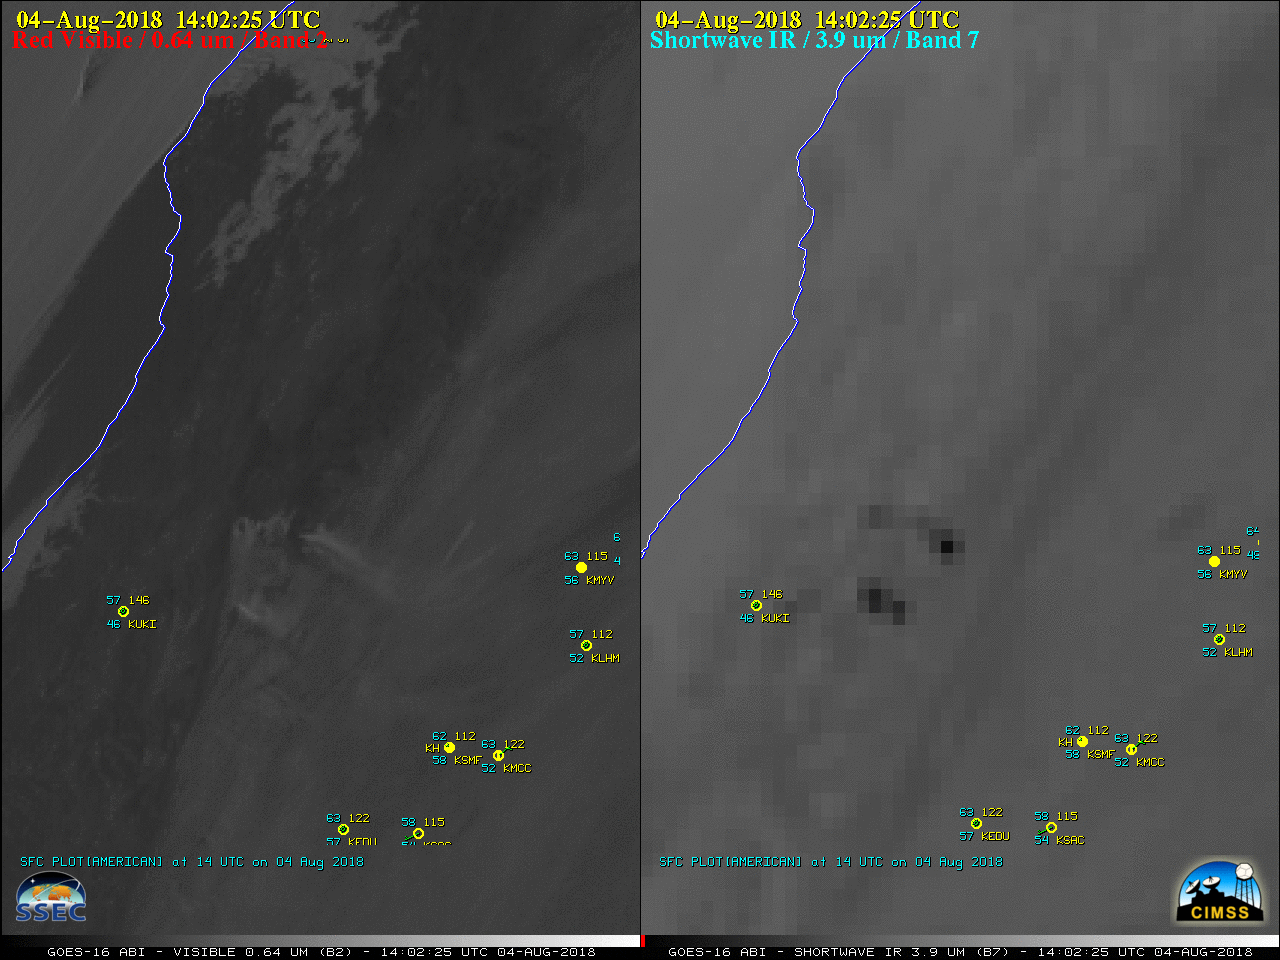
![GOES-16 Upper-level (6.2 µm, top left), Mid-level (6.9 µm, top right), Low-level (7.3 µm, bottom left) Water Vapor and "Red" Visible with Derived Motion Winds (0.64 µm, bottom right) [click to play MP4 animation]](https://cimss.ssec.wisc.edu/satellite-blog/wp-content/uploads/sites/5/2018/08/CA_4panel_dmw-20180804_220225.png)
![NOAA-20 VIIRS Day/Night Band (0.7 µm), Near-Infrared (1.61 µm and 2.25 µm) and Shortwave Infrared (3.75 µm) images [click to enlarge]](https://cimss.ssec.wisc.edu/satellite-blog/wp-content/uploads/sites/5/2018/08/180807_1001utc_noaa20_viirs_Mendocino_Complex_anim.gif)
