West Pacific Typhoon Jebi underwent a period of very rapid intensification on 30 August 2018 (ADT | SATCON), reaching Category 5 Super Typhoon intensity. Himawari-8 rapid-scan (2.5 minute interval) “Clean” Infrared Window (10.4 µm) images (above) showed that Jebi began to exhibit an annular appearance with a nearly symmetric eyewall... Read More

Himawari-8 “Clean” Infrared Window (10.4 µm) images [click to play MP4 animation]
West Pacific Typhoon Jebi underwent a period of very rapid intensification on 30 August 2018 (
ADT |
SATCON), reaching Category 5 Super Typhoon intensity. Himawari-8 rapid-scan (2.5 minute interval) “Clean” Infrared Window (10.4 µm) images
(above) showed that Jebi began to exhibit an annular appearance with a nearly symmetric eyewall as it moved through the Northern Mariana Islands (north of Guam). The eye passed just south of the uninhabited volcanic island of Pagan around 16 UTC on 30 August.
Himawari-8 “Red” Visible images (below) revealed mesovortices within the eye of Jebi.
Himawari-8 “Red” Visible (0.64 µm) images [click to play MP4 animation]
Toggles between VIIRS Day/Night Band (0.7 µm) and Infrared Window (11.45 µm) images from NOAA-20 and Suomi NPP
(below) showed more detailed views of (1) the well defined eye, (2) surface mesovortices within the eye, and (3) storm-top gravity waves that were propagating away from the eyewall region. With the Moon in the Waning Gibbous phase (at 77% of Full), ample illumination was available to provide detailed “visible images at night” using the VIIRS DNB.
![NOAA-20 Day/Night Band (0.7 µm) and infrared Window (11.45 µm) images at 1602 UTC [click to enlarge]](https://cimss.ssec.wisc.edu/satellite-blog/wp-content/uploads/sites/5/2018/08/180831_1602utc_noaa20_viirs_DayNightBand_InfraredWindow_Jebi_anim.gif)
NOAA-20 VIIRS Day/Night Band (0.7 µm) and infrared Window (11.45 µm) images at 1602 UTC [click to enlarge]
![Suomi NPP VIIRS Day/Night Band (0.7 µm) and infrared Window (11.45 µm) images at 1652 UTC [click to enlarge]](https://cimss.ssec.wisc.edu/satellite-blog/wp-content/uploads/sites/5/2018/08/180831_1652utc_SuomiNPP_viirs_DayNightBand_InfraredWindow_Jebi_anim.gif)
Suomi NPP VIIRS Day/Night Band (0.7 µm) and infrared Window (11.45 µm) images at 1652 UTC [click to enlarge]
Convective Rain Rate and Surface Rain Rate products derived from GCOM-W1 AMSR2 data
(below) showed the heavy rainfall occurring within the eyewall region and a primary feeder band to the west. VIIRS and AMSR2 images courtesy of William Straka, CIMSS.
![GCOM-W2 AMSR2 Convective Rain Rate and Surface Rain Rate products [click to enlarge]](https://cimss.ssec.wisc.edu/satellite-blog/wp-content/uploads/sites/5/2018/08/180831_1645utc_gcom_amsr2_ConvectiveRainRate_SurfaceRainRate_Jebi_anim.gif)
GCOM-W2 AMSR2 Convective Rain Rate and Surface Rain Rate products [click to enlarge]
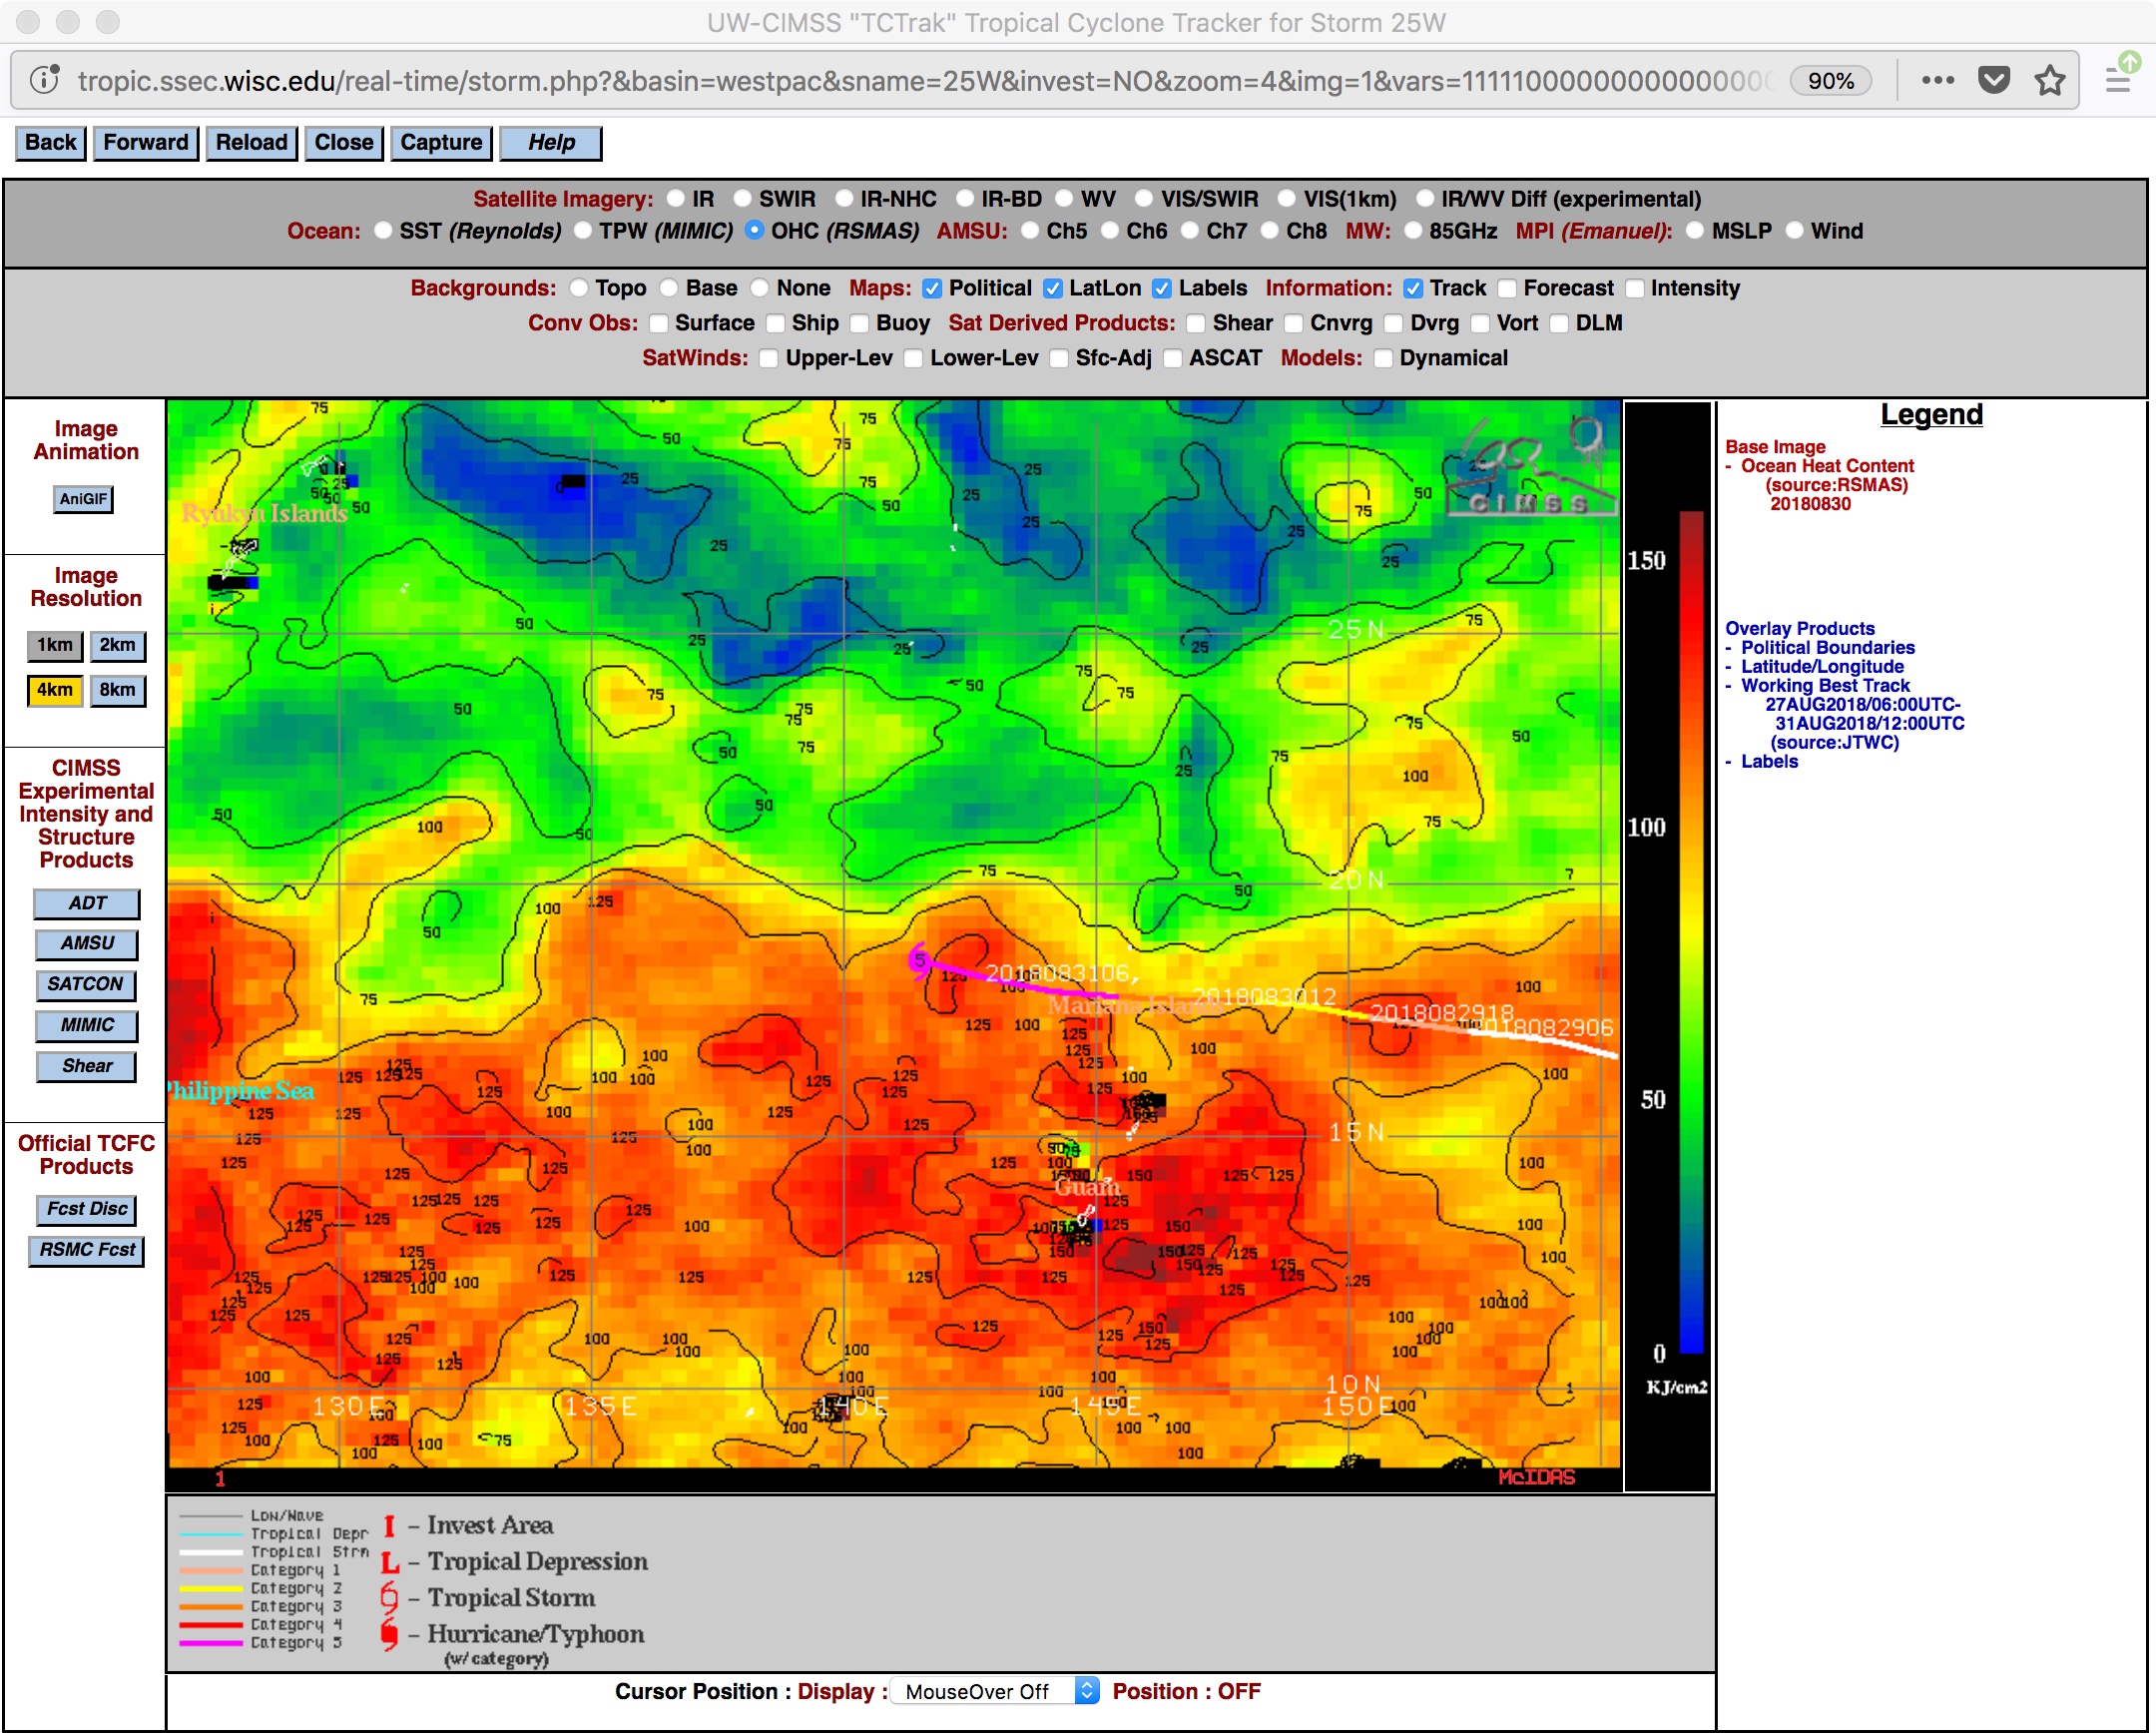
As Jebi tracked west-northwestward across the West Pacific, products from the
CIMSS Tropical Cyclones site showed that it had been moving over waters having high values of
Sea Surface Temperature and
Ocean Heat Content (below).
![Track of Jebi, with Sea Surface Temperature and Ocean Heat Content [click to enlarge]](https://cimss.ssec.wisc.edu/satellite-blog/wp-content/uploads/sites/5/2018/08/180831_sst_ohc_Jebi_anim.gif)
Track of Jebi, with Sea Surface Temperature and Ocean Heat Content [click to enlarge]
A 48-hour animation of the
MIMIC-TC product
(below) showed the evolution of the Jebi from 29-31 August. The storm was completing an eyewall replacement cycle near the end of the animation, with the eye becoming distinctly larger.
In a comparison of DMSP-16 SSMIS Microwave (85 GHz) and Himawari-8 Infrared Window (10.4 µm) images at 1900 UTC (below), the Microwave data helped to better visualize the structure of the large eyewall in addition to a long, narrow feeder band wrapping inward toward the eye.
![DMSP-16 SSMIS Microwave (85 GHz) and Himawari-8 Infrared Window (10.4 µm) images [click to enlarge]](https://cimss.ssec.wisc.edu/satellite-blog/wp-content/uploads/sites/5/2018/08/180831_1900utc_dmsp16_microwave_himawari8_infrared_Jebi_anim.gif)
DMSP-16 SSMIS Microwave (85 GHz) and Himawari-8 Infrared Window (10.4 µm) images [click to enlarge]
View only this post
Read Less


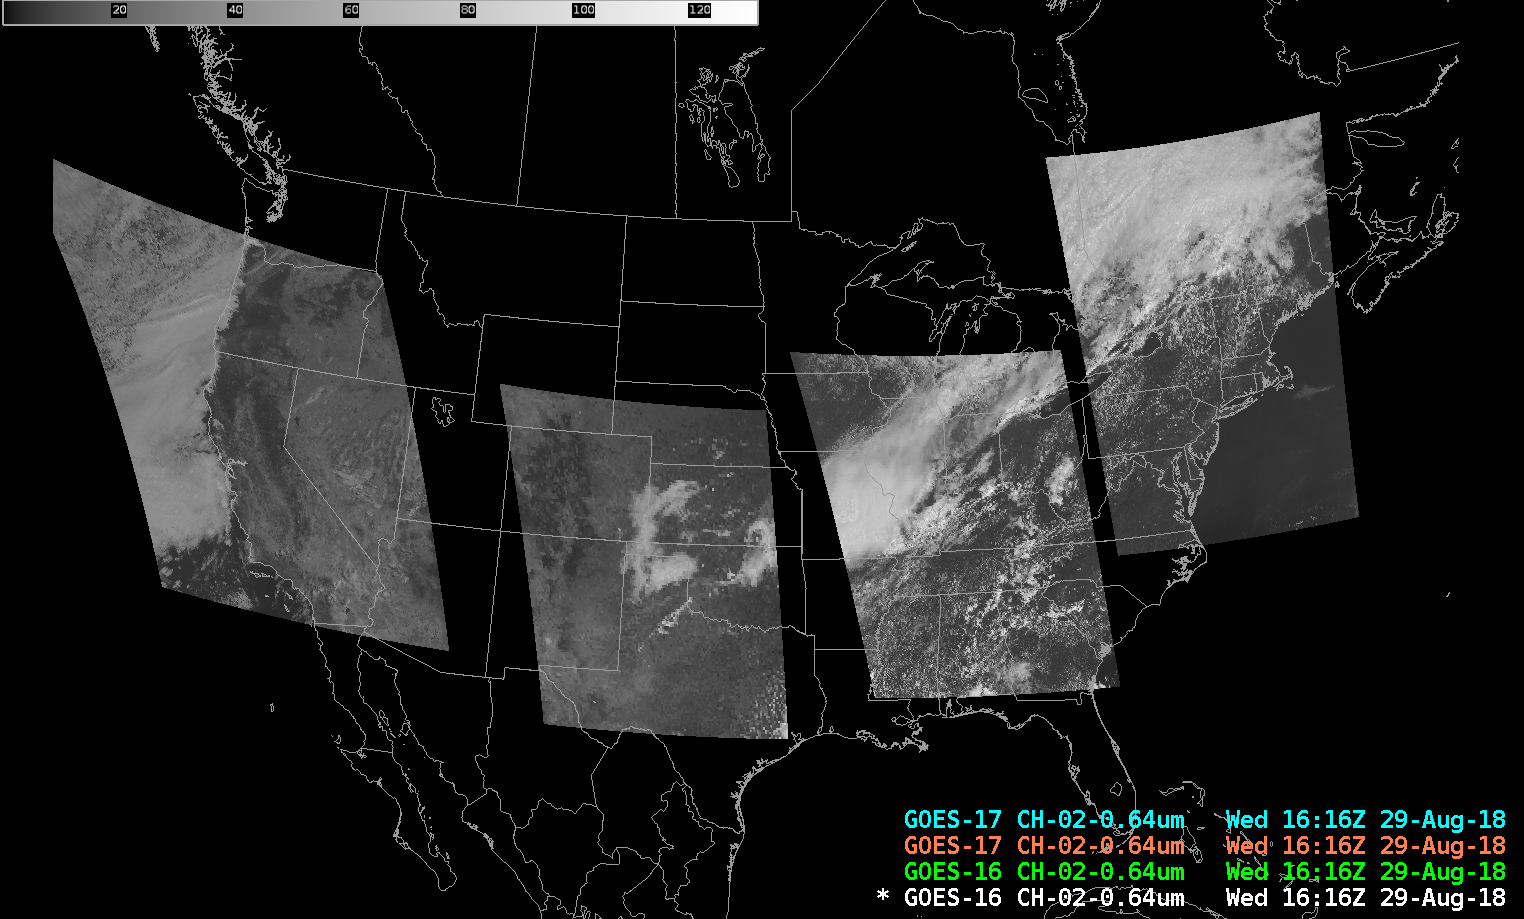
![Visible images from GOES-15 (0.63 µm, left), GOES-17 (0.64 µm, center) and GOES-16 (0.64 µm, right), with SPC storm reports plotted in red [click to play animation | MP4]](https://cimss.ssec.wisc.edu/satellite-blog/wp-content/uploads/sites/5/2018/08/180829_goes15_goes17_goes16_visible_spc_storm_reports_NE_anim.gif)
![Shortwave Infrared images from GOES-15 (3.9 µm, left), GOES-17 (3.9 µm, center) and GOES-16 (3.9 µm, right) [click to play animation | MP4]](https://cimss.ssec.wisc.edu/satellite-blog/wp-content/uploads/sites/5/2018/08/180829_goes15_goes17_goes16_shortwaveIR_WY_fire_anim.gif)
