Rapid Intensification of Hurricane Maria just to the east of the Leeward Islands

GOES-16 “Clean Window” Infrared 10.3 µm imagery, 1600-2017 UTC on 18 September 2017 (Click to animate). Note: The Label states GOES-17 in error, and the time annotation becomes stuck for a time.
GOES-16 data posted on this page are preliminary, non-operational and are undergoing testing
Hurricane Maria underwent rapid intensification on 18 September as it moved through very warm waters to the east of the Leeward Islands. The animation of GOES-16 “Clean Window” Infrared Imagery (10.3 µm), above, shows the rapid development of a warm concentric eye between 1640 and 1940 UTC. The toggle below, between 1600 UTC and 2000 UTC, testifies to a great increase in organization and strength. Click here for an mp4 animation from 1400 UTC to 2100 UTC on 18 September showing the intensification in the Visible (0.64 µm) channel from ABI.
GOES-16 “Clean Window” Infrared 10.3 µm imagery, 1600 and 2017 UTC on 18 September 2017 (Click to enlarge). Note: The Label states GOES-17 in error.
The storm is in an environment of very low shear (below) and moving towards warm water that is quite deep as depicted by large values of Oceanic Heat Content (bottom). (Maps found at this site).
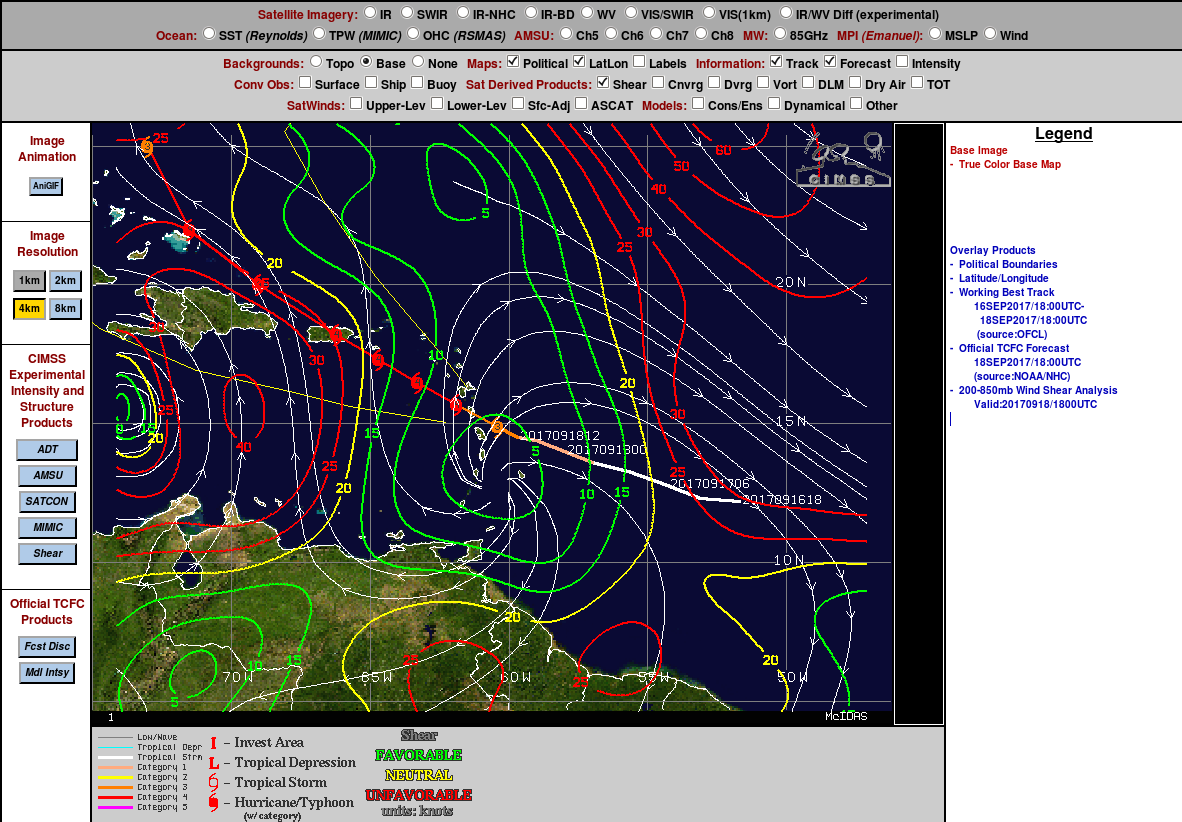
850-250 hPa wind shear, 1800 UTC on 18 September 2017 (Click to enlarge)
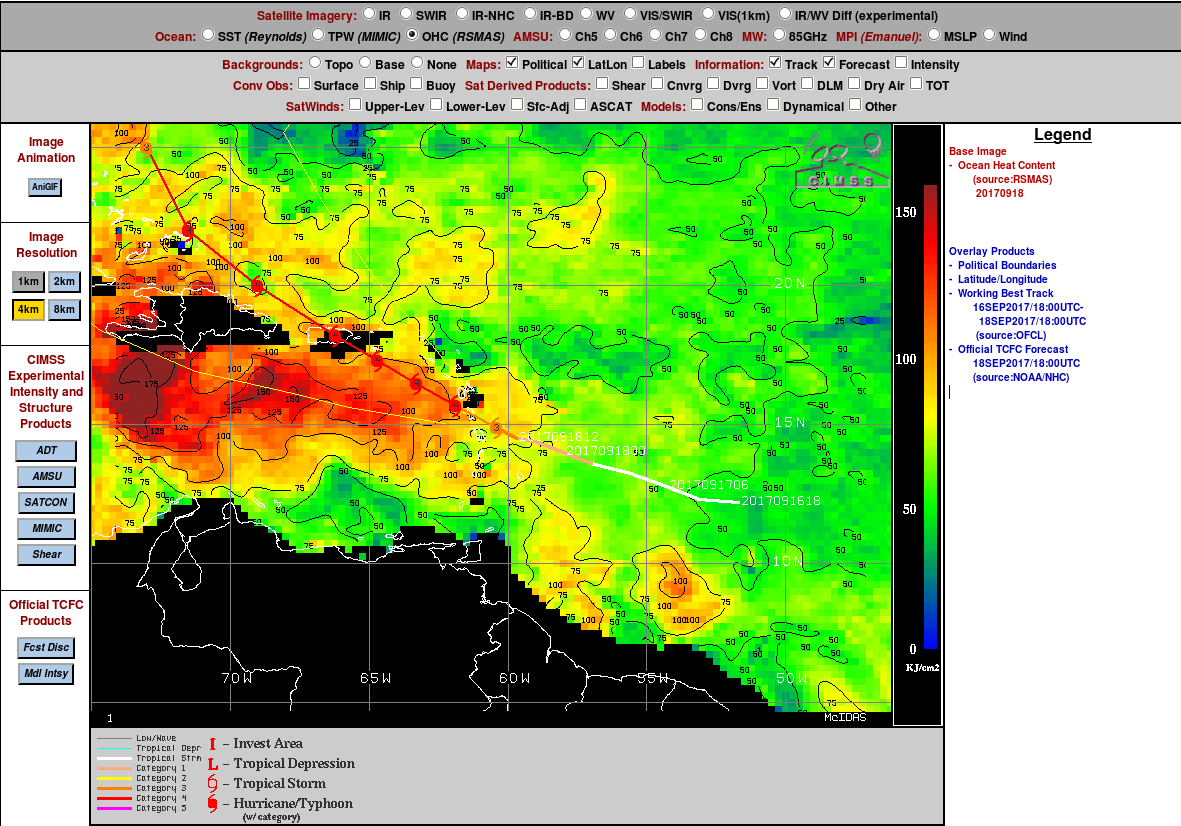
Oceanic Heat Content analysis, 1800 UTC on 18 September 2017. (Click to enlarge). Note the relative cool wake north of the Leeward Islands left behind by Hurricane Irma.
Geostationary Lightning Mapper (GLM) data over Maria for the two hours ending 2045 UTC on 18 September (from this site; click here for infrared imagery), shows lightning within the southern eyewall of the storm.

GLM Group Observations in 3-minute intervals plotted on top of GOES-16 Visible (0.64 µm) Imagery, 1830-2045 UTC on 18 September 2017 (Click to enlarge)
For more information on this dangerous storm, refer to the webpages of the National Hurricane Center, or to the CIMSS Tropical Weather website. People in the Leeward Islands in particular should pay close attention to this storm.