A low moved eastward across the Beaufort Sea on 01 September 2018, bringing a cold front southward across the North Slope and Brooks Range in far northern Alaska (surface analyses). A sequence of Suomi NPP VIIRS Infrared Window (11.45 µm) images (above) showed the clearing of high/cold clouds in the wake... Read More
![Suomi NPP VIIRS Infrared Window (11.45 µm) images on 01 and 02 September [click to enlarge]](https://cimss.ssec.wisc.edu/satellite-blog/wp-content/uploads/sites/5/2018/09/180901_180902_suomi_npp_viirs_InfraredWindow_AK_anim.gif)
Suomi NPP VIIRS Infrared Window (11.45 µm) images on 01 and 02 September [click to enlarge]
A low moved eastward across the Beaufort Sea on 01 September 2018, bringing a cold front southward across the North Slope and Brooks Range in far northern Alaska (
surface analyses). A sequence of Suomi NPP VIIRS Infrared Window (11.45 µm) images
(above) showed the clearing of high/cold clouds in the wake of the frontal passage.
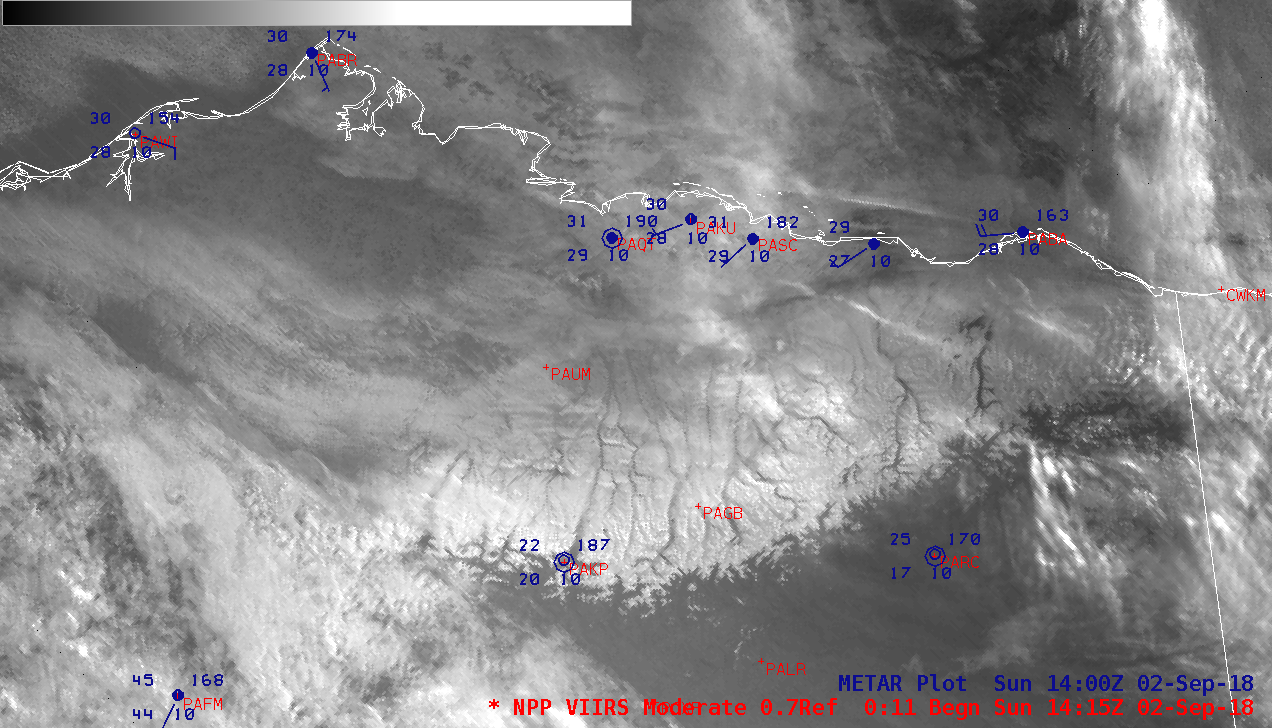
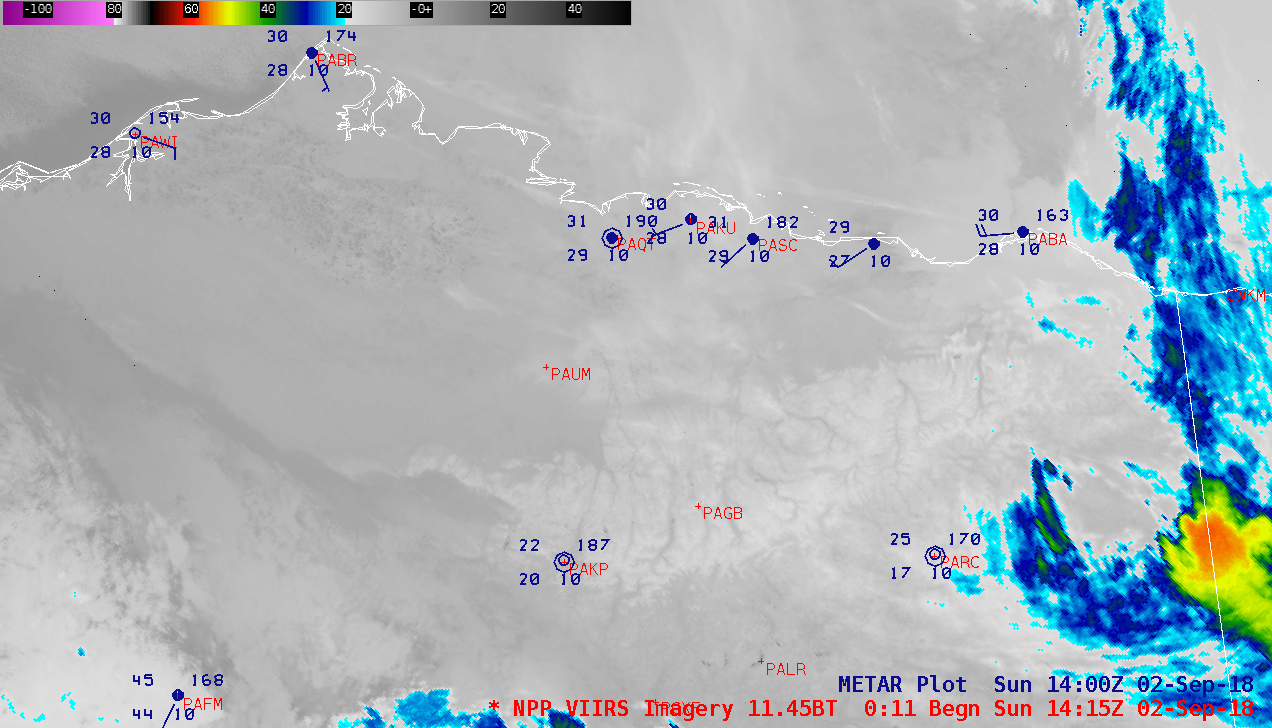
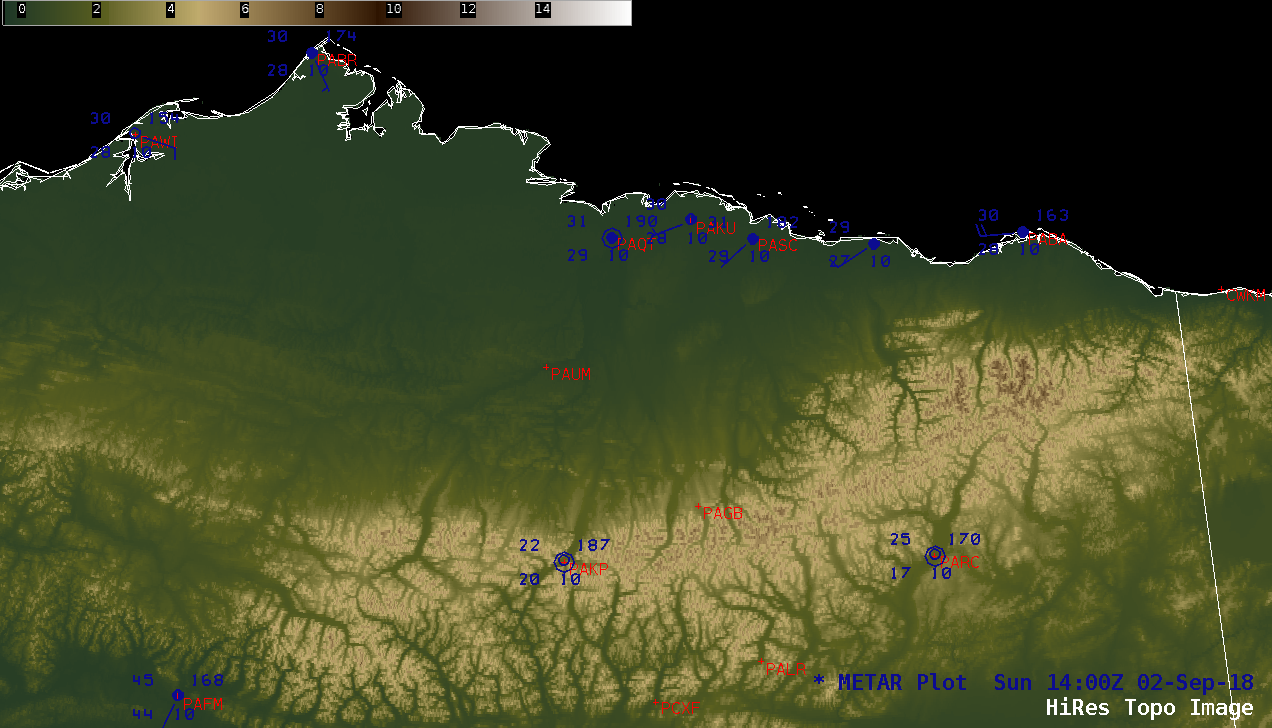
The upslope flow of cold air helped to generate accumulating snowfall across that region — prompting a Winter Storm Warning to be issued for the eastern Brooks Range, where 4-8 inches was expected at higher elevations — and some of the resulting snow cover was seen on a Suomi NPP VIIRS Day/Night Band (0.7 µm) image at 1415 UTC or 6:15 am local time on 02 September (below). A comparison with the corresponding VIIRS Infrared Window (11.45 µm) image and Topography is also shown. The darker shades of brown on the topography image correspond to elevations of 6000-8000 feet in the Brooks Range.
![Suomi NPP VIIRS Day/Night Band (0.7 µm), Infrared Window (11.45 µm) and Topography images [click to enlarge]](https://cimss.ssec.wisc.edu/satellite-blog/wp-content/uploads/sites/5/2018/09/180902_1415utc_suomi_npp_viirs_DayNightBand_InfraredWindow_topography_AK_anim.gif)
Suomi NPP VIIRS Day/Night Band (0.7 µm), Infrared Window (11.45 µm) and Topography images [click to enlarge]
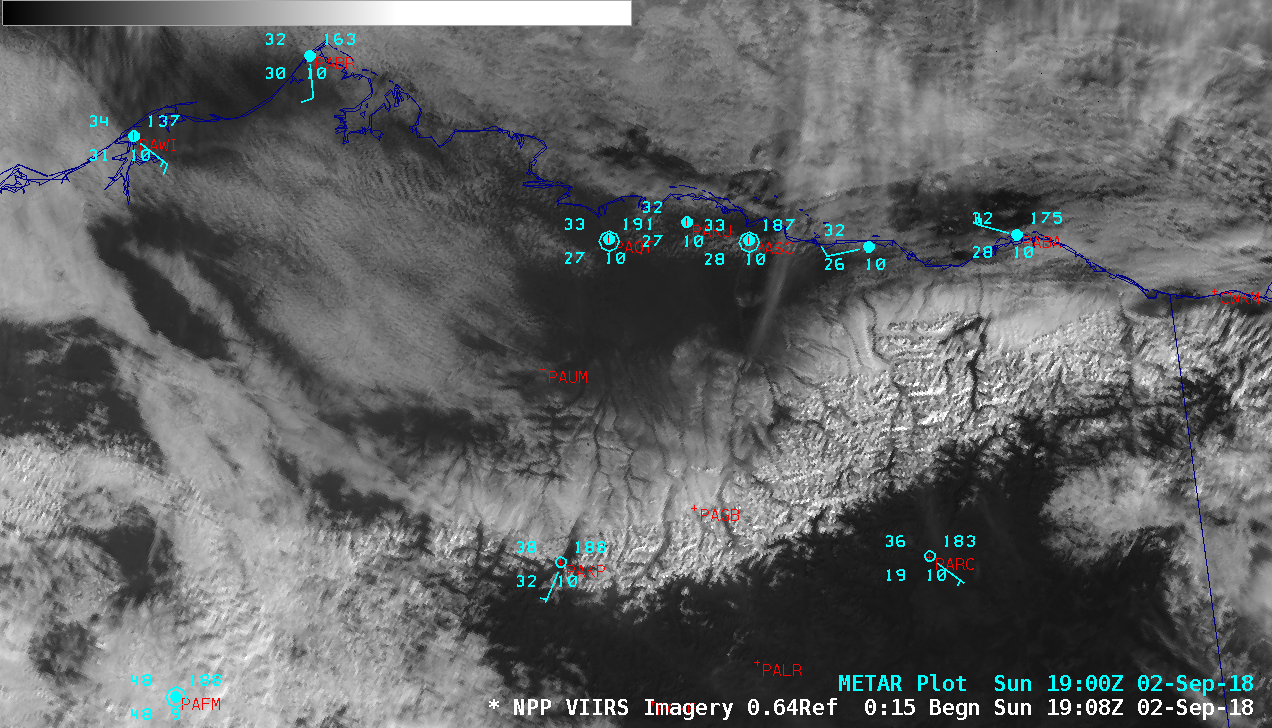
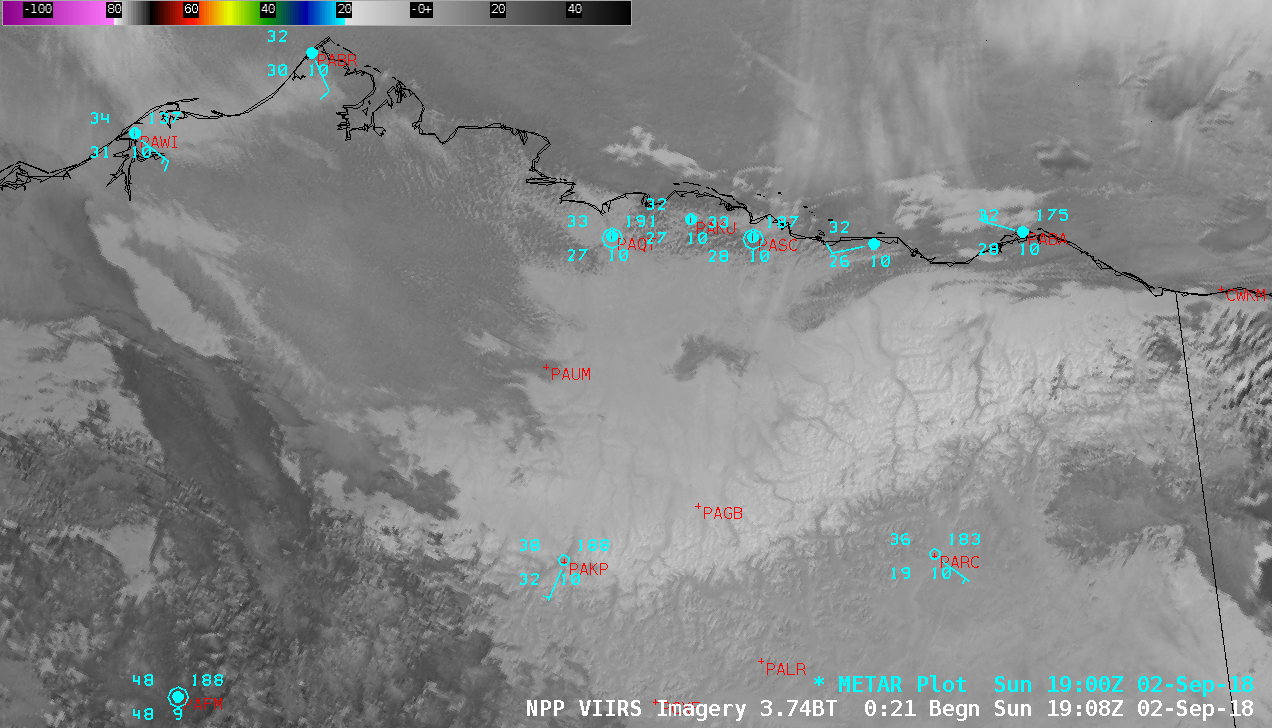
Later in the day on 02 September, additional clearing of patchy low clouds revealed more of the snow cover, as seen in a toggle between VIIRS
Visible (0.64 µm),
Shortwave Infrared (3.74 µm) and Topography images
(below). Supercooled water cloud droplets are efficient reflectors of incoming solar radiation, making patches of low cloud appear
darker shades of gray on the Shortwave Infrared image (helping to identify low clouds over snow cover).
![Suomi NPP VIIRS Visible (0.64 µm), Shortwave Infrared (3.74 µm) and Topography images [click to enlarge]](https://cimss.ssec.wisc.edu/satellite-blog/wp-content/uploads/sites/5/2018/09/180902_1924utc_suomi_npp_viirs_visible_shortwaveInfrared_topography_AK_anim.gif)
Suomi NPP VIIRS Visible (0.64 µm), Shortwave Infrared (3.74 µm) and Topography images [click to enlarge]
At 2124 UTC (or 1:24 pm local time), a 30-meter resolution Landsat-8 False Color Red-Green-Blue (RGB) image viewed using
RealEarth (below) provided a more detailed view of a portion of the snow cover. Snow and ice appear as shades of cyan in this type of RGB image — which is created by combining Landsat bands 6 (1.61 µm), 5 (0.865 µm), and 4 (0.655 µm) as Red, Green, and Blue — and numerous small ice floes can also be seen off the coast.
![Landsat-8 False Color RGB image [click to enlarge]](https://cimss.ssec.wisc.edu/satellite-blog/wp-content/uploads/sites/5/2018/09/180902_2124utc_landsat8_falsecolor_AK.jpeg)
Landsat-8 False Color RGB image [click to enlarge]
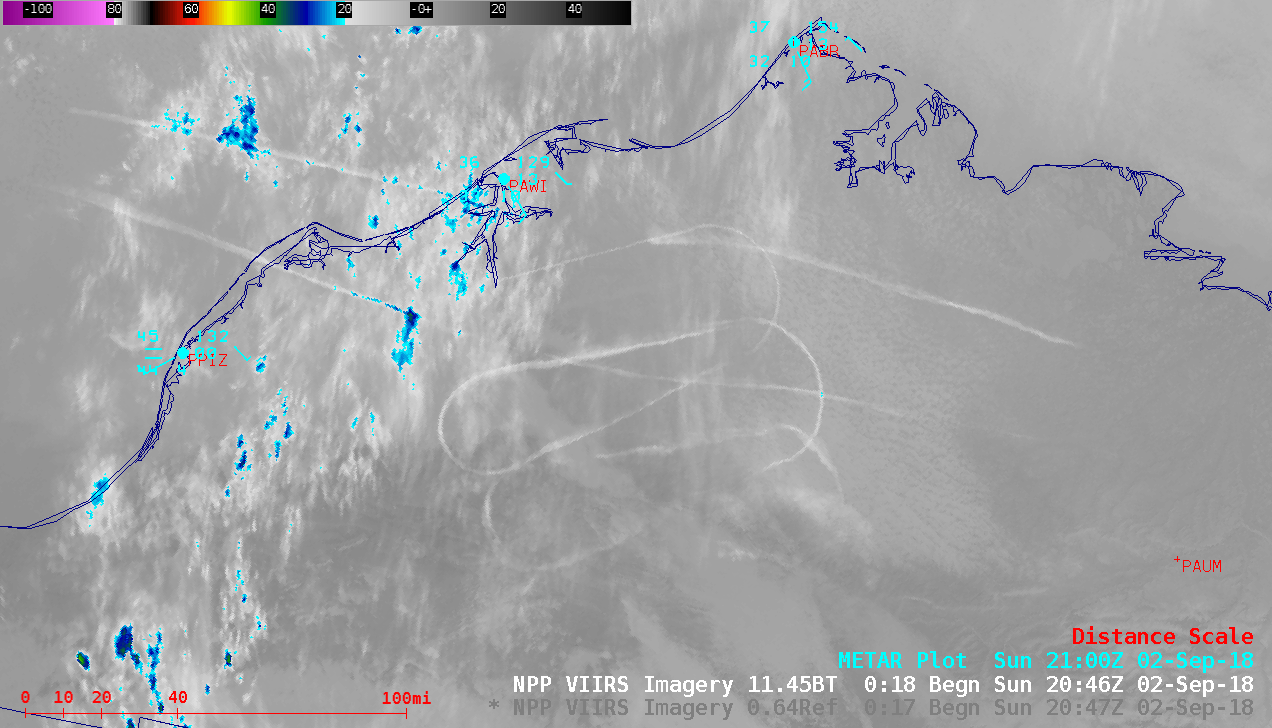
On a side note, farther to the west an interesting pattern of contrails was seen in VIIRS
Visible and
Infrared Window images at 2046 UTC
(below). On the Visible image, note that the darker contrail shadows cast onto the surface are displaced about 15 miles to the north (due to the low sun angle); the contrail features exhibited Infrared brightness temperatures of -10 to -15ºC. These contrail patterns were generated by military aircraft performing training exercises: similar features have been noted over
California and
North Dakota.
![Suomi NPP VIIRS Visible (0.64 µm) and Infrared Window (11.45 µm) images [click to enlarge]](https://cimss.ssec.wisc.edu/satellite-blog/wp-content/uploads/sites/5/2018/09/180902_suomiNPP_viirs_visible_infrared_contrails_AK_anim.gif)
Suomi NPP VIIRS Visible (0.64 µm) and Infrared Window (11.45 µm) images [click to enlarge]
A curved portion of one of these contrails was seen on web camera images looking south from Atqasuk
(below).
View only this post
Read Less
![NOAA-20 Day/Night Band (0.7 µm) and Infrared Window (11.45 µm) images [click to enlarge]](https://cimss.ssec.wisc.edu/satellite-blog/wp-content/uploads/sites/5/2018/09/180903_0636utc_noaa20_DayNightBand_InfraredWindow_ptc7_anim.gif)
![Suomi NPP VIIRS Day/Night Band (0.7 µm) and Infrared Window (11.45 µm) images [click to enlarge]](https://cimss.ssec.wisc.edu/satellite-blog/wp-content/uploads/sites/5/2018/09/180903_0726utc_suomiNPP_DayNightBand_InfraredWindow_ptc7_anim.gif)

![GOES-16 Rain Rate product [click to play MP4 animation]](https://cimss.ssec.wisc.edu/satellite-blog/wp-content/uploads/sites/5/2018/09/gordon_rr-20180904_180035.png)
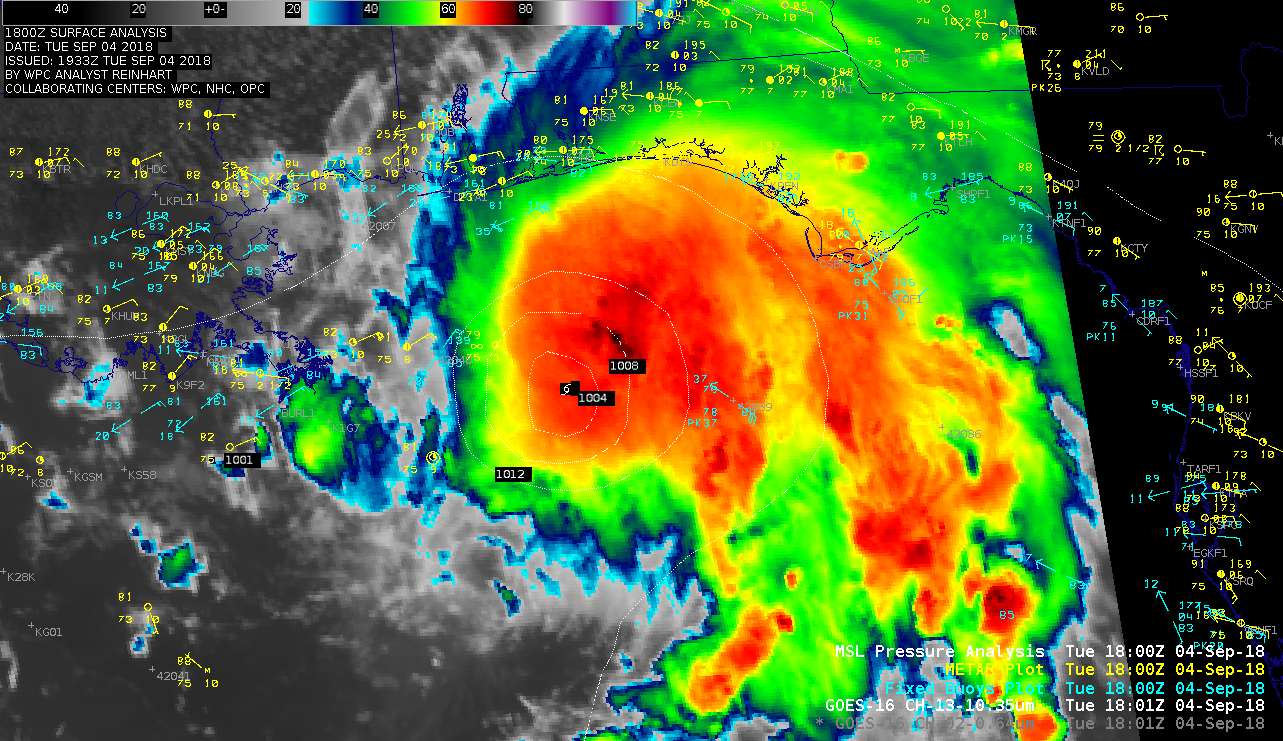
![GOES-16 Rain Rate product with Metop ASCAT winds [click to enlarge]](https://cimss.ssec.wisc.edu/satellite-blog/wp-content/uploads/sites/5/2018/09/gordon_rr_ascat-20180904_161535.png)

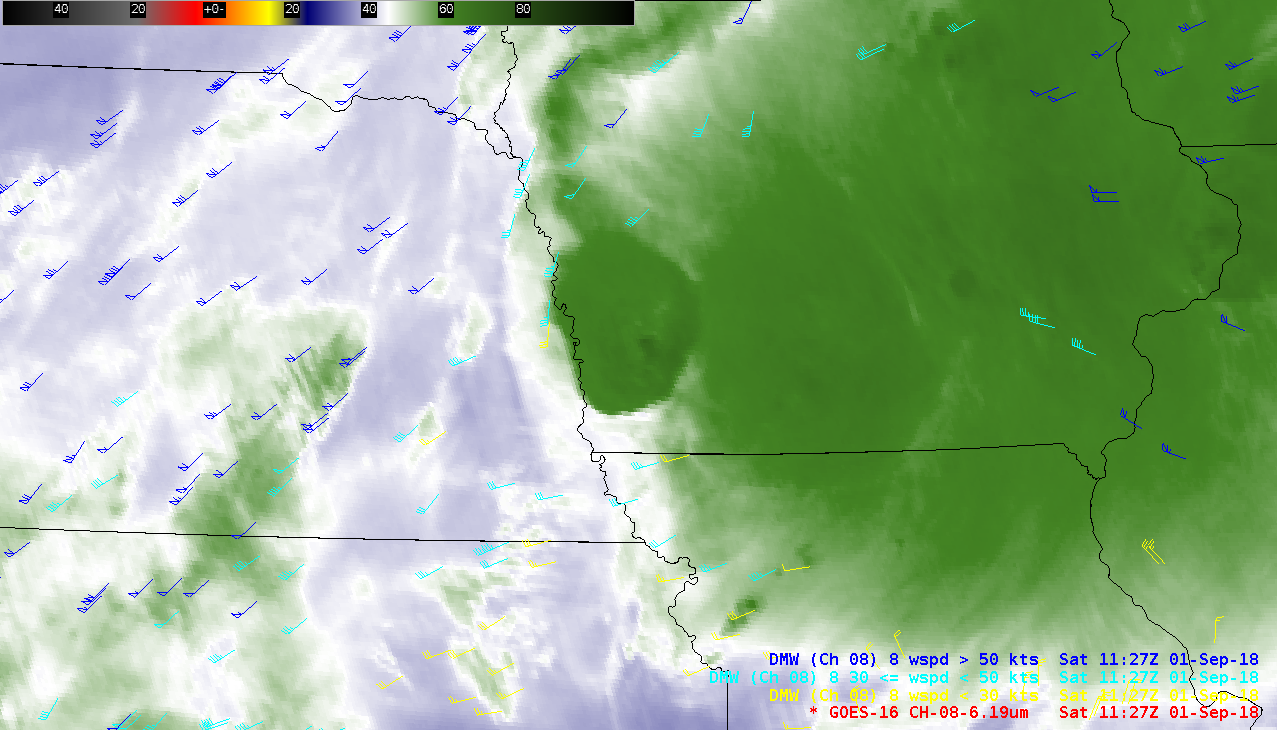
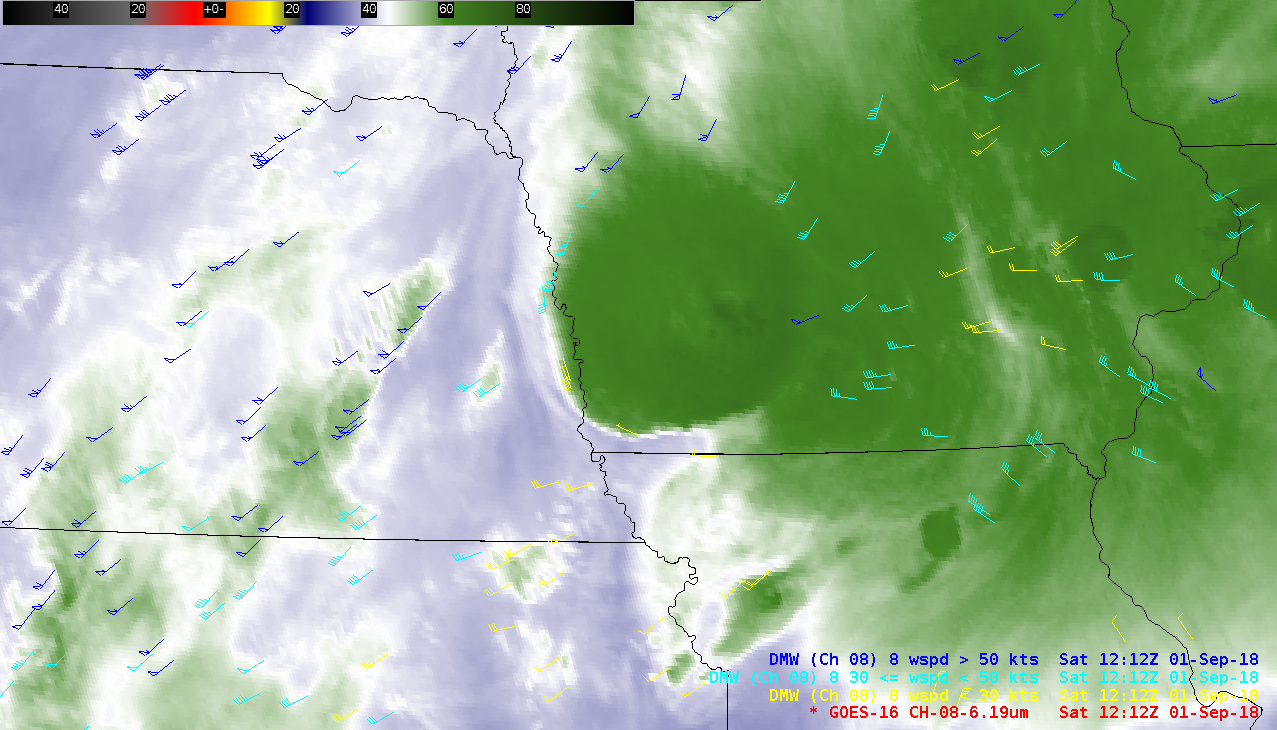
![GOES-16 Upper-level Water Vapor (6.2 µm) images [click to play MP4 animation]](https://cimss.ssec.wisc.edu/satellite-blog/wp-content/uploads/sites/5/2018/09/180901_goes16_water_vapor_anim.gif)
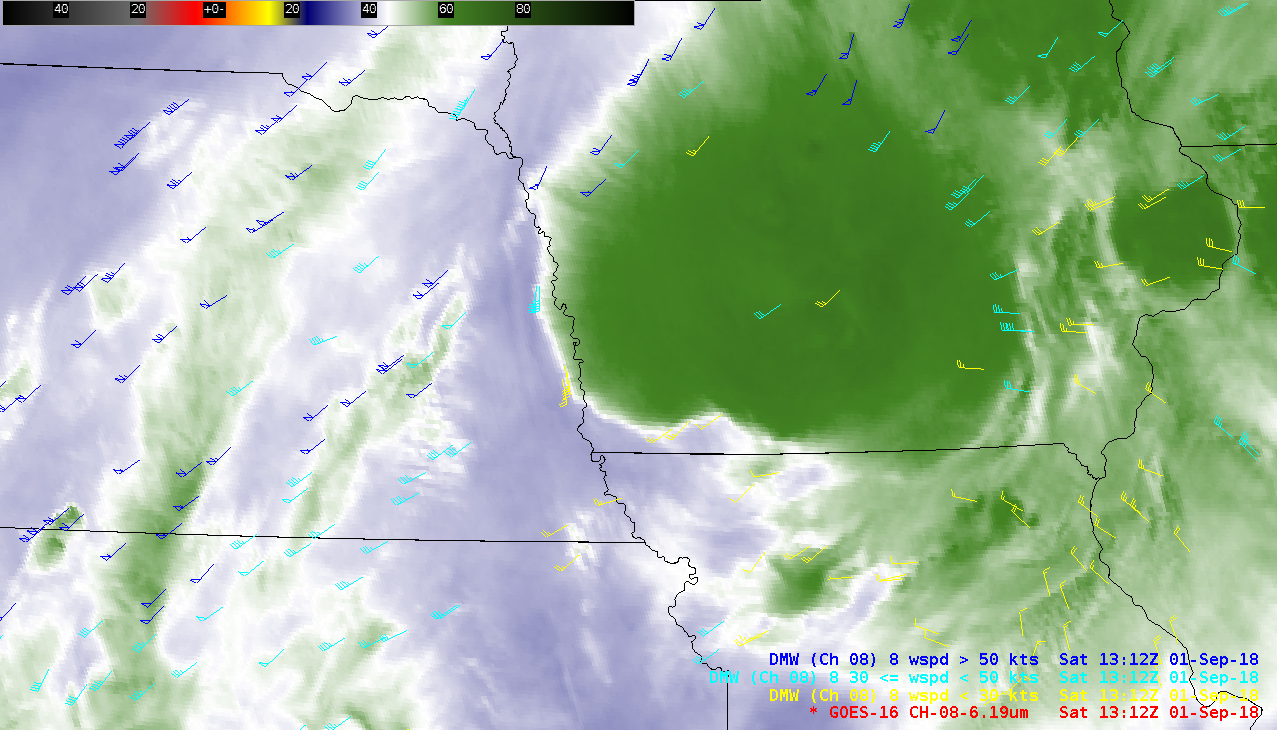
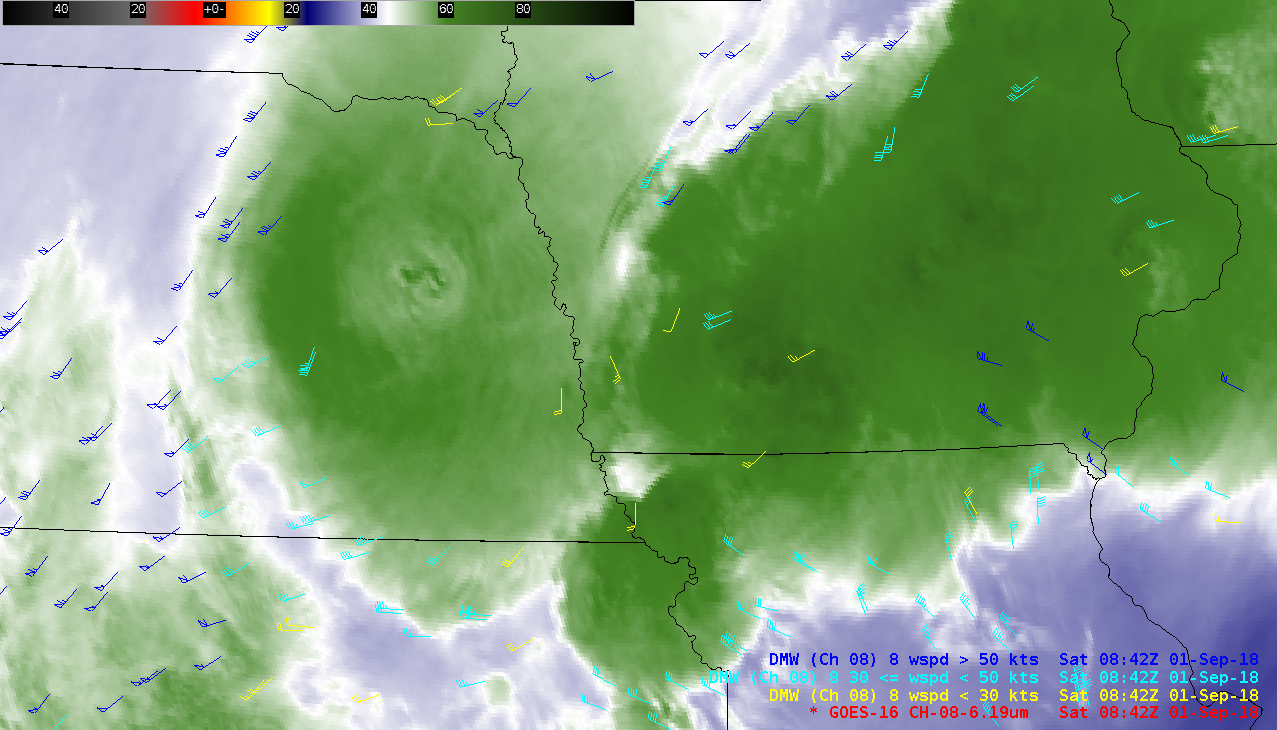
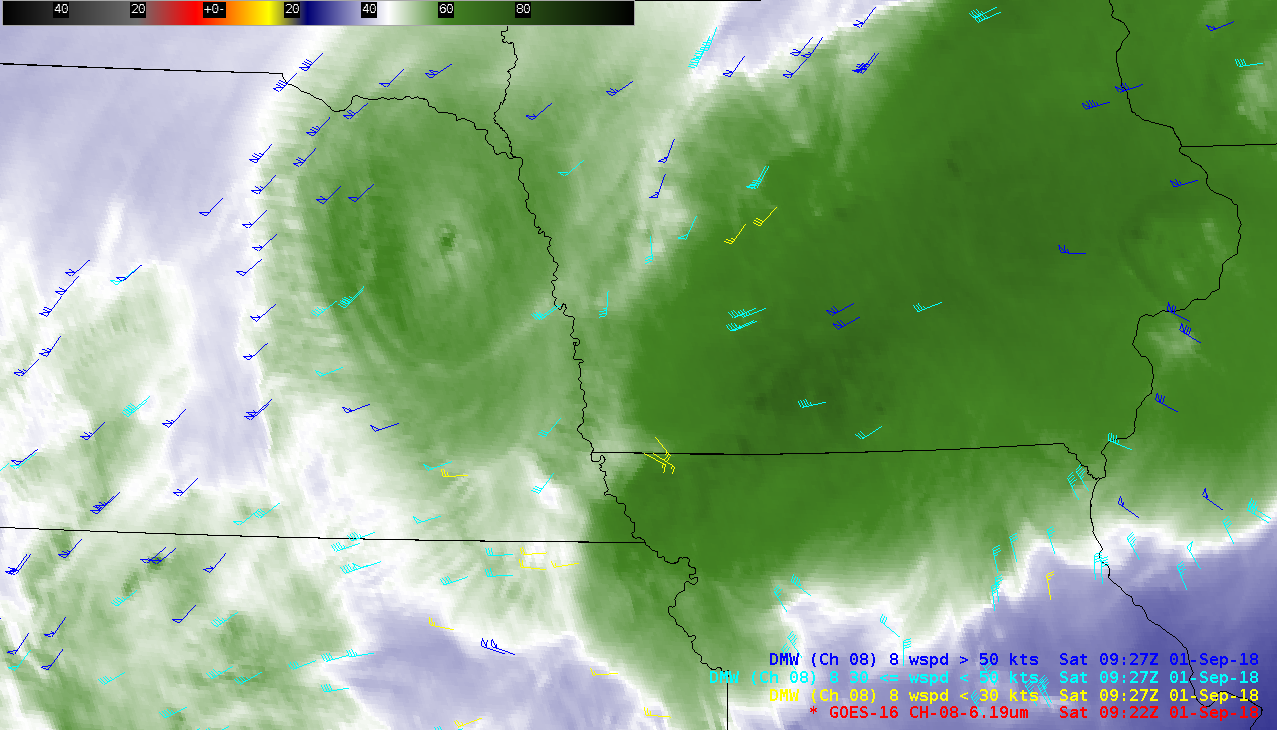
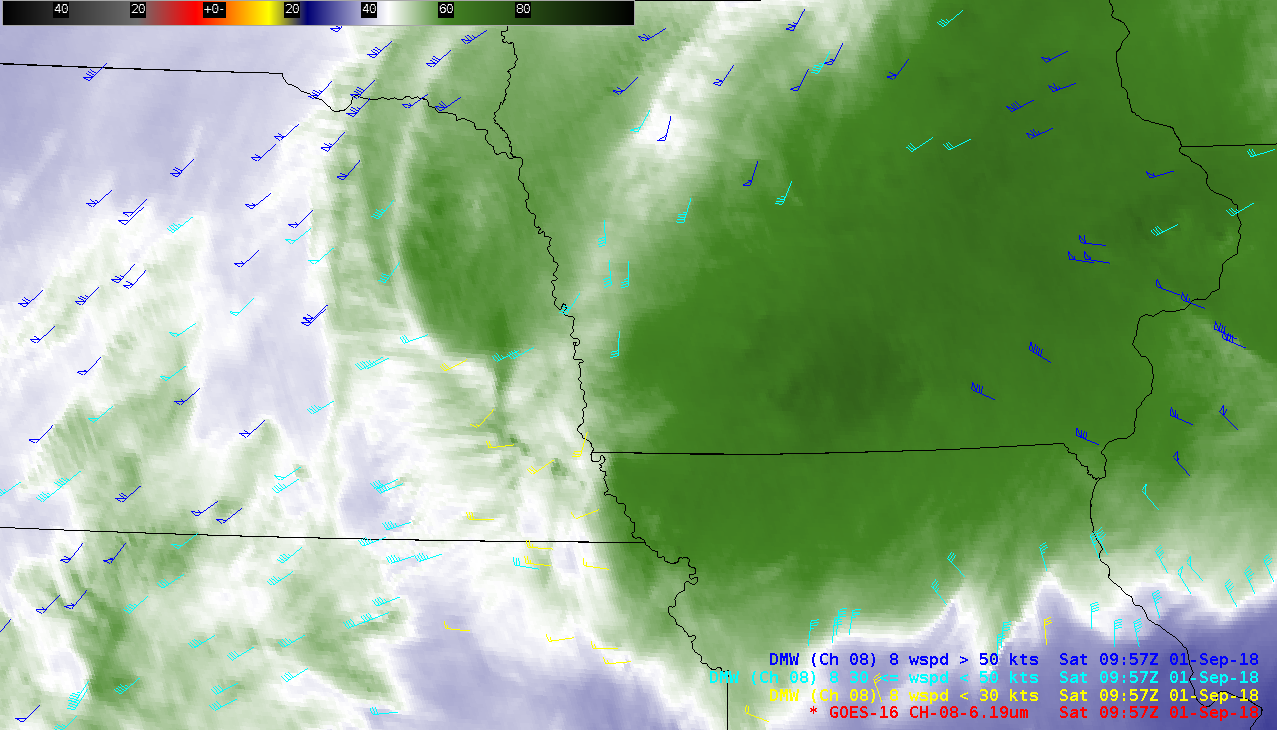
![GOES-16 Upper-level Water Vapor (6.2 µm) images, with plots of Derived Motion Winds [click to play MP4 animation]](https://cimss.ssec.wisc.edu/satellite-blog/wp-content/uploads/sites/5/2018/09/mcs_wv8_winds-20180901_131218.png)
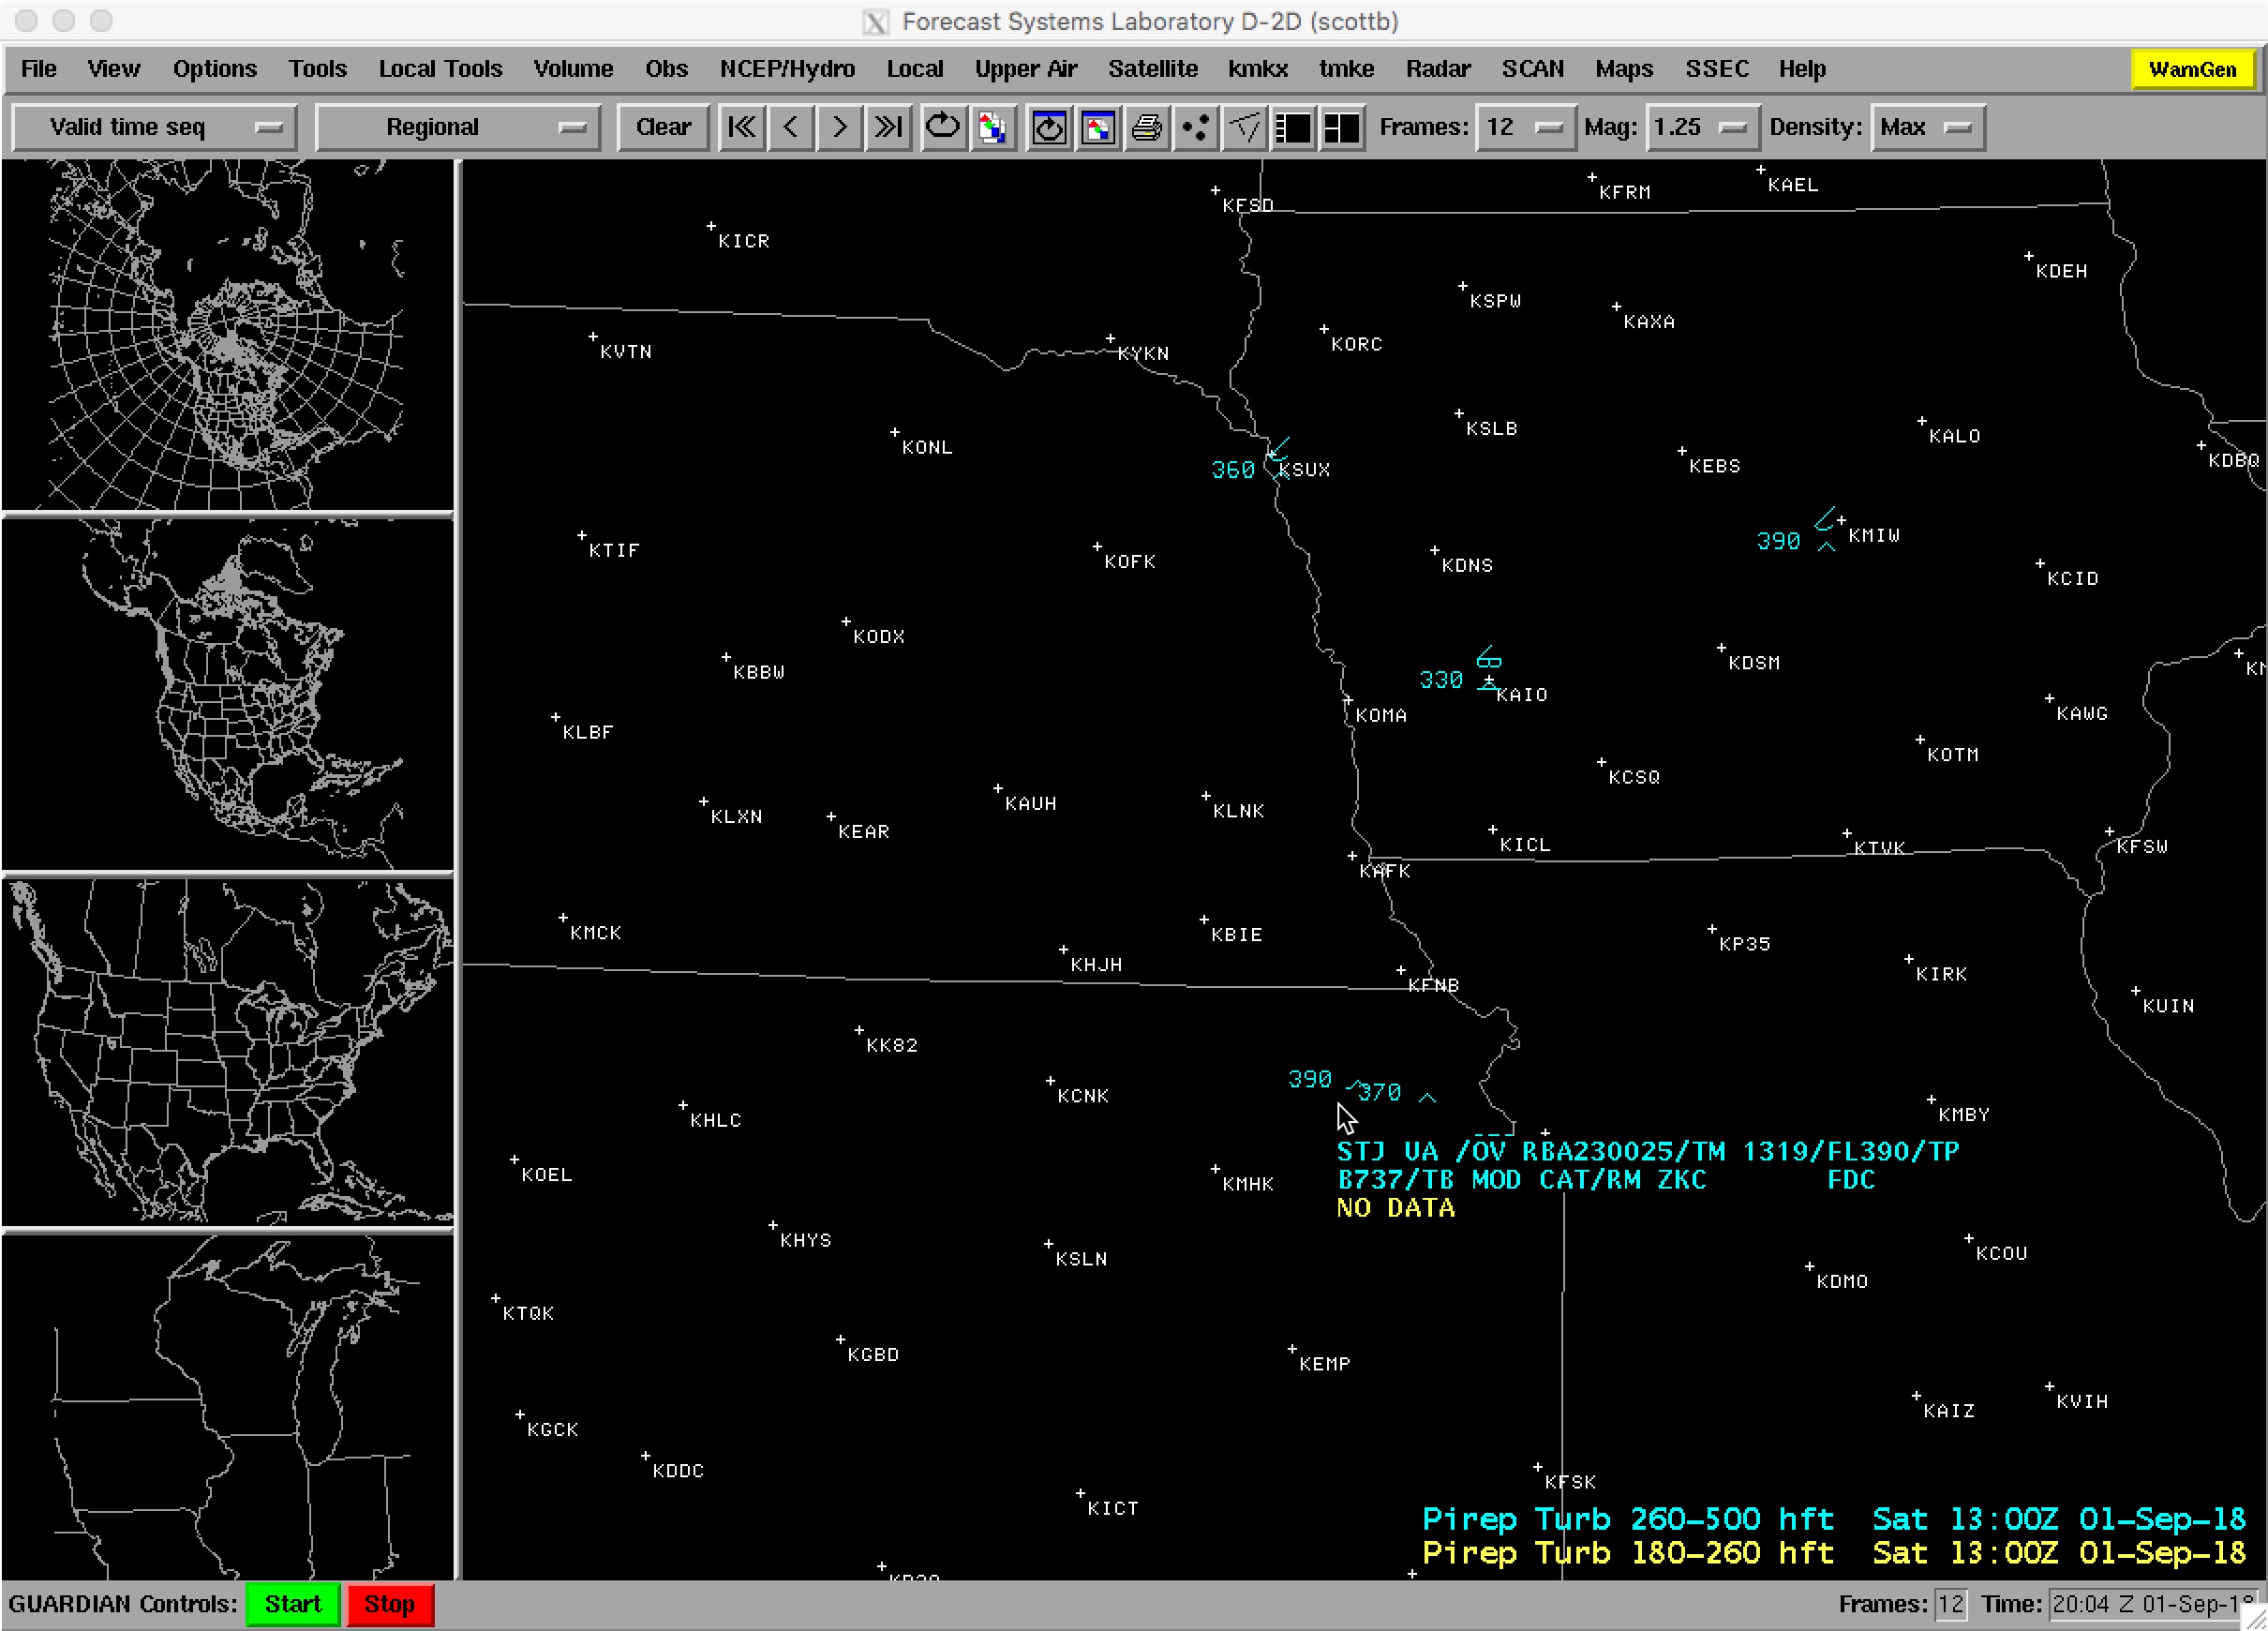
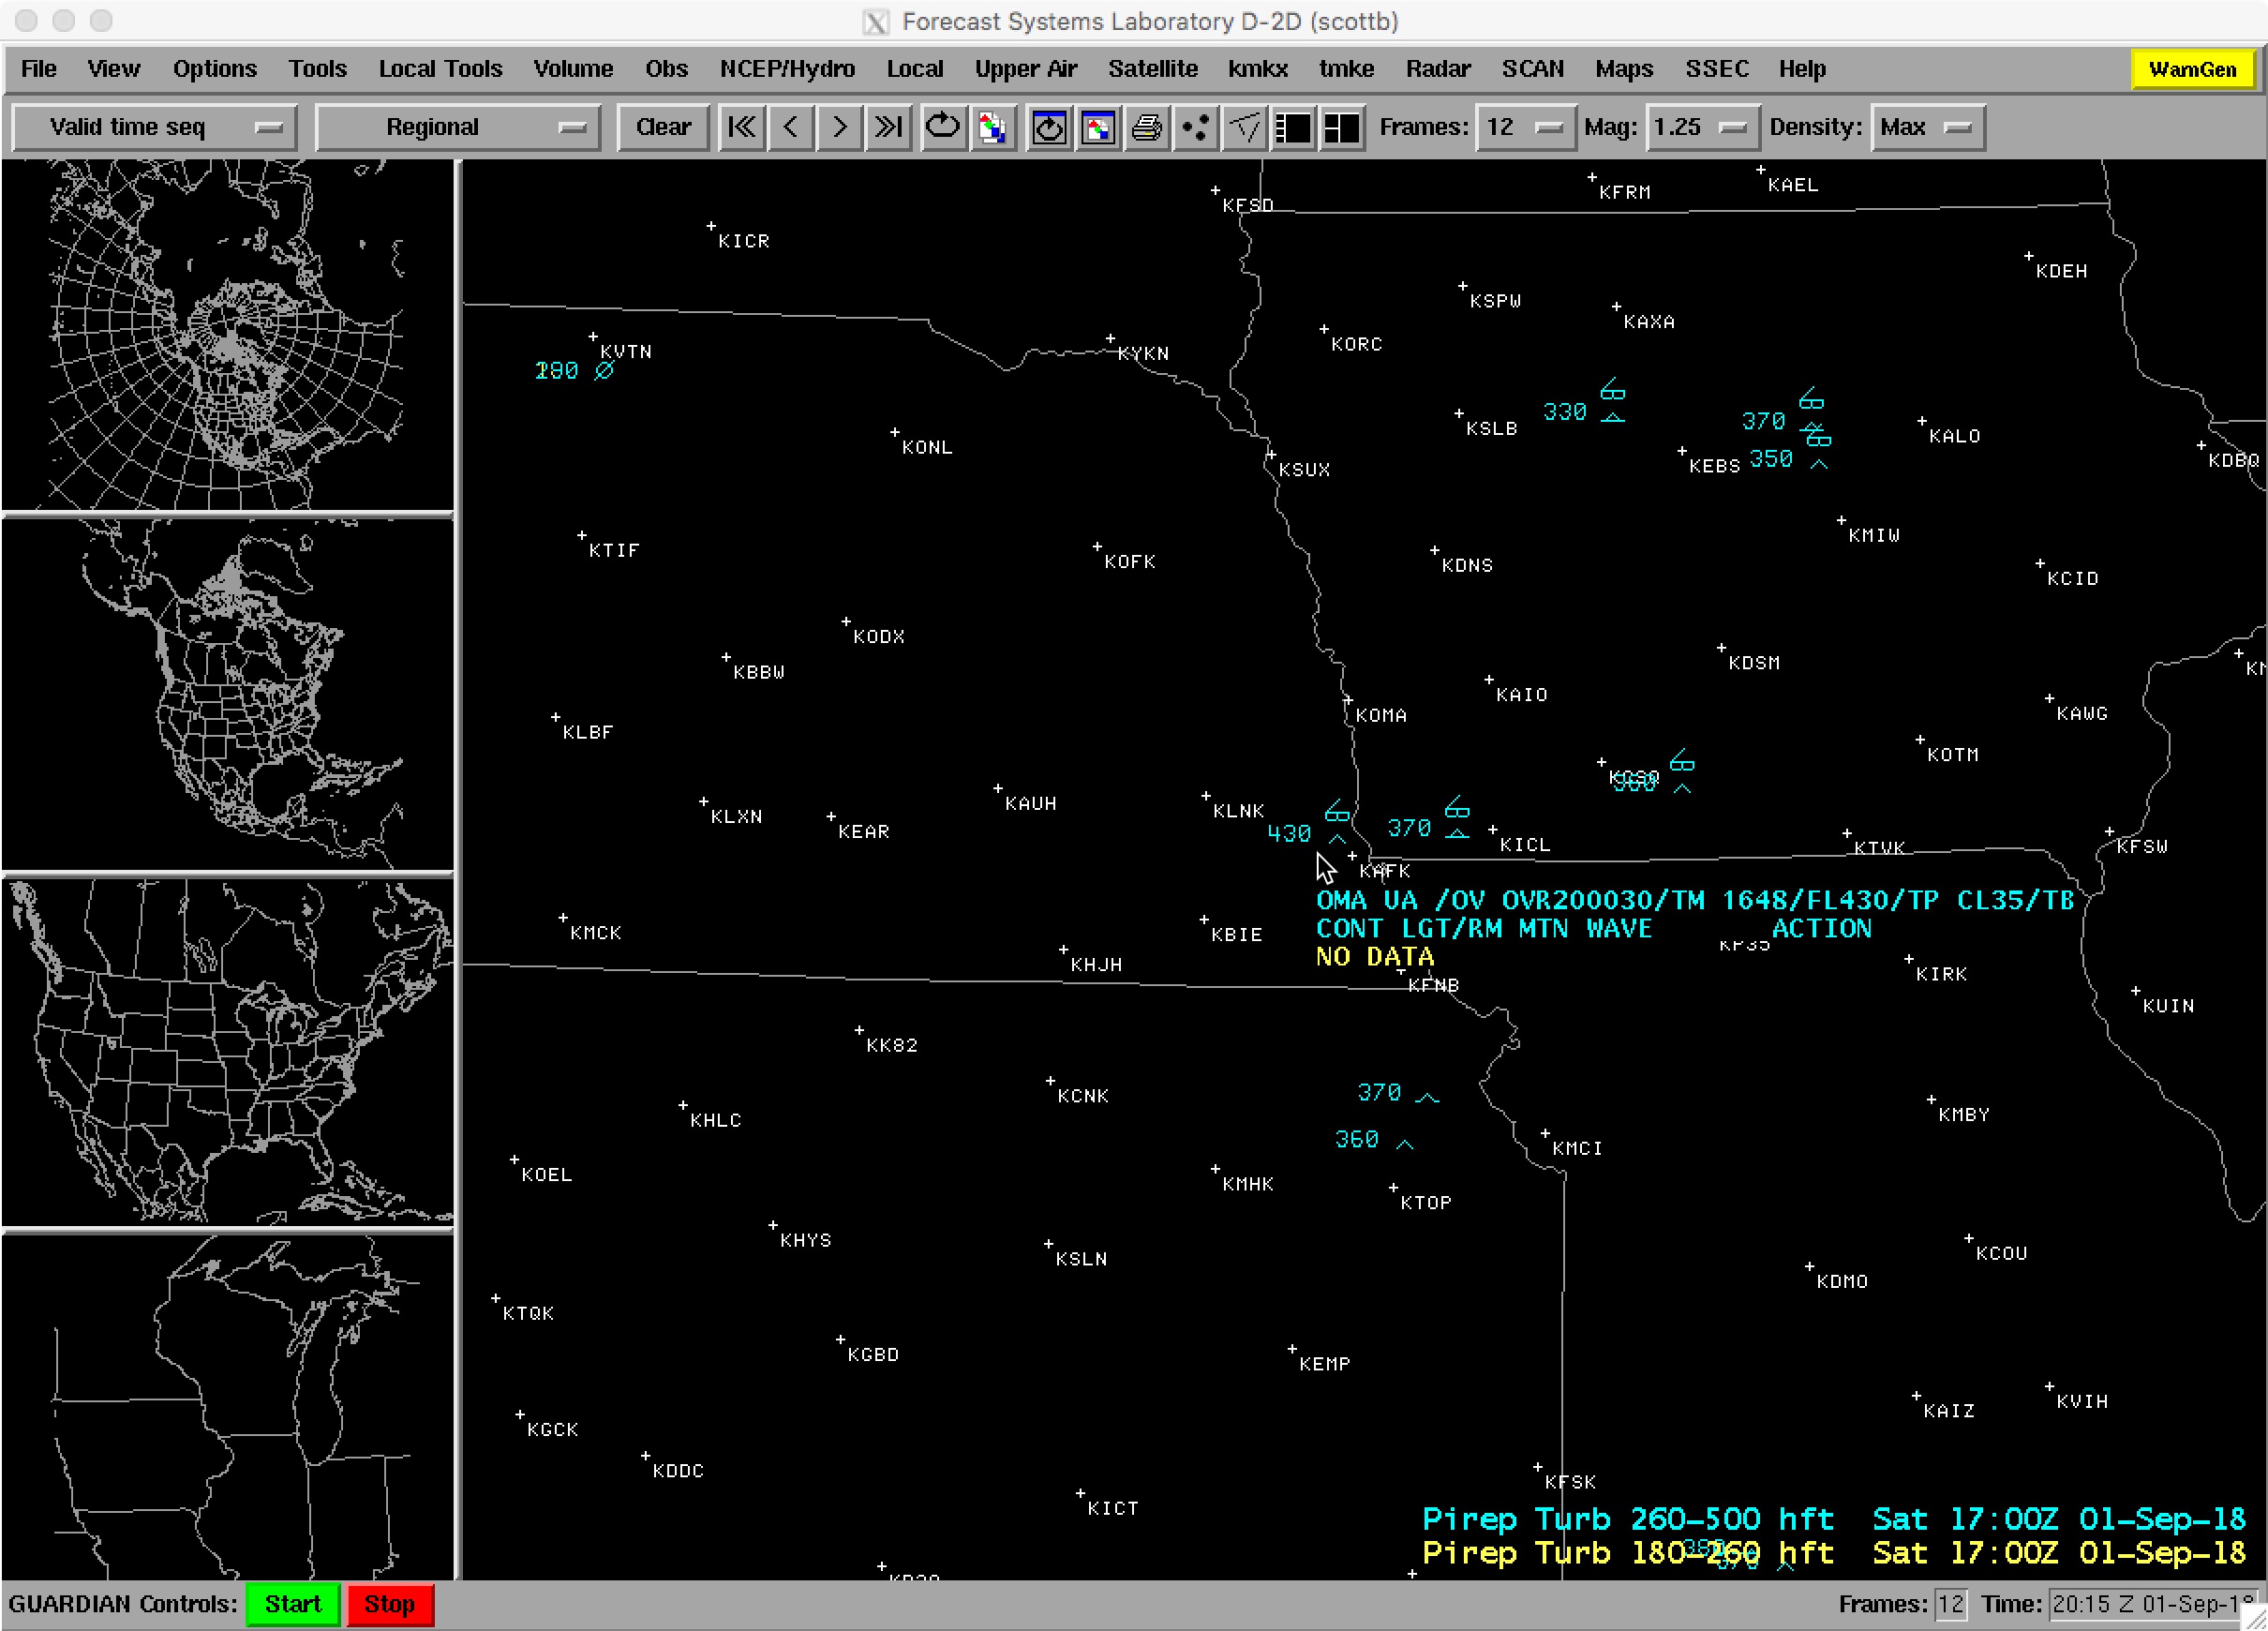
![Pilot reports of turbulence [click to play animation]](https://cimss.ssec.wisc.edu/satellite-blog/wp-content/uploads/sites/5/2018/09/180901_pilot_reports_turbulence_anim.gif)
![Suomi NPP VIIRS Day/Night Band (0.7 µm) and Infrared Window (11.45 µm) images, with plots of SPC storm reports [click to enlarge]](https://cimss.ssec.wisc.edu/satellite-blog/wp-content/uploads/sites/5/2018/09/180901_0755utc_suomiNPP_viirs_DayNightBand_InfraredWindow_anim.gif)
![NOAA-20 VIIRS Day/Night Band (0.7 µm) and Infrared Window (11.45 µm) images [click to enlarge]](https://cimss.ssec.wisc.edu/satellite-blog/wp-content/uploads/sites/5/2018/09/180901_0845utc_noaa20_viirs_DayNightBand_InfraredWindow_anim.gif)
