* GOES-17 images shown here are preliminary and non-operational *The first official temperature of -50ºF or colder during Alaska’s 2018/2019 winter season was reported by the cooperative observer at Chicken on 06 January — the 24-hour high temperature at that site was -45ºF, with a low of -51ºF (NWS Fairbanks summary). A... Read More
![Suomi NPP VIIRS Infrared Window (11.45 µm) images [click to enlarge]](https://cimss.ssec.wisc.edu/satellite-blog/wp-content/uploads/sites/5/2019/01/190106_suomiNPP_viirs_infrared_Chicken_AK_anim.gif)
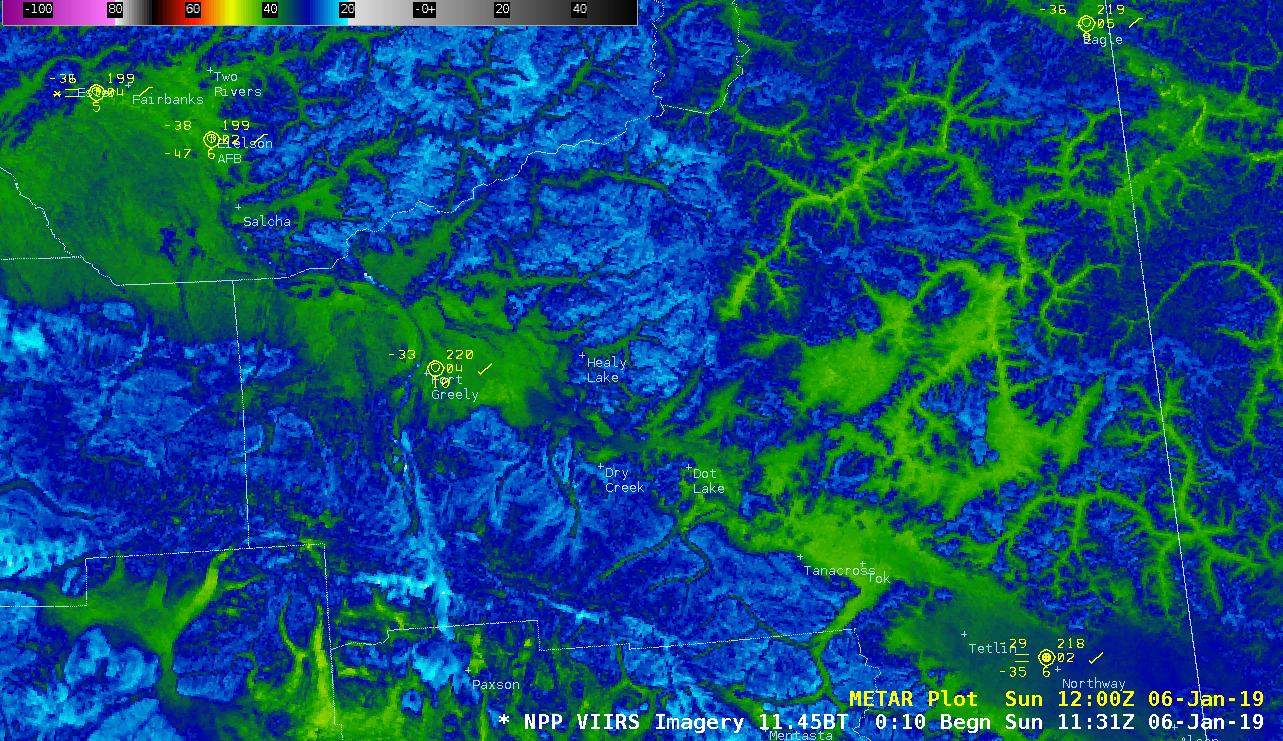
Suomi NPP VIIRS Infrared Window (11.45 µm) images [click to enlarge]
* GOES-17 images shown here are preliminary and non-operational *
The first official temperature of -50ºF or colder during Alaska’s 2018/2019 winter season was reported by the cooperative observer at Chicken on 06 January — the 24-hour high temperature at that site was -45ºF, with a low of -51ºF (NWS Fairbanks summary). A sequence of Suomi NPP VIIRS Infrared Window (11.45 µm) images (above) showed infrared brightness temperatures as cold as -46.5ªC or -51.7ºF (lighter green enhancement) in the river valleys between Tok and Eagle (Chicken is located about midway between those 2 cities).
A toggle between Infrared Window images from Suomi NPP VIIRS and GOES-17 (below) highlighted the advantage of polar-orbiting imagery at high latitudes — improved spatial resolution and a better viewing angle provides more detailed images. However, it should be noted that the Full Disk GOES-17 imagery that is displayed here using AWIPS is degraded from 2-km to 4-km resolution (at satellite sub-point).
![Infrared Window images from Suomi NPP VIIRS (11.45 µm) and GOES-17 (10.3 µm) [click to enlarge]](https://cimss.ssec.wisc.edu/satellite-blog/wp-content/uploads/sites/5/2019/01/190106_1130utc_suomiNPP_viirs_goes17_infrared_Chicken_AK_anim.gif)
Infrared Window images from Suomi NPP VIIRS (11.45 µm) and GOES-17 (10.3 µm) [click to enlarge]
A sequence of NOAA-20 VIIRS Infrared images displayed using
RealEarth is shown below. The majority of the scene was cloud-free — except for some cyan-enhanced stratiform clouds moving eastward across parts of the Alaska Range — and although there was some slight diurnal warming seen in the higher terrain, little change was apparent with the signature of colder air
(shades of green) that was trapped in the lower elevations and river valleys.
![NOAA-20 VIIRS Infrared Window (11.45 µm) images [click to enlarge]](https://cimss.ssec.wisc.edu/satellite-blog/wp-content/uploads/sites/5/2019/01/190106_noaa20_viirs_infrared_AK_anim.gif)
NOAA-20 VIIRS Infrared Window (11.45 µm) images [click to enlarge]
Plots of Fairbanks rawinsonde data from 00 UTC on 06 and 07 January
(below) displayed the strong low-level temperature inversion caused by the relatively shallow arctic air.
![Plots of Fairbanks rawinsonde data from 00 UTC on 06 and 07 January [click to enlarge]](https://cimss.ssec.wisc.edu/satellite-blog/wp-content/uploads/sites/5/2019/01/190106_190107_00utc_pafa_raobs_anim.gif)
Plots of Fairbanks rawinsonde data from 00 UTC on 06 and 07 January [click to enlarge]
===== 07 January Update =====
![Infrared Window images from GOES-17 ABI (10.33 µm) and Suomi NPP VIIRS (11.45 µm) [click to enlarge]](https://cimss.ssec.wisc.edu/satellite-blog/wp-content/uploads/sites/5/2019/01/190107_1926utc_goes17_suomiNPP_viirs_infrared_1_AK_anim.gif)
Infrared Window images from GOES-17 ABI (10.33 µm) and Suomi NPP VIIRS (11.45 µm) [click to enlarge]
Minimum temperatures of -50ºF and colder were again reported on 07 January, with lows of -56ºF at Chicken and -50ºF at North Pole (
NWS Fairbanks summary). 1-minute imagery from a GOES-17
Mesoscale Domain Sector allowed for a more direct full-resolution comparison with Suomi NPP VIIRS imagery — and a toggle between 1926 UTC images
(above) revealed significantly greater detail in terms of the cold air confined to river valleys on the VIIRS image. The enhancements used in this comparison have identical temperature ranges for each of the color segments (there are some color vs. temperature offsets with the GOES/VIIRS infrared comparison shown on the previous day). The coldest infrared brightness temperature values on the VIIRS image were -46.4ºC in the vicinity of Tok, Alaska and -49.4ºC across the Canadian border in Yukon — compared to -44.6ºC and -45.1ºC for those two locations on the GOES-17 image.
View only this post
Read Less
![GOES-17 Low-level (7.3 µm), Mid-level (6.9 µm) and Upper-level (6.2 µm) Water Vapor images [click to play MP4 animation]](https://cimss.ssec.wisc.edu/satellite-blog/wp-content/uploads/sites/5/2019/01/G17_WV_EPAC_B9_07JAN2019_2019007_235719_GOES-17_0001PANEL.GIF)
![NOAA-20 True Color Red-Green-Blue (RGB) and Infrared Window (11.45 µm) images at 2150 UTC [click to enlarge]](https://cimss.ssec.wisc.edu/satellite-blog/wp-content/uploads/sites/5/2019/01/190107_2150utc_noaa20_viirs_truecolor_infrared_EPAC_anim.gif)

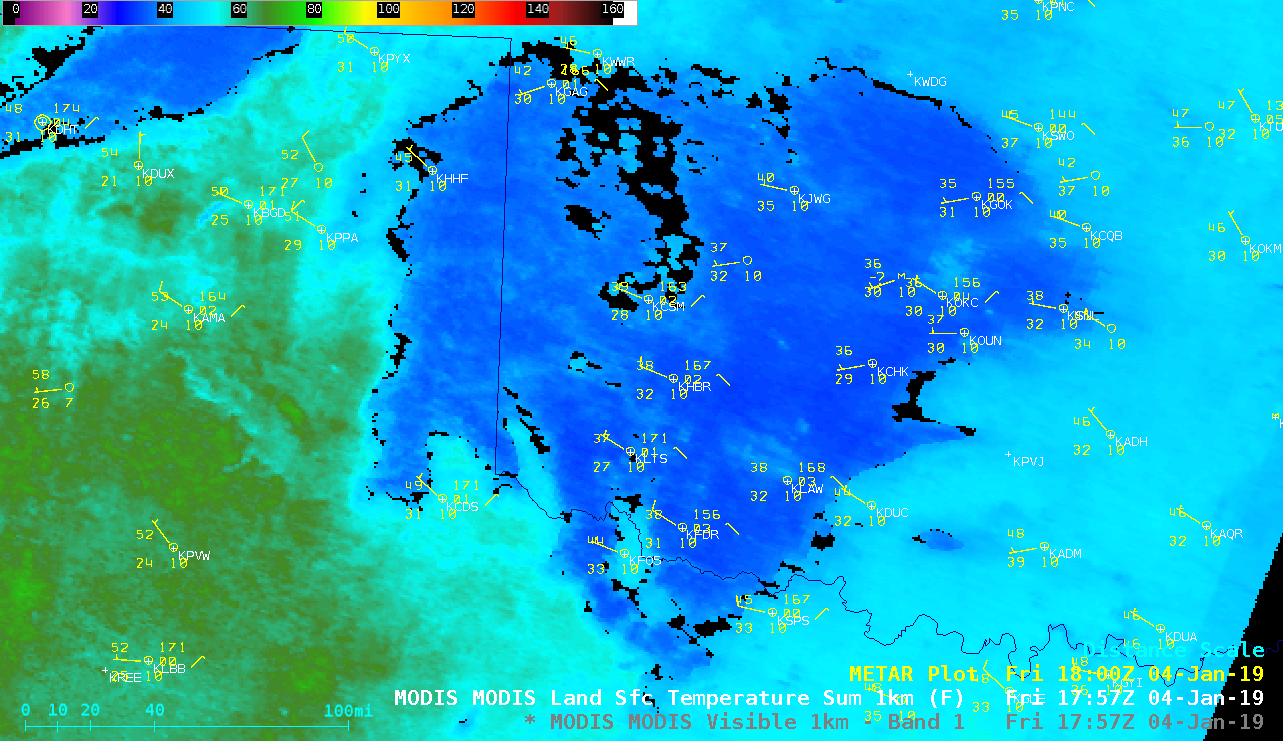

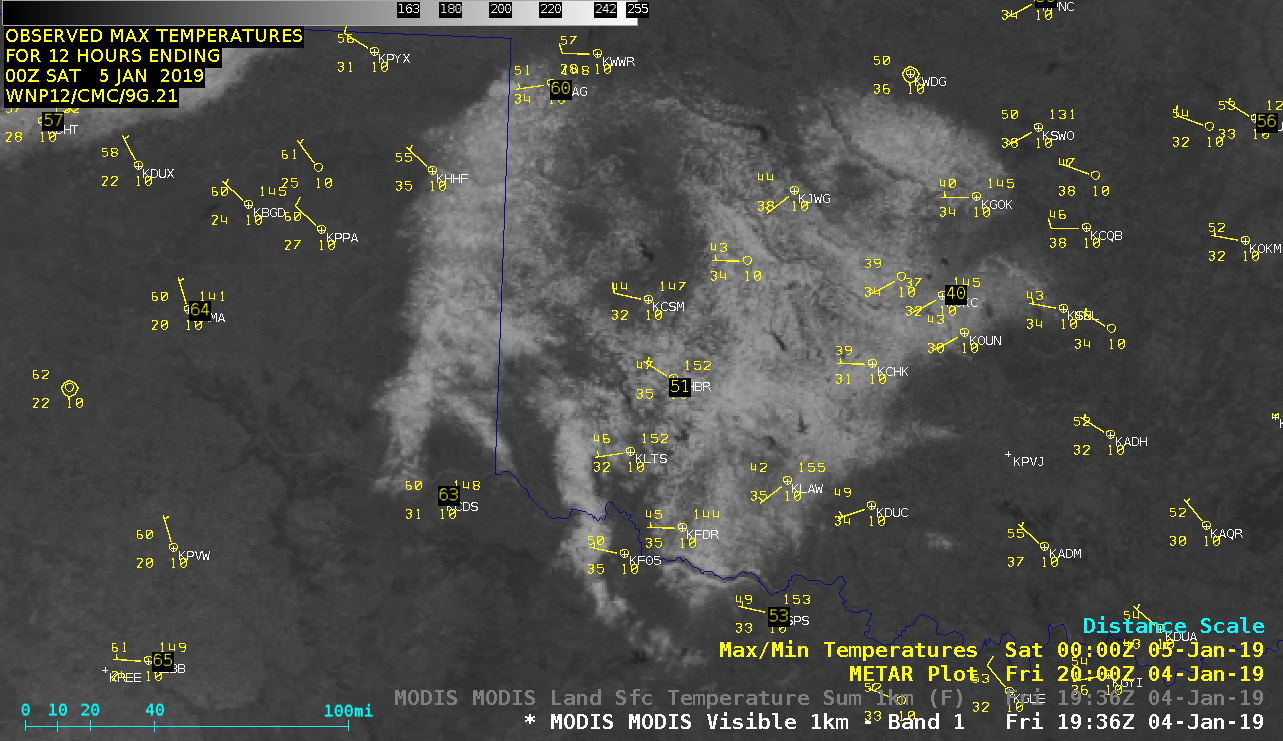
![Terra and Aqua MODIS Visible (0.65 µm) image and Land Surface Temperature product at 1757 an 1936 UTC [click to enlarge]](https://cimss.ssec.wisc.edu/satellite-blog/wp-content/uploads/sites/5/2019/01/190104_1757utc_1936utc_modis_visible_landSurfaceTemperature_TX_OK_anim.gif)
![GOES-16 "Red" Visible (0.64 µm) images, 04 and 05 January [click to play animation | MP4]](https://cimss.ssec.wisc.edu/satellite-blog/wp-content/uploads/sites/5/2019/01/190104_190105_goes16_visible_TX_OK_snowmelt_anim.gif)
![NOAA-20 VIIRS True Color RGB images on 04 and 05 January [click to enlarge]](https://cimss.ssec.wisc.edu/satellite-blog/wp-content/uploads/sites/5/2019/01/190104_190105_noaa20_viirs_truecolor_TX_OK_snowcover_anim.gif)
