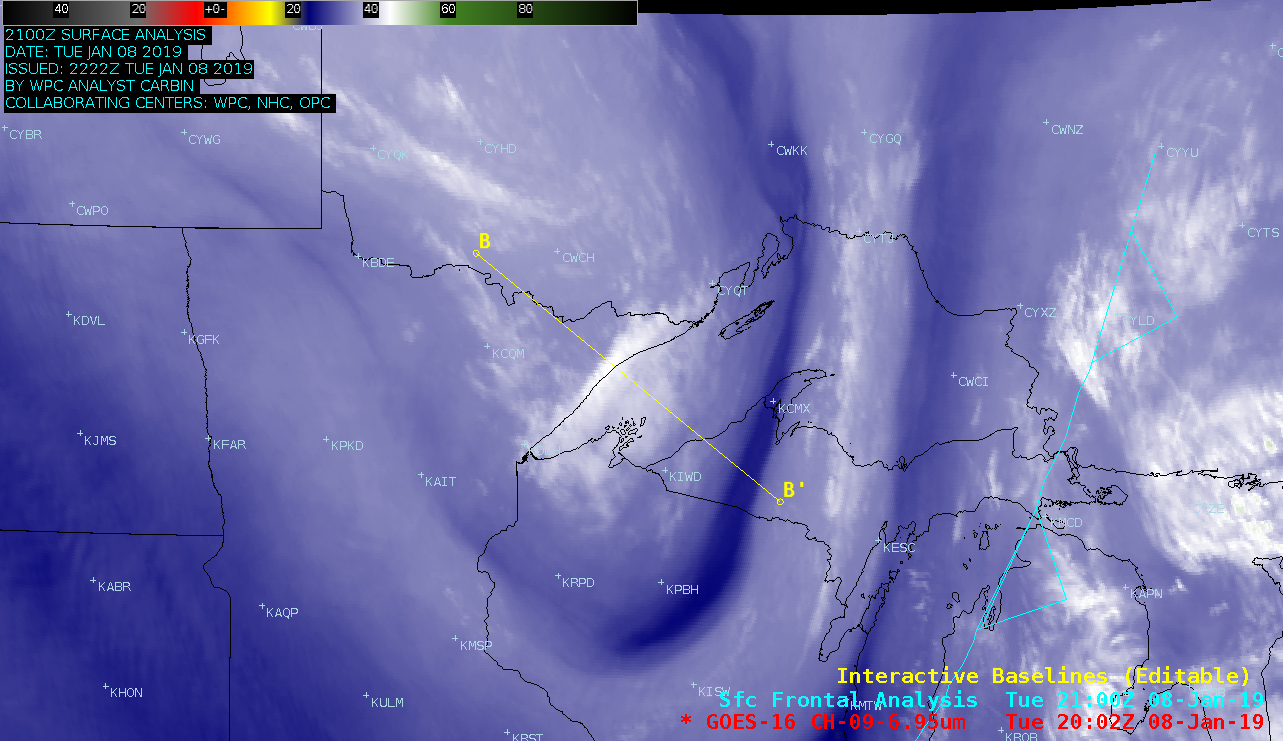
GOES-16 (GOES-East) Mid-level Water Vapor (6.9 µm) images (above) revealed the formation of a standing wave cloud along the Minnesota shoreline of Lake Superior on 08 January 2019. This cloud feature was formed by a vertically-propagating internal gravity wave that resulted from the interaction of strong post-frontal northwesterly flow with the topography of... Read More
![GOES-16 Mid-level Water Vapor (6.9 µm) images [click to play animation |MP4]](https://cimss.ssec.wisc.edu/satellite-blog/wp-content/uploads/sites/5/2019/01/mn_wv-20190108_200217.png)
GOES-16 Mid-level Water Vapor (6.9 µm) images [click to play animation | MP4]
GOES-16
(GOES-East) Mid-level Water Vapor (
6.9 µm) images
(above) revealed the formation of a standing wave cloud along the Minnesota shoreline of Lake Superior on
08 January 2019. This cloud feature was formed by a vertically-propagating internal gravity wave that resulted from the interaction of strong post-frontal northwesterly flow with the
topography of the shoreline — the terrain quickly drops from an elevation of about 2000 feet above sea level (over northeastern Minnesota) to about 600 feet above sea level (over Lake Superior) in a very short distance.
A northwest-to-southeast oriented cross section of RAP40 model fields along line segment B-B’ (below) showed a deep pocket of positive Omega (upward vertical motion, yellow to red colors) that corresponded to the cloud band along the Minnesota Lake Superior shoreline. Note that this Omega feature was vertically tilted in an “upshear” direction (toward the northwest), and extended upward to the 350-400 hPa pressure level. There was also an increasing upward component of the ageostrophic vertical circulation, which was likely the initial forcing mechanism leading to formation of the standing wave cloud seen on satellite imagery.
![RAP40 model cross section along line B-B' [click to play animation | MP4]](https://cimss.ssec.wisc.edu/satellite-blog/wp-content/uploads/sites/5/2019/01/190108_22utc_rap40_cross_section_MN.png)
RAP40 model cross section along line B-B’ [click to play animation | MP4]
A comparison of Aqua MODIS Visible (0.65 µm), Near-Infrared “Cirrus” (1.37 µm), Shortwave Infrared (3.7 µm) and Infrared Window (11.0 µm) images at 1912 UTC
(below) showed characteristics indicative of a cirrus cloud band composed of small ice crystals: a highly reflective signature at 1.37 µm, warm brightness temperatures
(around -5ºC) at 3.7 µm and cold brightness temperatures
(-40 to -43ºC) at 11.0 µm.
Aqua MODIS Visible (0.65 µm), Near-Infrared “Cirrus” (1.37 µm), Shortwave Infrared (3.7 µm) and Infrared Window (11.0 µm) images [click to enlarge]
A sequence of NOAA-20 (at 1808 and 1949 UTC) Suomi NPP (at 1859 UTC) VIIRS Visible (0.64 µm), Shortwave Infrared (3.74 µm) and Infrared Window (11.45 µm) images
(below) exhibited a similar warm 3.74 µm / cold 11.45 µm signature of the standing wave cloud.
![Suomi NPP and NOAA-20 VIIRS Visible (0.64 µm), Shortwave Infrared (3.74 µm) and Infrared Window (11.45 µm) images [click to enlarge]](https://cimss.ssec.wisc.edu/satellite-blog/wp-content/uploads/sites/5/2019/01/190108_suomiNPP_noaa20_viirs_visible_shortwaveInfrared_infraredWindow_MN_anim.gif)
Suomi NPP and NOAA-20 VIIRS Visible (0.64 µm), Shortwave Infrared (3.74 µm) and Infrared Window (11.45 µm) images [click to enlarge]
The coldest wave cloud infrared brightness temperature values of -40 to -47ºC seen on MODIS and VIIRS imagery roughly corresponded altitudes of 6.6 to 7.3 km (21,600 to 23,900 feet) according to 12 UTC
rawinsonde data from International Falls, Minnesota
(below).
![Plots of rawinsonde data from International Falls, Minnesota [click to enlarge]](https://cimss.ssec.wisc.edu/satellite-blog/wp-content/uploads/sites/5/2019/01/190108_KINL_RAOBS.GIF)
Plots of rawinsonde data from International Falls, Minnesota [click to enlarge]
View only this post
Read Less
![GOES-17 Low-level (7.3 µm, left), Mid-level (6.9 µm, center) and Upper-level (6.2 µm, right) Water Vapor images [click to play animation | MP4]](https://cimss.ssec.wisc.edu/satellite-blog/wp-content/uploads/sites/5/2019/01/190110_goes17_waterVapor_West_Pacific_storm_anim.gif)
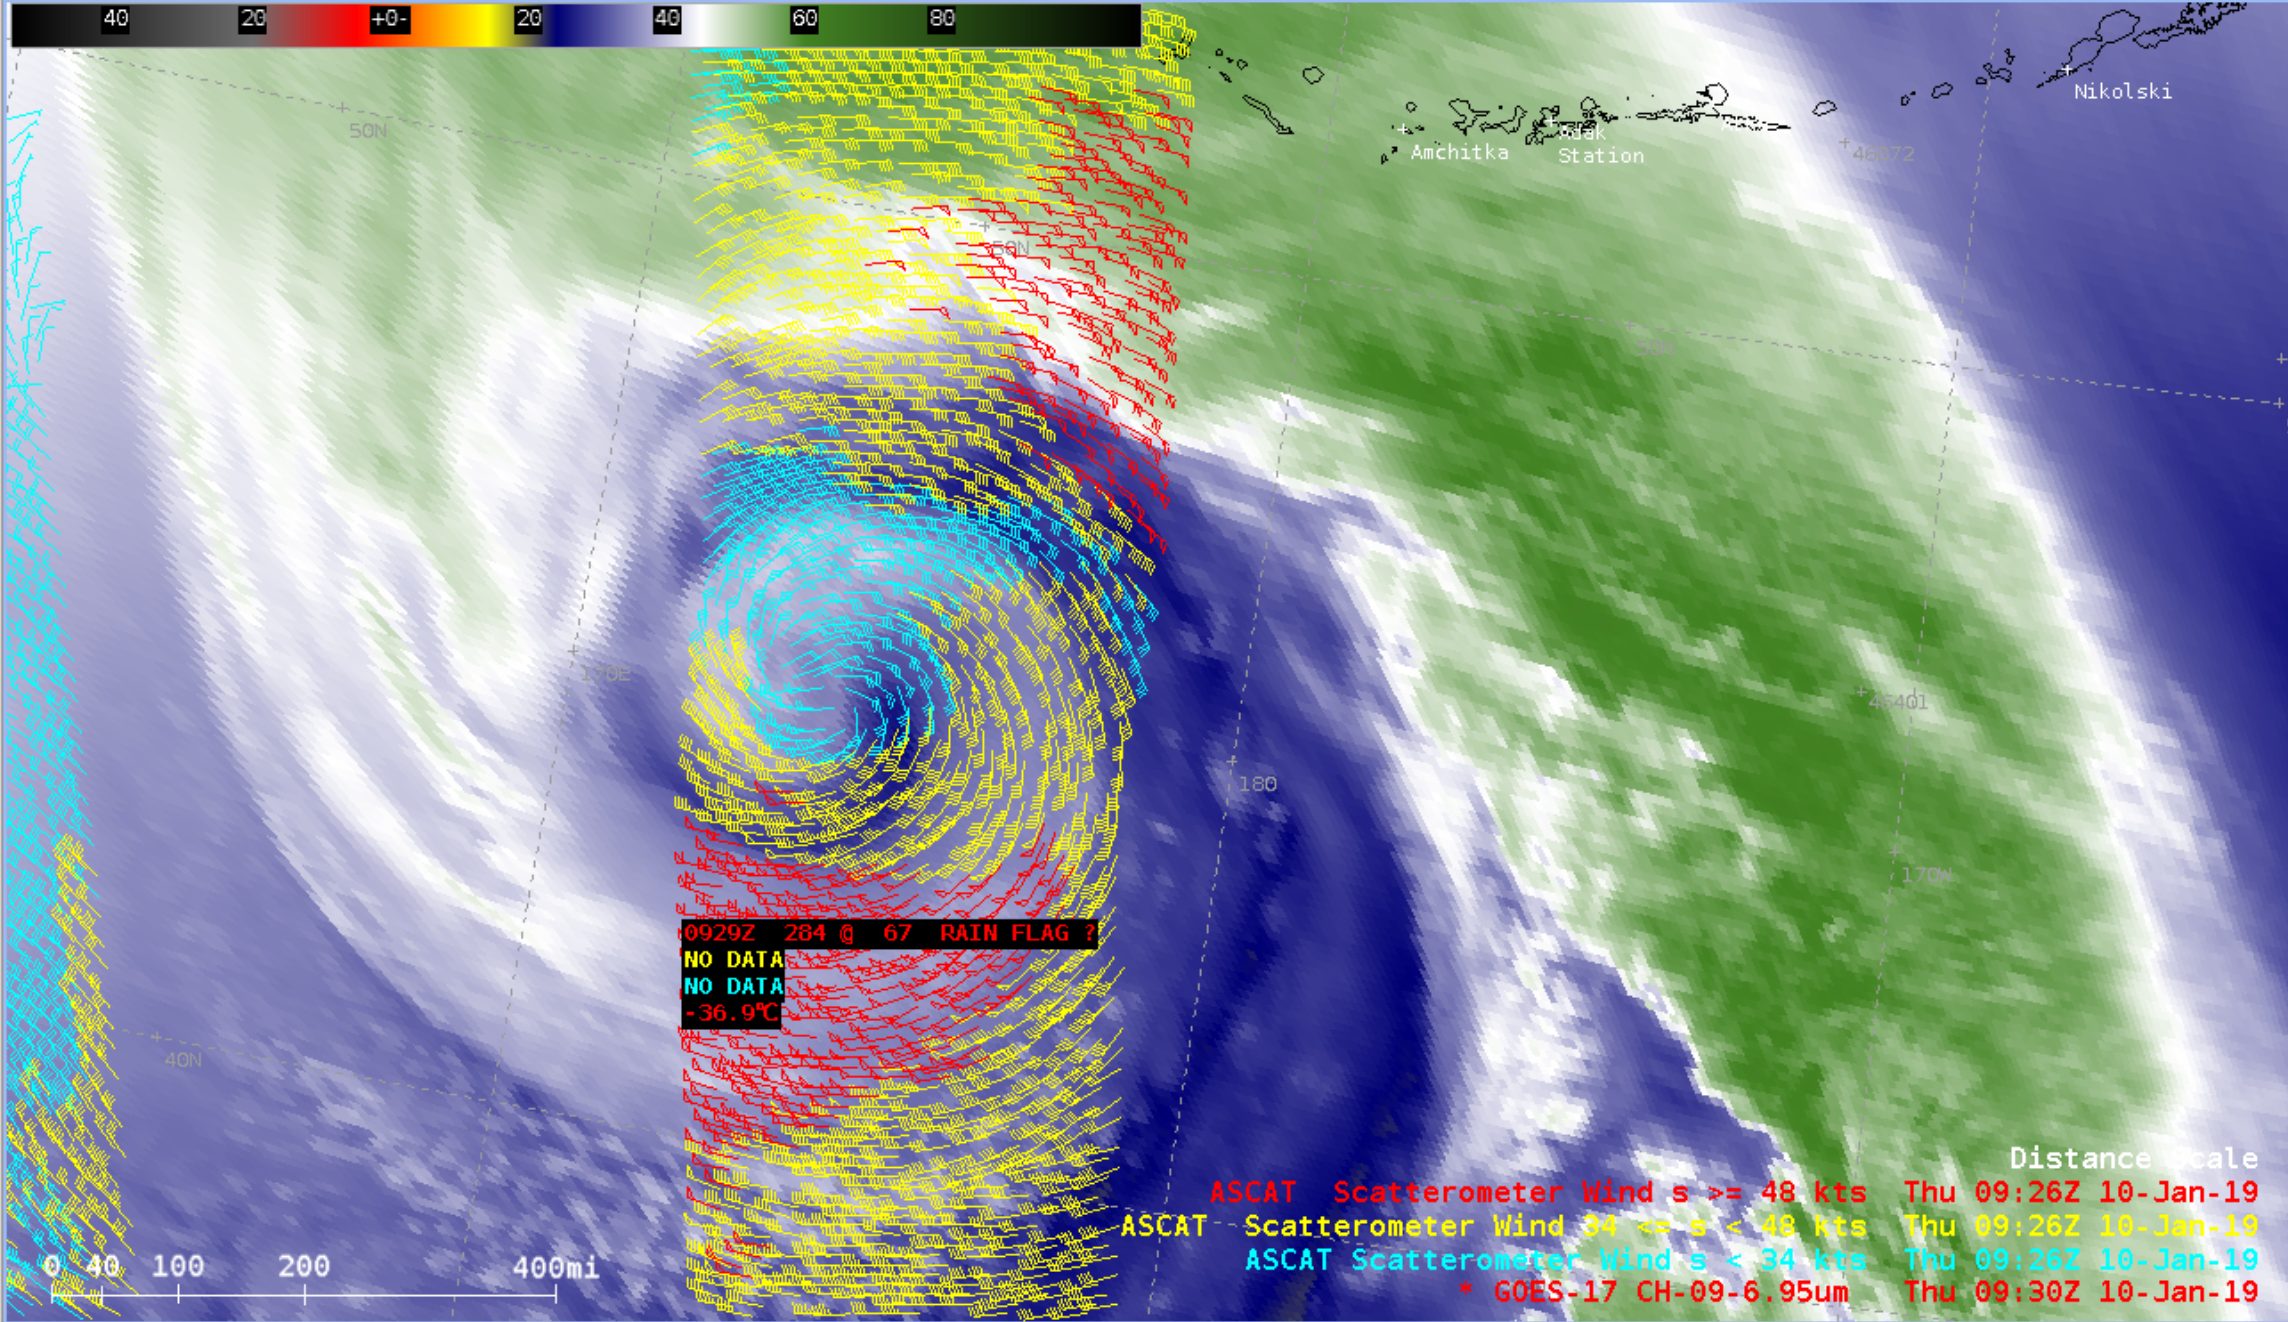
![GOES-17 Mid-level Water Vapor (6.9 µm) image with Metop-A ASCAT surface scatterometer winds [click to enlarge]](https://cimss.ssec.wisc.edu/satellite-blog/wp-content/uploads/sites/5/2019/01/190110_0930utc_goes17_waterVapor_ascat_winds_West_Pacific_anim.gif)
![NOAA-20 VIIRS True Color and Infrared Window (11.45 µm) images [click to enlarge]](https://cimss.ssec.wisc.edu/satellite-blog/wp-content/uploads/sites/5/2019/01/190110_suomiNPP_noaa20_viirs_truecolor_infrared_West_Pacific_anim.gif)
![GOES-16 Mid-level Water Vapor (6.9 µm) images [click to play animation |MP4]](https://cimss.ssec.wisc.edu/satellite-blog/wp-content/uploads/sites/5/2019/01/190108_goes16_waterVapor_MN_standing_wave_anim.gif)
![RAP40 model cross section along line B-B' [click to play animation | MP4]](https://cimss.ssec.wisc.edu/satellite-blog/wp-content/uploads/sites/5/2019/01/190108_ruc40_cross_section_MN_anim.gif)
![GOES-16 Mid-level Water Vapor (6.9 µm) images, with overlays of surface fronts and NAM40 geopotential height and vorticity [click to play animation | MP4]](https://cimss.ssec.wisc.edu/satellite-blog/wp-content/uploads/sites/5/2019/01/190108_goes16_waterVapor_rap40_height_vorticity_OH_PA_tornado_anim.gif)
